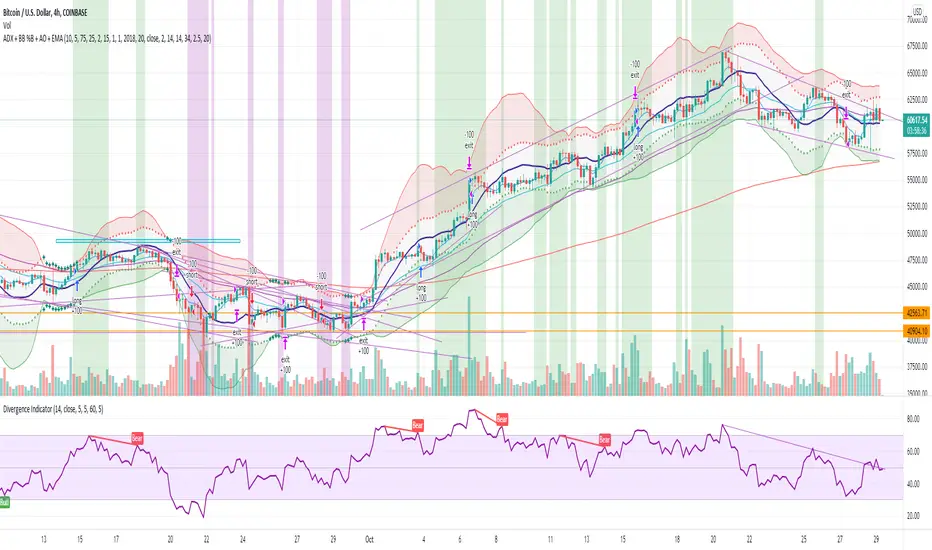
ADX + BB %B + AO + EMA [Luca Massuda]This trading strategy combines different indicators:
1) ADX, Average Directional Movement: to spot the trend
2) BB %B Bollinger Band %B: to spost relative price position to Bollinger Bands
3) AO Awesome Oscillator: to spot momentum
4) ema 5,ema21, ema50, ema200: to decide long or short position
You can configure:
Take profit % : at which % gains to take profit from the entry price
Stop loss % : at which % stop loss from the entry price
BB %B Overbought: At which level you consider Overbought respect to Bollinger Bands (values 0 to 100)
BB %B Oversold: At which level you consider Oversold respect to Bollinger Bands (values 0 to 100)
Awesome Oscillator: AO level to consider a long or short position +/- 2
ADX: ADX value to consider a long or short position
Start Date, Month, Year: Starting point for a backtesting strategy
Lenght , Source , Standard Deviation: Bollinger Bands values
ADX smoothing, DI Lenght: ADX values
Green and purple zones indicate when the strategy can go long or short.
Default Long conditions:
ema5>ema21 and ema50>ema200 and bb>75% and ao>2 and adx>15
Default Short conditions:
ema515
ابحث في النصوص البرمجية عن "momentum"
Kifier's MFI/STOCH Hidden Divergence/Trend BeaterMFI/STOCH Hidden Divergence/Trend Beater
General Idea:
My premise around this strategy was to make a general strategy for crypto that would help out with finding entry positions for when you’re bullish on a crypto and want to hold on for a while, and at the same time avoiding massive drops. Essentially a way to mix long term/ swing trading; I somewhat achieved my goal however it still requires a lot of logic tuning of the trend averages.
I’m a huge proponent of volume indicators and coupled with average closing price, I think this gives a really good idea of what is happening with the market. It gives an idea on the market and retail investor sentiment. This generally gives you logical entry positions (Although I don’t know how amazing that will work with all cryptos, there’s a fine line between a good strategy and one that just rides bubble market conditions, some would argue that’s still a success and others not)
How it works:
There are many components to the strategy that try to do different things:
First of all there are two types of entries, a MFI hidden divergence with a STOCH check, essentially it will only fire when a divergence is detected while STOCH is above 50%, however this might be changed in the future as due to the volatile nature of cryptos, the STOCH is not too effective. The second entry is a simple MFI/STOCH trend, if STOCH is above 50% and the trend is detected to be in a trending long, once a MFI crossover over the 50% line is detected an entry is placed, this is designed to get out profit where the divergence would otherwise be less accurate during strongly trending conditions.
-MFI is a great indicator, as a volume weighted momentum indicator I find it the most accurate of all, the STOCH however is a great indicator to get a general picture of simple market conditions and can filter out the emotional noise of retail investors.
-VWMA and an SMA (The bottom oscillator) gives an idea of the trend tacking into account of the volume, this serves as a more short term filter of the trend for filters.
-OBV checks are done between the OBV and an EMA of the OBV, to get the idea of a volume weighted long trend, which is important for crypto as there are massive rallies to go up due to retail greed, it’s great to jump onto it at the beginning, and get off before the stack of cards fall apart.
-ATR is used to detect when the market is relatively just ranging or moving sideways, which is where the hidden divergence entries are done, during predictable and profitable market conditions.
- Stop loss is based on the closest support of the entry, this is a nice medium of room to breath but also an actual stop loss.
Future plans and improvements:
Currently there’s a lot I want to improve, mostly the divergence detection and the overall sharpe ratio could be much better, but the current value of 0.5 gives me hope that the strategy is onto something. I also want to change TP from a percentage stop to something more dynamic but that might be too optimistic. The current plan is to paper trade test this either by manual or by a python bot, to see how it performs with some user input as well.

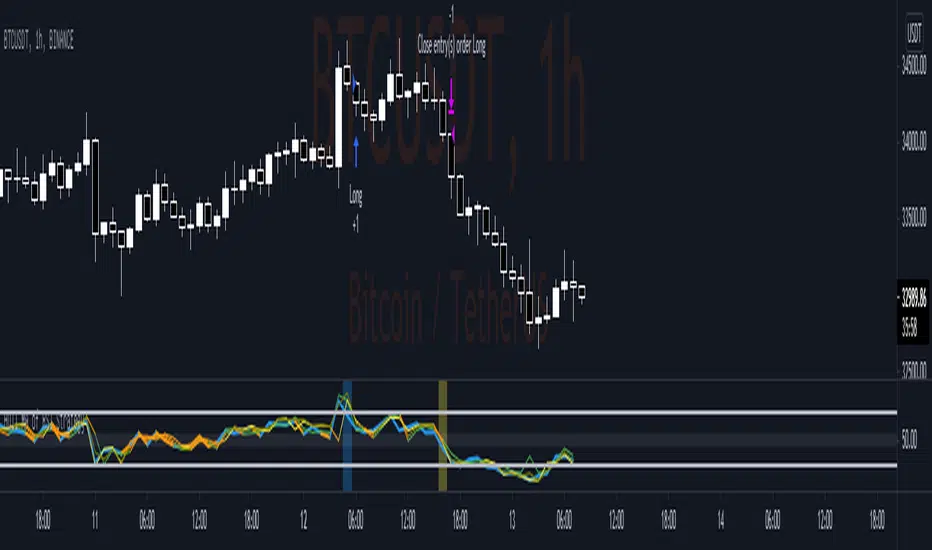
Hull MA of RSI StrategyThis simple strategy base on RSI value of Close Price, High Price, Low Price, Median Price and RSI value smoothed by Hull Moving Average.
1. Optimize parameter on BTC H1 Binance chart
RSI period: 13
Hull MA period: 3
Middle Channel: 55-45
Overbough / Oversold: 70-30
2. Setup
2.1 Long Condition
- RSI of Close Price crossunder Overbought
- Close Price lower than Median Price (HL2)
- RSI of Median Price above Overbought
2.2 Close Long Position
- RSI of Close Price crossover Overbought (Take profit)
or
- RSI of Low Price crossunder upper value of Middle Channel (Stop loss)
2.2 Short Condition
- RSI of Close Price crossover Oversold
- Close Price higher than Median Price (HL2)
- RSI of Median Price below Oversold
2.2 Close Long Position
- RSI of Close Price crossunder Oversold (Take profit)
or
- RSI of High Price crossover lower value of Middle Channel (Stop loss)
3. Idea
- Follow strong momentum of Price to catch Flash Buy/Sell Bar in Crypto Market
- RSI of High Price and Low Price help to regconize setup failure quickly.
- This case study desire to find a balance of Winrate, Profit factor, Sharpe Ratio
Combo Backtest 123 Reversal & RSI based on ROC This is combo strategies for get a cumulative signal.
First strategy
This System was created from the Book "How I Tripled My Money In The
Futures Market" by Ulf Jensen, Page 183. This is reverse type of strategies.
The strategy buys at market, if close price is higher than the previous close
during 2 days and the meaning of 9-days Stochastic Slow Oscillator is lower than 50.
The strategy sells at market, if close price is lower than the previous close price
during 2 days and the meaning of 9-days Stochastic Fast Oscillator is higher than 50.
Second strategy
This is the new-age indicator which is version of RSI calculated upon
the Rate-of-change indicator.
The name "Relative Strength Index" is slightly misleading as the RSI
does not compare the relative strength of two securities, but rather
the internal strength of a single security. A more appropriate name
might be "Internal Strength Index." Relative strength charts that compare
two market indices, which are often referred to as Comparative Relative Strength.
And in its turn, the Rate-of-Change ("ROC") indicator displays the difference
between the current price and the price x-time periods ago. The difference can
be displayed in either points or as a percentage. The Momentum indicator displays
the same information, but expresses it as a ratio.
WARNING:
- For purpose educate only
- This script to change bars colors.

3x SuperTrend Strategy (Mel0nTek) V1This is a triple SuperTrend based strategy for lower time frame trades such as day trades and scalping. I have not seen many strategies that combine multiple SuperTrends so I thought I would publish this one since I put it together and have been quite happy with the results. I have found through testing that the best results are on currency exchange markets such as Crypto or Forex on 1-15 min time frames.
The core idea was inspired by a youtube video put out by Trade Pro:
"Trade Pro - HIGHEST PROFIT Triple Supertrend Trading Strategy Proven 100 Trade Results"
I went ahead and set the defaults to the ones he uses in his video for anyone who wants to try a configuration similar to his. They work pretty well in general, however the EMA, SuperTrend ATR multipliers, and P/L ratio can be tuned/optimized to fit the timeframe/market desired. The video is quite good but not a required watch as I will explain below.
The 200EMA is used as a medium-term trend direction indicator.
- Price closing consistently above the 200EMA means that only long positions should be entered.
- Price closing consistently below 200EMA means that only short positions should be entered.
The 3 SuperTrend indicators should be used as direction confirmation for entries. Typically, price above SuperTrend indicates bullish movement, while price below SuperTrend indicates Bearish movement. However by itself, it is not a great indication to enter/exit positions in my experience. By combining 3 of them with slightly longer periods and increased ATR multipliers, we can get much stronger confirmation of trend direction/strength.
The way they are used in this strategy is such that:
- We only want to enter a position if at least 2 out of 3 SuperTrends are on our side.
- 3/3 SuperTrends on our side is the best case, since we are taking trades WITH momentum/price strength.
- The second farthest SuperTrend from entry price is used as a Stop Loss
SuperTrend being on our side is not the only requirement for an entry however. The probability of success is increased with SuperTrend, and a longer EMA on our side, but we want to be sure that we aren't getting in too late/after the movement has already happened.
So we use Stoch RSI to pick our entries where price is oversold/overbought and reversing. That means the Stoch RSI is above 80, or below 20, and our indication to enter the trade is when the 2 lines cross/begin reversing direction.
So with trend direction on our side, we can get really good entries at these oversold/overbought extremes, especially as it's reversing (Stoch RSI K and D are crossing). This allows us to use the SuperTrend as a support/stop loss on our entry since price should be above it.
Then we just target 1.5x our max loss so that even if we only win 50% of the time, we still make a profit.
The explicit rules of this strategy are as follows:
=== Rules ===
long only
- price above EMA200
short only
- price below EMA200
Stop Loss = 2nd SuperTrend line above (short) or below(long) entry candle
Profit = 1.5x SL/risk (Profit Ratio x Max Loss)
=== Entry Setup ===
LONG
- Stoch RSI below 20, cross up
- at least 2 SuperTrend lines below close
SHORT
- Stoch RSI above 80, cross down
- at least 2 SuperTrend lines above close
P.S. Special thanks to Trade Pro for producing so many quality videos, putting strategy claims to the test, and providing me with so many good ideas I apply to my own strategies.

DRSI DMA Scalping Strategy No RepaintThis strategy compares the slope of a Moving Average (of your choosing) to the slope of a Momentum Indicator (of your choosing). Zero is the center line because 0 slope means sideways movement. When both lines cross your buy threshold, it buys. When both lines cross your Sell threshold, it sells. The lines may look choppy, but that is probably because it is referencing a different timeframe than what the chart is set to. I left as many settings adjustable by the user as possible so you can tune this strategy to the relative behavior of whatever you are trading.
This also includes a No Repaint function so the backtest should be as close to live trading as possible.

Combo Backtest 123 Reversal & Percentage Volume Oscillator (PVO) This is combo strategies for get a cumulative signal.
First strategy
This System was created from the Book "How I Tripled My Money In The
Futures Market" by Ulf Jensen, Page 183. This is reverse type of strategies.
The strategy buys at market, if close price is higher than the previous close
during 2 days and the meaning of 9-days Stochastic Slow Oscillator is lower than 50.
The strategy sells at market, if close price is lower than the previous close price
during 2 days and the meaning of 9-days Stochastic Fast Oscillator is higher than 50.
Second strategy
The Percentage Volume Oscillator (PVO) is a momentum oscillator for volume.
PVO measures the difference between two volume-based moving averages as a
percentage of the larger moving average. As with MACD and the Percentage Price
Oscillator (PPO), it is shown with a signal line, a histogram and a centerline.
PVO is positive when the shorter volume EMA is above the longer volume EMA and
negative when the shorter volume EMA is below. This indicator can be used to define
the ups and downs for volume, which can then be use to confirm or refute other signals.
Typically, a breakout or support break is validated when PVO is rising or positive.
WARNING:
- For purpose educate only
- This script to change bars colors.

Zweig Market Breadth Thrust Indicator StrategyThe Breadth Thrust Indicator is a technical indicator which determines market momentum, signaling the start of a potential new bull market.
The Breadth Thrust Indicator was developed by Martin Zweig, an American stock investor, financial analyst, and investment adviser. According to Zweig, the concept is based on the principle that the sudden change of money in the investment markets elevates stocks and signals increased liquidity. In other words, this indicator is all about how quickly the NYSE's advancing and declining numbers go from poor to great in a compressed time period.
A "Thrust" indicates that the stock market has rapidly changed from an oversold condition to one of strength, but has not yet become overbought. This is very rare and has happened only a few times. Dr . Zweig also points out that most bull markets begin with a Breadth Thrust.
More info can be found at www.investopedia.com
I have inspired by indicator introduced in TradingView by LazyBear and adopted the logic from there. Thanks LazyBear !!!
Though indicator signals the new Bull market, but I have not found much information how to use it in daily market. So I had come up with a strategy, which would allow us to trade SPY, QQQ , AMEX and securities under these markets.
I have used MA setting as 65 (since Zweig indicator setting was 10 days , based on that I set 65 for Hourly chart ... 10d x 6.5 Hrs = 65 in my startegy). You have to change this setting if you change the timeframe. Also , note that this strategy is for Stock Market only.
Strategy Rule/Settings
===================
Select the market type based on your security symbol.
SPY => use NYSE
QQQ => use NASDAQ
any other security => check exchange it was listed and select the corresponding market.
if you dont know , use COMBINED option
BUY
====
when indicator cross 0.40 from below
Note:
1. see how well it picks the bottoms ... example : Nov 2020 ....
2. setting 0.45 is also produces good results , only thing is you get more signals.
EXIT
=====
Exit when indicator cross down from 0.60 . I have used RSI (5) for partial exits. These two are available in settings
Close the whole position when indicator crossing down 0.40
STOP LOSS
=========
defaulted to 5%
Please Note , I have tested SPY , QQQ on Horly chart with MA 65. You need to chnage the MA setting based on your time frame and check the results.
WARNING
========
For the use of educational purposes only

Combo Backtest 123 Reversal & Inertia Strategy This is combo strategies for get a cumulative signal.
First strategy
This System was created from the Book "How I Tripled My Money In The
Futures Market" by Ulf Jensen, Page 183. This is reverse type of strategies.
The strategy buys at market, if close price is higher than the previous close
during 2 days and the meaning of 9-days Stochastic Slow Oscillator is lower than 50.
The strategy sells at market, if close price is lower than the previous close price
during 2 days and the meaning of 9-days Stochastic Fast Oscillator is higher than 50.
Second strategy
The inertia indicator measures the market, stock or currency pair momentum and
trend by measuring the security smoothed RVI (Relative Volatility Index).
The RVI is a technical indicator that estimates the general direction of the
volatility of an asset.
The inertia indicator returns a value that is comprised between 0 and 100.
Positive inertia occurs when the indicator value is higher than 50. As long as
the inertia value is above 50, the long-term trend of the security is up. The inertia
is negative when its value is lower than 50, in this case the long-term trend is
down and should stay down if the inertia stays below 50.
WARNING:
- For purpose educate only
- This script to change bars colors.

Buy The Dips - MA200 OptimisedThe strategy combines a contrarian approach (buying the dips) with a trend-following logic (only when the price is above the MA200)
The strategy seeks to find the best times when buying the dips on the asset should result to be more profitable.
The price above a long-term moving average indicates momentum that increases the possibility of profiting from buying the asset on short-term weakness.

BB Keltner Squeeze StrategyShows all bollinger bands (solid lines) and keltner channels (dotted line) and will go long/short when a squeeze happens between bollinger bands and keltner channel and exit the positions once there is no more momentum

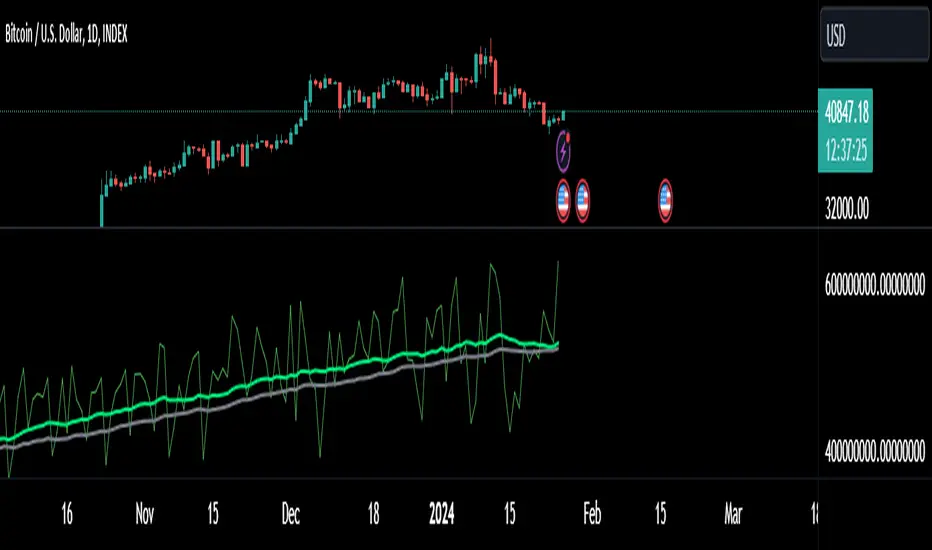
Hash Ribbons Backtest - Bitcoin Beats YT
Hello Hello Hello and welcome back to Bitcoin Beats!
This is a script written by capriole_charles
Go check out the original!
I have added leverage and stoploss % but also made it a strategy so we can look back at past trades to see patterns and profit.
Personally I feel this is not enough data to trade off as BTC is such a young asset. However I have seen other models similar to this for other assets that hold strong.
Trade safe!
Good bye from bitcoin beats!
Not Meant For The 1H! My Bad! higher timeframes are better!
The "Spring" is the confirmed Miner capitulation period:
The 1st "gray" circle is the start of Capitulation (1 month Hash Rate crosses UNDER 2 month Hash Rate)
Last "green" circle is the end of Capitulation (1 month Hash Rate crosses OVER 2 month Hash Rate)
The "greener" the spring gets (up until blue) represents Hash Rate recovery (it is increasing)
The "blue" circle is the first instance of positive momentum following recovery of Hash Rate (1m HR > 2m HR). This is historically a rewarding place to buy with limited downside.
Combo Backtest 123 Reversal & Dynamo This is combo strategies for get a cumulative signal.
First strategy
This System was created from the Book "How I Tripled My Money In The
Futures Market" by Ulf Jensen, Page 183. This is reverse type of strategies.
The strategy buys at market, if close price is higher than the previous close
during 2 days and the meaning of 9-days Stochastic Slow Oscillator is lower than 50.
The strategy sells at market, if close price is lower than the previous close price
during 2 days and the meaning of 9-days Stochastic Fast Oscillator is higher than 50.
Second strategy
In July 1996 Futures magazine, E. Marshall Wall introduces the
Dynamic Momentum Oscillator (Dynamo). Please refer to this article
for interpretation.
The Dynamo oscillator is a normalizing function which adjusts the
values of a standard oscillator for trendiness by taking the difference
between the value of the oscillator and a moving average of the oscillator
and then subtracting that value from the oscillator midpoint.
WARNING:
- For purpose educate only
- This script to change bars colors.
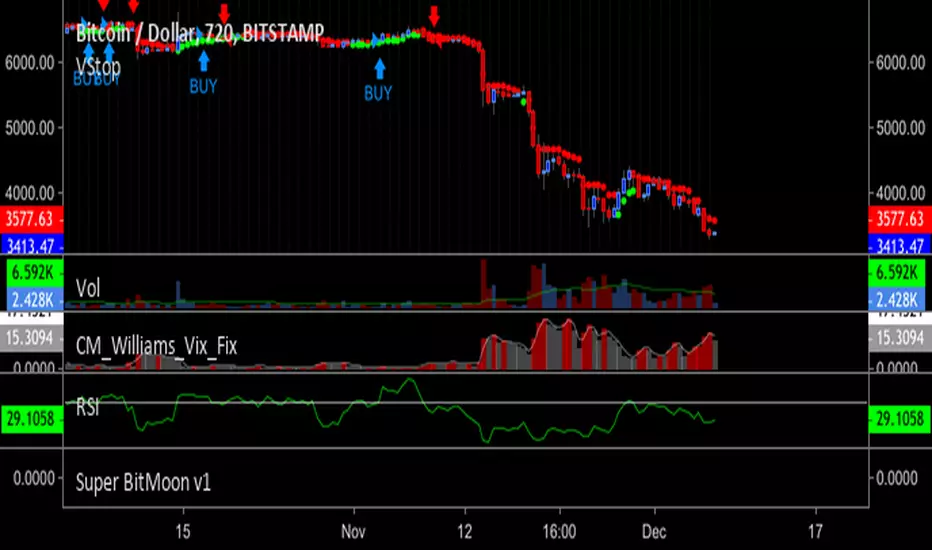
M-SQUEEZEScript for Swing Trading. It use the following indicators:
- SQUEEZE MOMENTUM INDICATOR (LAZYBEAR)
- RSI VOLUME WEIGHTED (LAZYBEAR)
- PARABOLIC SAR
Settings for OANDA:SPX500USD at 2H

Simple Price Momentum - How To Create A Simple Trading StrategyThis script was built using a logical approach to trading systems. All the details can be found in a step by step guide below. I hope you enjoy it. I am really glad to be part of this community. Thank you all. I hope you not only succeed on your trading career but also enjoy it.
docs.google.com
Combo Strategy 123 Reversal & Commodity Selection Index This is combo strategies for get a cumulative signal.
First strategy
This System was created from the Book "How I Tripled My Money In The
Futures Market" by Ulf Jensen, Page 183. This is reverse type of strategies.
The strategy buys at market, if close price is higher than the previous close
during 2 days and the meaning of 9-days Stochastic Slow Oscillator is lower than 50.
The strategy sells at market, if close price is lower than the previous close price
during 2 days and the meaning of 9-days Stochastic Fast Oscillator is higher than 50.
Second strategy
The Commodity Selection Index ("CSI") is a momentum indicator. It was
developed by Welles Wilder and is presented in his book New Concepts in
Technical Trading Systems. The name of the index reflects its primary purpose.
That is, to help select commodities suitable for short-term trading.
A high CSI rating indicates that the commodity has strong trending and volatility
characteristics. The trending characteristics are brought out by the Directional
Movement factor in the calculation--the volatility characteristic by the Average
True Range factor.
Wilder's approach is to trade commodities with high CSI values (relative to other
commodities). Because these commodities are highly volatile, they have the potential
to make the "most money in the shortest period of time." High CSI values imply
trending characteristics which make it easier to trade the security.
The Commodity Selection Index is designed for short-term traders who can handle
the risks associated with highly volatile markets.
WARNING:
- For purpose educate only
- This script to change bars colors.

EMA X BF 🚀EMA Crossover Strategy
A simple EMA cross is a useful indication of a change in direction of a trend and is a very popular tool in trading. It can also be useful to judge price action momentum or severity by looking at the angle of the 2 EMAs, or the distance between them.
There are 2 Exponential Moving Averages, one fast and one slow. When the fast EMA crosses above the slow EMA, this can be considered bullish and may signal an upside move. Conversely, a cross to the downside of the fast EMA under the slow EMA can be considered bearish.
This strategy uses the same principle but uses different sources for the 2 EMAs; instead of using close values, we use ohlc4 values for the fast EMA and hlc3 values for the slow EMA.
The idea is that a trader might enter a long position upon a cross up and reverse position and go short upon the next cross down.
We use a simple 6% stop loss for both long and short positions.
This strategy is tuned to a 6hr chart for Bitcoin USD pairs.
INSTRUCTIONS
Go Long when the background is green
Go short when the background is red
White background means sideways market: a no trade zone

QuantCat Chande Swinger StrategyQuantCat Chande Swinger
This strategy is designed to be used on the 1 minute with mainly bitcoin, and cryptocurrencies. But parameters can be adjusted to ANY pair.
After some long research about chande momentum oscillator, I decided to create a strategy using normal distribution percentage levels to snipe entries. This in turn on the 1 minute can create a nice profit over a consecutive amount of days, the end goal is to get a stronger version of this strategy running on a bot and print some money. This strategy is tightly defined, and can be loosened up to make more trades too- giving a higher sample size and better sharpe ratio.
The strategy checks to see if the Chande value is in an extreme percentile based on the last few hundred chande values- if it is it will open a position.
No stoploss or take profit implemented into the swinger yet, but this will be the next addition to really minimise loss and amplify potential profits.
Any liquid crypto pair on the low timesframes will net a good result with this strategy.
We also have a free 15M and 1H strategy available too.
You can join our discord server to get live alerts for the strategies as well as speak to our devs! Link in signature below!!!

SMA 10/100 Crossover Strategy intended for BTCUSD on 4 hourlyA really simple trend/momentum following crossover strategy intended for higher timeframes to trade BTCUSD and other crypto pairs.

Commodity Selection Index Backtest The Commodity Selection Index ("CSI") is a momentum indicator. It was
developed by Welles Wilder and is presented in his book New Concepts in
Technical Trading Systems. The name of the index reflects its primary purpose.
That is, to help select commodities suitable for short-term trading.
A high CSI rating indicates that the commodity has strong trending and volatility
characteristics. The trending characteristics are brought out by the Directional
Movement factor in the calculation--the volatility characteristic by the Average
True Range factor.
Wilder's approach is to trade commodities with high CSI values (relative to other
commodities). Because these commodities are highly volatile, they have the potential
to make the "most money in the shortest period of time." High CSI values imply
trending characteristics which make it easier to trade the security.
The Commodity Selection Index is designed for short-term traders who can handle
the risks associated with highly volatile markets.
WARNING:
- For purpose educate only
- This script to change bars colors.

Ehlers Cycle StrategyThis uses Ehlers methods to create a cycle trading strategy.
It finds the dominant cycle in the market, then creates filters out noise to create an oscillator. It then creates a trigger line using momentum to predict a reversal in price. Finally, Ehlers Empirical Mode Discriminator is used to evaluate trends and eliminate trading against the trend.
Shout out to HPotter, Everget, and LazyBear for implementing many of Ehlers indicators, which I sampled to create this indicator and strategy.

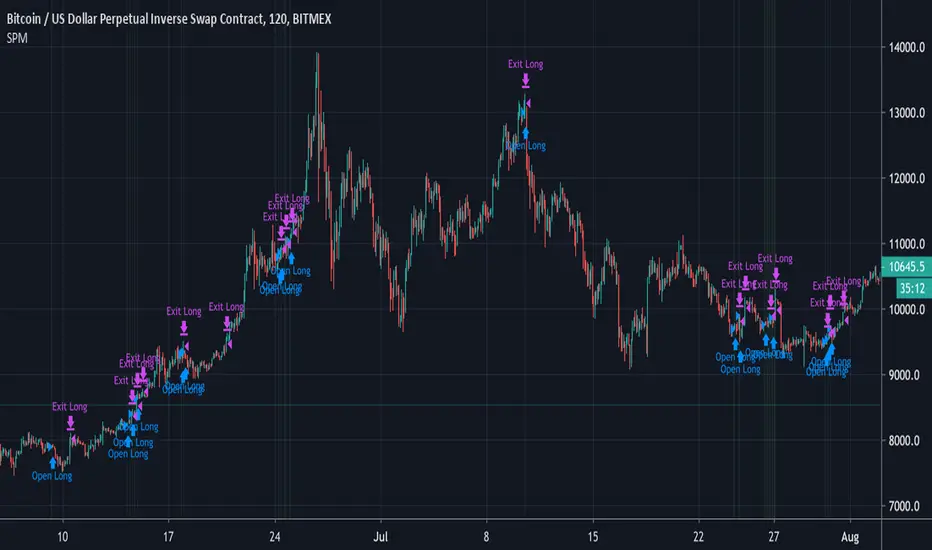
BTC Swinger v1Daily interval swing trading algorithm based on momentum techniques using ATR Stops. Made by Kory Hoang from Stably.
Shout out to the Advanced Crypto Asset Trading crew! ;)
