Alpha Dynamic Momentum Index Pine@v=4- What Is Dynamic Momentum Index?
- The dynamic momentum index is a technical indicator used to determine if an asset is overbought or oversold. It can be used to generate trade signals in trending and ranging markets.
- The dynamic momentum index was developed by Tushar Chande and Stanley Kroll and is similar to the relative strength index (RSI). The main difference between the two is that the RSI uses a fixed number of time periods (usually 14) in its calculation, while the dynamic momentum index uses different time periods as volatility changes, typically between five and 30.
- The number of time periods used in the dynamic momentum index decreases as volatility in the underlying security increases, making this indicator more responsive to changing prices than the RSI. This is particularly useful when an asset's price moves quickly as it approaches key support or resistance levels. Because the indicator is more sensitive, traders can potentially find earlier entry and exit points than with the RSI, but it could also be more prone to whipsaws and false signals.
ابحث في النصوص البرمجية عن "momentum"

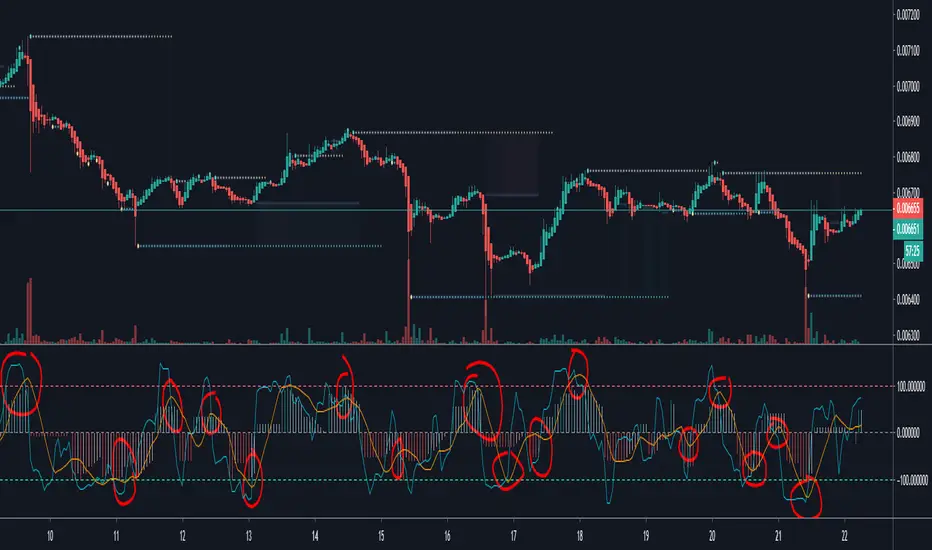
RSI/Momentum derivativesthis indicator plots the derivatives of the RSI to get more leading sense of direction of the price
we know that the rsi shows us the momentum of the price, so the easiest/logical way to interpret this indicator and benefit from it is as follows:
- see the price as 'distance'
- see the rsi as 'speed'
- see the rsi/momentum of the above/'speed' as 'velocity'
- see the rsi/momentum of the above/'velocity' as 'acceleration'
once you understand this you can analyse and interpret this indicator to give you a more leading analysis and more accurate entry and exit points.
- also includes the RMA for each RSI derivative which can help for identifying breakouts, direction of price, pivot points and more.
in the above chart
- black is the standard rsi/speed
- orange is the momentum of the rsi/velocity
- green is the momentum of the velocity

CT Reverse Chande Momentum OscillatorIntroducing the Caretakers Reverse Chande Momentum Oscillator.
The Chande momentum oscillator is a technical momentum indicator which calculates the difference between the sum of recent gains and the sum of recent losses and then divides the result by the sum of all price movement over the same period.
It is used to gauge “pure momentum”.
It bears similarities to other momentum indicators such as the Stochastic, Rate of Change and the Relative Strength Index, but other unique features render it a handy tool in the traders handset.
The CMO was developed by Tushar Chande.
The author introduced the indicator in his 1994 book “The New Technical Trader “.
The CMO has a normal range of values between +100 and -100.
I have reverse engineered the CMO formula to derive a dual purpose function.
The function can calculate the chart price at which the CMO will reach a particular CMO scale value.
The function can also calculate the chart price at which the CMO will equal its previous value.
I have employed this function here to give the price level where the CMO will equal :
Upper alert level ( default 50 )
Zero-Line
Lower alert level ( default -50 )
Previous CMO value
These crossover levels are displayed via an optional infobox with choice of user selected info.
The advantage of knowing the exact prices that this will happen should give the user an additional edge and precision in risk management.
Traditionally traders and analysts will consider:
Positives values above 50 indicate an “overbought” condition
Negative values below -50 indicate an “oversold” condition
Common traditional ways to derive signals from the CMO :
When the CMO crosses above the zeroline, a buy signal is generated.
When the CMO crosses below the zeroline, a sell signal is generated.
When the SMI crosses below -50 and then moves back above it, a buy signal is generated.
When the SMI crosses above +50 and then moves back below it, a sell signal is generated.
Traditionally, traders also look for divergences between the CMO and price action.
Chande Momentum oscillating in a narrower band around the zero line, with no penetration of the Overbought and Oversold levels indicates a ranging market.
This should not be confused with Chande Momentum oscillating between either the Overbought and the zero line, or the Oversold level and the zero line, which indicates a strong up, or down-trend.
It is traditionally considered that the strongest trend signals are from failed swing patterns.
It measures momentum on both up and down days and does not smooth results, triggering more frequent oversold and overbought penetrations.
The CMO is often used to determine overall market trendiness in conjunction with the SMI where the SMI is used to determine the direction of the trend, and also with volume indicators to show if the momentum carries significant selling or buying pressure.

CT Reverse Stochastic Momentum IndexIntroducing the Caretakers Reverse Stochastic Momentum Index .
According to Investopedia :
“The Stochastic Momentum Index (SMI) is a more refined version of the stochastic oscillator, employing a wider range of values and having a higher sensitivity to closing prices.”
The SMI was developed by William Blau and introduced in 1993 in an attempt to provide a more reliable indicator, less subject to false swings.
It calculates the distance of the current closing price as it relates to the median of the high/low range of price.
The SMI has a normal range of values between +100 and -100.
When the present closing price is higher than the median, or midpoint value of the high/low range, the resulting value is positive.
When the current closing price is lower than that of the midpoint of the high/low range, the SMI has a negative value.
I have reverse engineered the SMI formula to derive 2 functions.
One function calculates the chart price at which the SMI will reach a particular SMI scale value.
The second function calculates the chart price at which the SMI will crossover its signal line.
I have employed those functions here to give the price level where the SMI will equal :
Upper alert level ( default 40 )
Zero-Line
Lower alert level ( default -40 )
Signal line
The user can infer from these values that when closing prices cross the levels shown, the SMI will cross the indicated level or signal line.
If the price value is less than zero the value will show "impossible".
The advantage of knowing the exact prices that this will happen should give the user an additional edge and precision in risk management.
These crossover levels are displayed via an optional infobox with choice of user selected info.
There is an option to change the decimal places shown.
For easy and intuitive reading of the indicator when ….
SMI is above the signal line both the SMI and Signal line and the space between them is Green.
SMI is below the signal line both the SMI and Signal line and the space between them is Red.
SMI is above the Zeroline the space between them is Green.
SMI is below the Zeroline the space between them is Red.
Traditionally traders and analysts will consider:
Positives values above 40 indicate a bullish trend
Negative values below -40 indicate a bearish trend .
Common traditional ways to derive signals from the SMI :
When the SMI crosses above the zeroline, a buy signal is generated.
When the SMI crosses below the zeroline, a sell signal is generated.
When the SMI crosses below -40 and then moves back above it, a buy signal is generated.
When the SMI crosses above +40 and then moves back below it, a sell signal is generated.
When the SMI line crosses above the signal line. A signal to buy / take profit is generated
When the SMI line crosses below the signal line. A signal to sell / take profit is generated.
Traders also look for divergences between the SMI itself or the SMI histogram and price action.
The SMI is often used in conjunction with the Chande Momentum Oscillator or R squared indicator to determine overall market trendiness where the SMI is used to determine the direction of the trend, and also with volume indicators to show if the momentum carries significant selling or buying pressure.

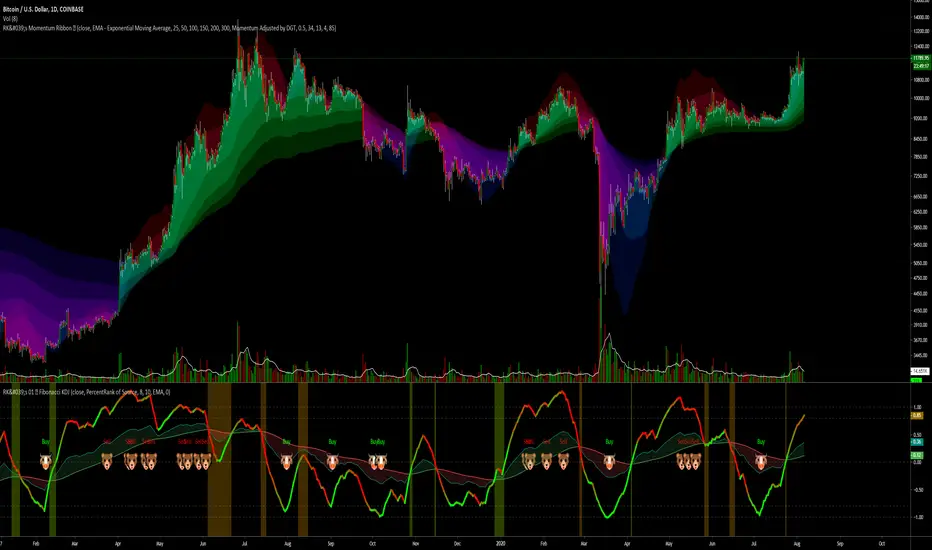
RK's 07 ∴ Moving Average Ribbon with Momentum Adjusted by DGTHello folks!
In my search for new ways to get faster and better market responses, I found this brilliant Indicator here on Trading View.
I rewrite all the code with my own functions and styles.
So... This is my adaptation to excellent script "Momentum adjusted Moving Average by DGT" from the user dgtrd
In dgtrd's words: "A brand new Moving Average, calculated using Momentum, Acceleration and Probability (Psychological Effect).
Momentum adjusted Moving Average( MaMA ) is an indicator that measures Price Action by taking into consideration not only Price movements but also its Momentum, Acceleration and Probability.
MaMA , provides faster responses comparing to the regular Moving Average"
The original post is here: 👇
T∴F∴A∴
Rodrigo Kazuma
8020 Momentum and Pin CandleWe know the 80-20 Rule works very well in real life. It works well in technical analysis and price action as well.
This script identifies strong or momentum candles applying the rule body should be 80% or more of the range This is 80% body and 20% shadow.
Then there are pin candles where there is a 80% shadow and open and close is in one extreme and body is 20% or less.
If we can trade these 8020 candles effectively our trading will improve dramatically.
Use Momentum Candles for entry, stop loss, watching follow through etc
Use Pin Candles to look for reversals.
Works best in direction of trend.
In bullish market, green momentum candles are more powerful and pin candles after retracement is more powerful and vice versa.

Study for Squeeze Momentum Indicator [LazyBear]This study is based on LazyBear Squeeze Momentum Indicator and my strategy developed using it.
I added some custom feature and filters.
Main improvements are:
1- study is updated to version 4 of pine script;
2- I added alerts for entry rules and exit rules.
3- Alert syntax can be customized for webhooks: I added one example only for long entry.
You can customize a lot of features to get a profitable strategy.
Here is a link to original study.
Please use comment section for any feedback.

Aroon Histogram + CMO [ChuckBanger]This is a combination of Aroon and Chande Momentum Oscillator . I made a histogram of Aroon , aqua line is Chande Momentum and the orange line are a simple moving average of Chande Momentum as a signal line.
One strategy you can use this for is to buy or sell when the signal line crosses the CM line or you can buy and sell when CM line is highest or lowest
You should also study how the indicators work separately:
Aroon Oscillator
www.investopedia.com
Chande Momentum Oscillator
www.investopedia.com
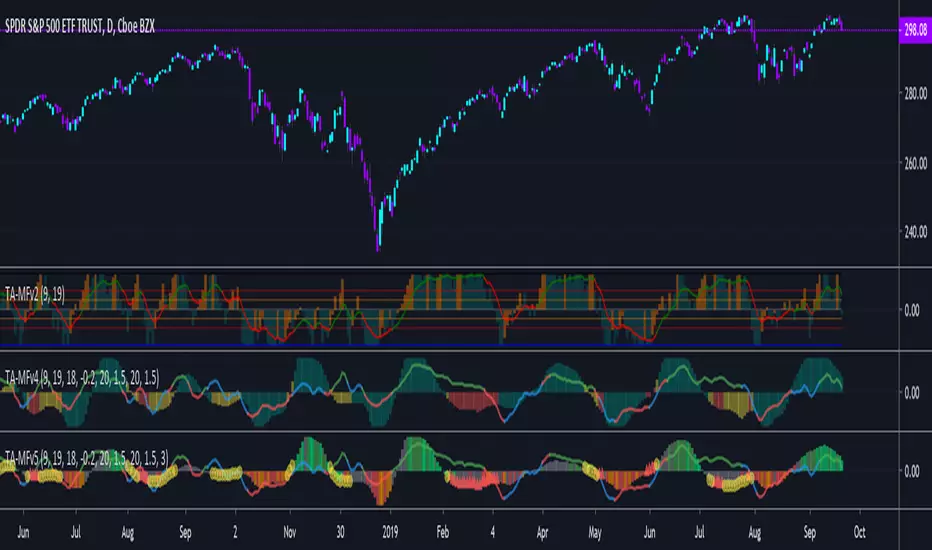
TA-Money Flow-Version5This is the MACD of a stochastic OBV movement indicator, Squeeze Momentum Indicator, and addition coloring for Market Direction Indicator . It is good (right) to work with both price and volume.
In this version we've moved the divergence highlighting to symbols at the ends of the histograms. Same coloring scheme as previous, yellow is divergence of either OBV or SQZ , red is both divergence. In the previous version we added in the "squeeze on - blue" highlighting to show follow through of divergence (or just squeeze/stall). We also added in another old script, but colors so well, Lazybears (Market Direction Indicator, linked below). Also incorporated a 3 color or 5 color scheme from the MDI script as a bool. It works great on any time frame, but you need to have volume data. Not sure where I originally got this (stoch-OBV, somewhere off Tradingview several years ago, thanks to the person who shared), Squeeze/MDI is Lazybear, links below.
Enjoy.
Version 5:
Moved divergence highlighting to symbols on histogram
Added coloring based on MDI
TA-Money-Flow-Version4
TA-Money-Flow-Version3
TA-Money-Flow-Version2
Squeeze-Momentum-Indicator-LazyBear
Market-Direction-Indicator-LazyBear
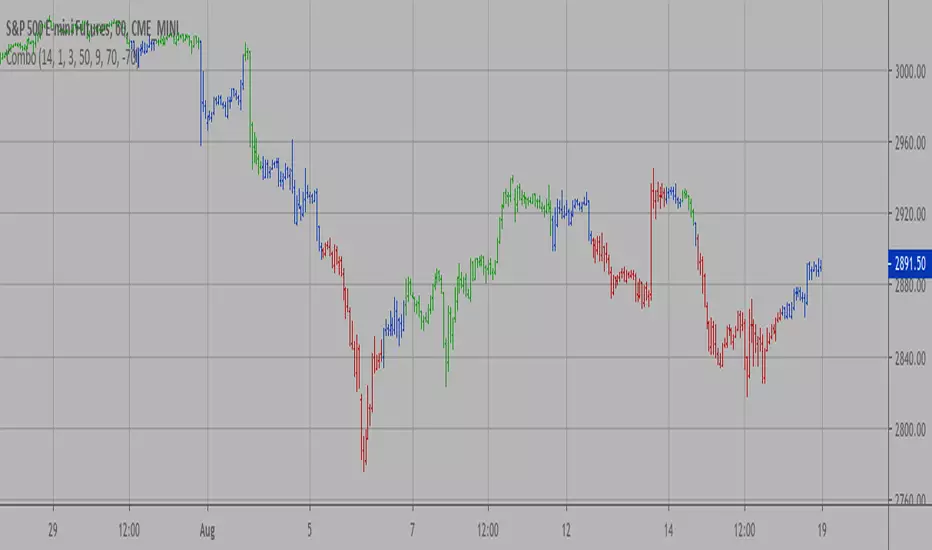
Combo Strategy 123 Reversal & Chande Momentum OscillatorThis is combo strategies for get a cumulative signal.
First strategy
This System was created from the Book "How I Tripled My Money In The
Futures Market" by Ulf Jensen, Page 183. This is reverse type of strategies.
The strategy buys at market, if close price is higher than the previous close
during 2 days and the meaning of 9-days Stochastic Slow Oscillator is lower than 50.
The strategy sells at market, if close price is lower than the previous close price
during 2 days and the meaning of 9-days Stochastic Fast Oscillator is higher than 50.
Second strategy
This indicator plots Chande Momentum Oscillator. This indicator was
developed by Tushar Chande. A scientist, an inventor, and a respected
trading system developer, Mr. Chande developed the CMO to capture what
he calls "pure momentum". For more definitive information on the CMO and
other indicators we recommend the book The New Technical Trader by Tushar
Chande and Stanley Kroll.
The CMO is closely related to, yet unique from, other momentum oriented
indicators such as Relative Strength Index, Stochastic, Rate-of-Change,
etc. It is most closely related to Welles Wilder`s RSI, yet it differs
in several ways:
- It uses data for both up days and down days in the numerator, thereby
directly measuring momentum;
- The calculations are applied on unsmoothed data. Therefore, short-term
extreme movements in price are not hidden. Once calculated, smoothing
can be applied to the CMO, if desired;
- The scale is bounded between +100 and -100, thereby allowing you to
clearly see changes in net momentum using the 0 level. The bounded scale
also allows you to conveniently compare values across different securities.
WARNING:
- For purpose educate only
- This script to change bars colors.
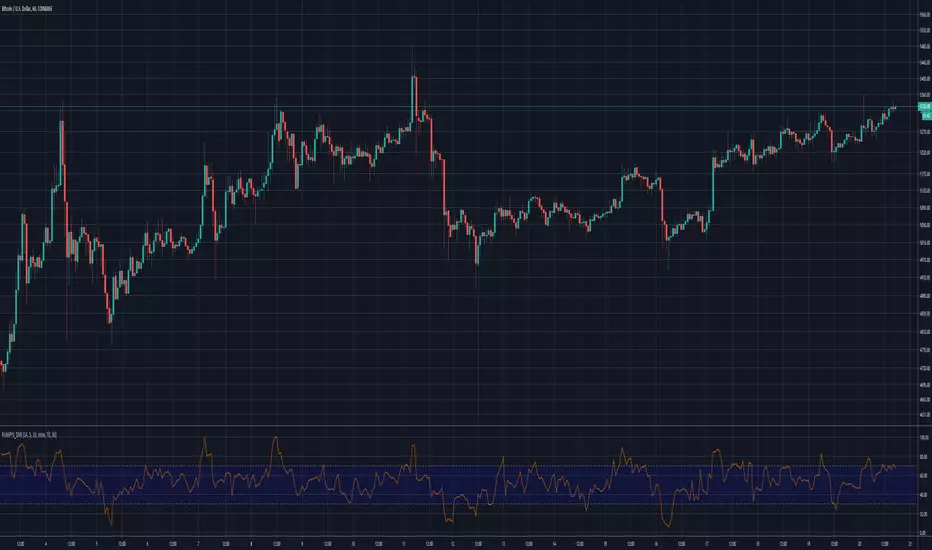
Rumpy's Dynamic Momentum IndexNote : I haven't been able to determine from the info I've found whether the variable length is used for the average gain/loss part of the calculation and/or for the relative strength portion of the calculation . If anyone knows for certain please let me know.
Type A only uses the variable length for the final relative strength calculation and the fixed RSI length for the average gain/loss.
Type B uses the variable length for both.
I do suspect that Type B is correct though as it is a lot more sensitive to momentum changes while Type A tends to just exaggerate normal RSI
-------------------------------------------------------------------------------------------------------------------------------------------
This indicator, developed by Tushar Chande and Stanley Kroll, is similar to the relative strength index (RSI). The main difference between the two is that the RSI uses a fixed number of time periods (usually 14) in its calculation, while the dynamic momentum index uses different time periods as volatility changes, typically between five and 30.
The dynamic momentum index uses fewer periods in its calculation when volatility is high, and more periods when volatility is low.
The number of time periods used in the dynamic momentum index decreases as volatility in the underlying security increases, making this indicator more responsive to changing prices than the RSI. This is particularly useful when an asset's price moves quickly as it approaches key support or resistance levels. Because the indicator is more sensitive, traders can potentially find earlier entry and exit points than with the RSI.
-------------------------------------------------------------------------------------------------------------------------------------------
If you find it useful please consider a tip/donation :
BTC - 3BMEXEDyWJ58eXUEALYPadbn1wwWKmf6sA
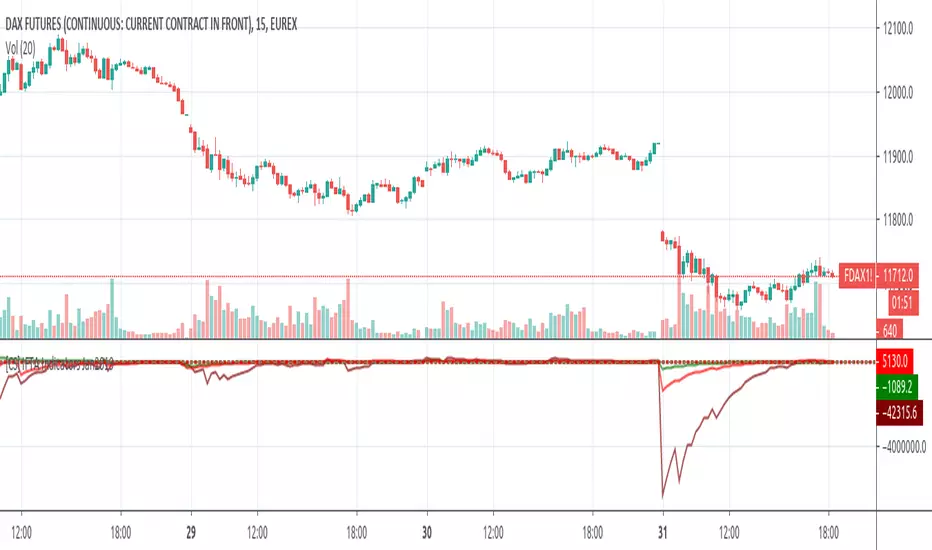
Linear Momentum and Performance IndicatorsThis a porting to Trading View of the 12 new indicators introduced in IFTA Journal (January Edition) by Akram El Sherbini, MFTA, CFTe, CETA.
Indicators are available in "Linear Momentum and Performance Indicators" at page four.
IFTA Journal is available below:
ifta.org
Indicators implemented herein:
Linear Force Index: The linear force index LFI measures the force of buyers and sellers during rallies and declines, respectively. It combines two important pieces of market information—the price acceleration
and volumes.
Pressure Index: The pressure index PRI measures the buying and selling pressure over a certain range within a time interval by moving around its zero line. The index indicates a rise in buying pressure when it crosses above the zero line and a rise in selling pressure
when it crosses below the zero line level. The buying and selling force moves the last price during the session to form a range with low and high boundaries.
Strength Index Index: The strength index SI is a leading indicator to the pressure index. It measures the ability of buyers to resist sellers and vice versa. SI of today is the ratio of the latest pressure index value to the strain of today.
Power Index: It measures the buying and selling power within a time interval by moving around its zero line.
Intensity Index: The intensity index II measures the buying and selling intensity within a time interval by moving around its zero line.
Dynamic Strength Index: The sole purpose of the dynamic strength index DSI and the integral dynamic strength index IDSI is to lead their intensity indicator peers.
Integral Force Index
Integral Pressure Index
Integral Strength Index
Integral Power Index
Integral Intensity Index
Integral Dynamic Strength Index
The following example shows a trade following the signal while several indicators are crossing the zero line:
Integral performance indicators have a fewer number of trades than the performance indicators. This result is normal, as the integral indicators are less sensitive than their peers. Moreover, the power, intensity, and dynamic strength are less sensitive than the force, pressure, and strength indicators. The same applies for their integrals. Therefore, the integrals of power, intensity, and dynamic strength indicators are more inclined to be medium-term indicators.
As the paper is suggesting "the linear momentum and the new performance indicators should make a significant change in categorizing several indicators in technical analysis."
Technical indicators are using biased mathematical implementations. For example Momentum Index is in reality a velocity indicator, Force index a Momentum indicator and so on. From a Physical perspective correct momentum, force, velocity etc. needs to be corrected and re-categorized.
The author also gives important insights in how these indicators can be used "simultaneously to identify price turning points and filter irrelevant divergences."
"This paper will attempt to adjust the price momentum and force concepts introduced by Welles Wilder and Alexander Elder, respectively. By introducing the concept of linear momentum, new indicators will emerge to dissect the market performance into six main elements: market’s force, pressure, strength, power, intensity, and dynamic strength. This will lead to a deeper insight about market action. The leading performance indicators can be used simultaneously to identify price turning points and filter irrelevant divergences. The linear momentum and the new performance indicators should make a significant change in categorizing several indicators in technical analysis."
Suggestions and feedbacks are welcome
Hope you enjoy this,
CryptoStatistical

Linear Momentum and Performance Indicators (IFTA Jan 2019)This a porting to Trading View of the 12 new indicators introduced in IFTA Journal (January Edition) by Akram El Sherbini, MFTA, CFTe, CETA.
Indicators are available in "Linear Momentum and Performance Indicators" at page four.
IFTA Journal is available below:
ifta.org
Indicators implemented herein:
Linear Force Index: The linear force index LFI measures the force of buyers and sellers during rallies and declines, respectively. It combines two important pieces of market information—the price acceleration
and volumes.
Pressure Index: The pressure index PRI measures the buying and selling pressure over a certain range within a time interval by moving around its zero line. The index indicates a rise in buying pressure when it crosses above the zero line and a rise in selling pressure
when it crosses below the zero line level. The buying and selling force moves the last price during the session to form a range with low and high boundaries.
Strength Index Index : The strength index SI is a leading indicator to the pressure index. It measures the ability of buyers to resist sellers and vice versa. SI of today is the ratio of the latest pressure index value to the strain of today.
Power Index : It measures the buying and selling power within a time interval by moving around its zero line.
Intensity Index : The intensity index II measures the buying and selling intensity within a time interval by moving around its zero line.
Dynamic Strength Index : The sole purpose of the dynamic strength index DSI and the integral dynamic strength index IDSI is to lead their intensity indicator peers.
Integral Force Index
Integral Pressure Index
Integral Strength Index
Integral Power Index
Integral Intensity Index
Integral Dynamic Strength Index
The following example shows a trade following the signal while several indicators are crossing the zero line:
Integral performance indicators have a fewer number of trades than the performance indicators. This result is normal, as the integral indicators are less sensitive than their peers. Moreover, the power, intensity, and dynamic strength are less sensitive than the force, pressure, and strength indicators. The same applies for their integrals. Therefore, the integrals of power, intensity, and dynamic strength indicators are more inclined to be medium-term indicators.
As the paper is suggesting "the linear momentum and the new performance indicators should make a significant change in categorizing several indicators in technical analysis."
Technical indicators are using biased mathematical implementations. For example Momentum Index is in reality a velocity indicator, Force index a Momentum indicator and so on. From a Physical perspective correct momentum, force, velocity etc. needs to be corrected and re-categorized.
The author also gives important insights in how these indicators can be used "simultaneously to identify price turning points and filter irrelevant divergences."
"This paper will attempt to adjust the price momentum and force concepts introduced by Welles Wilder and Alexander Elder, respectively. By introducing the concept of linear momentum, new indicators will emerge to dissect the market performance into six main elements: market’s force, pressure, strength, power, intensity, and dynamic strength. This will lead to a deeper insight about market action. The leading performance indicators can be used simultaneously to identify price turning points and filter irrelevant divergences. The linear momentum and the new performance indicators should make a significant change in categorizing several indicators in technical analysis."
Suggestions and feedback are welcome
Hope you enjoy this,
CryptoStatistical
Newton Force and MomentumThis indicator is meant to show the Force of price, based on Newton's Second Law of Motion; and the momentum of price. Force is the value on the left, and momentum on the right.
Originally this was supposed to only be an indicator looking at Force, but because the already popular indicator called "Momentum" does not calculate the momentum of price, but rather the change of price depending on how far back you want to look; I decided to add the Momentum aspect to the indicator.
*BTW if you find this script useful thank and follow @overttherainbow, because they are the one who gave me the idea for this script.*

Stochastic Momentum Index (Stoch MTM, SMI)Stochastic Momentum Index (Stoch MTM, SMI)
The Stochastic Momentum Index (Stoch MTM, SMI) is based on the Stochastic Oscillator. The difference is that the Stochastic Oscillator calculates where the close is relative to the high/low range, while the SMI calculates where the close is relative to the midpoint of the high/low range. The values of the SMI range from +100 to -100. When the close is greater than the midpoint, the SMI is above zero, when the close is less than than the midpoint, the SMI is below zero.
The SMI is interpreted the same way as the Stochastic Oscillator. Extreme high/low SMI values indicate overbought/oversold conditions. A buy signal is generated when the SMI rises above -50, or when it crosses above the signal line. A sell signal is generated when the SMI falls below +50, or when it crosses below the signal line. Also look for divergence with the price to signal the end of a trend or indicate a false trend.
The Stochastic Momentum Index was developed by William Blau and was introduced in his article in the January, 1993 issue of Technical Analysis of Stocks & Commodities magazine.

Stochastic MomentumStochastic Momentum adds shorter and longer term Stochastic movements on the same chart to indicate relative momentum for short and slightly longer term outlooks.
Can be used like a regular Stochastic indicator for overbought / oversold levels, divergence and additionally also the crossing of the shorter (blue) and longer (orange) levels.
It is a leading indicator and often signals early moves of momentum, which may or may not translate into the same price movements.

Seasonal Momentum Indicator This is basically a 5-period seasonal average with an applied momentum (10 ) applied. This is plotted and compared to the current momentum (10). The current momentum is in red while the seasonal momentum is in blue.
You can see that whenever the seasonal momentum and the current momentum are in the same direction, the probability of the trend continuing is higher. Also whenever there is a divergence in the two; the red line (current momentum) will often catch up to the blue (seasonal momentum).
Another use of this indicator is as a divergence detector. If you turn off the red line, you will have only the blue line plotted on the graph. Take this and apply lines to see if the momentum diverges from the price (see example).
I hope you enjoy this one. It only works for securities which have a five year record. You can use it on different time frames but the annual is probably the best and most useful.
Happy Trading
--SpreadEagle71

Relative Momentum Index Strategy The Relative Momentum Index (RMI) was developed by Roger Altman. Impressed
with the Relative Strength Index's sensitivity to the number of look-back
periods, yet frustrated with it's inconsistent oscillation between defined
overbought and oversold levels, Mr. Altman added a momentum component to the RSI.
As mentioned, the RMI is a variation of the RSI indicator. Instead of counting
up and down days from close to close as the RSI does, the RMI counts up and down
days from the close relative to the close x-days ago where x is not necessarily
1 as required by the RSI). So as the name of the indicator reflects, "momentum" is
substituted for "strength".
WARNING:
- This script to change bars colors.

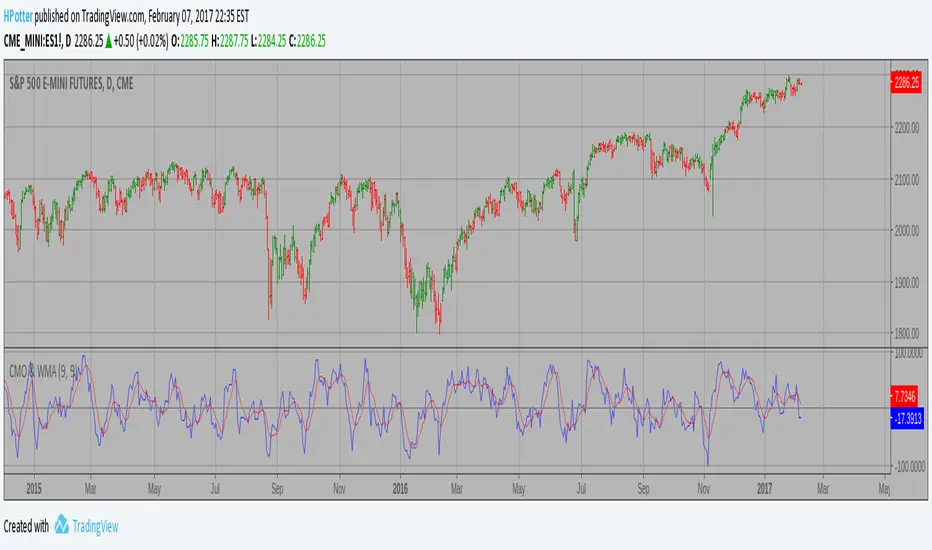
CMO & WMA Strategy This indicator plots Chande Momentum Oscillator and its WMA on the
same chart. This indicator plots the absolute value of CMO.
The CMO is closely related to, yet unique from, other momentum oriented
indicators such as Relative Strength Index, Stochastic, Rate-of-Change,
etc. It is most closely related to Welles Wilder?s RSI, yet it differs
in several ways:
- It uses data for both up days and down days in the numerator, thereby
directly measuring momentum;
- The calculations are applied on unsmoothed data. Therefore, short-term
extreme movements in price are not hidden. Once calculated, smoothing
can be applied to the CMO, if desired;
- The scale is bounded between +100 and -100, thereby allowing you to clearly
see changes in net momentum using the 0 level. The bounded scale also allows
you to conveniently compare values across different securities.
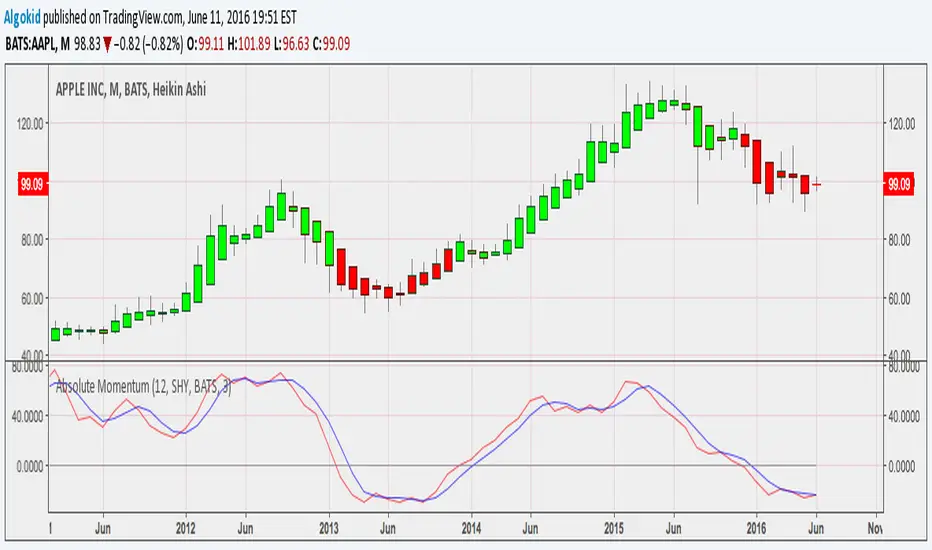
Absolute Momentum Indicator Covered intensevely by Gary Antonnacci in his paper " Absolute Momentum : A simple Rule Based Strategy and Universal Trend Following Overlay , Absolute momentum buys asset with excess return, which is calculated by taking the return of the asset for a giving period of time LESS the Treasury bill rate . The following indicator is based on the rules found in the paper. However you have the liberty to choose your time frame and symbol to calculate the excess return .
Read more about this indicator here
Cheers
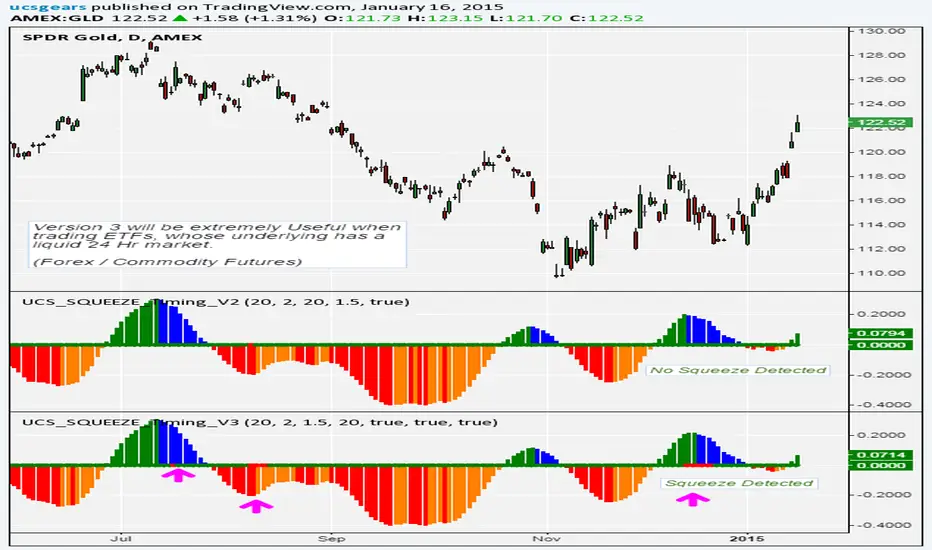
UCS_Squeeze_Timing-V3Another Version with More Features . I am confident enough this works fine now. I am Sure this will be a valuable tool for you guys who love squeezes.
///////////////// This can be further optimized, Let me know with a comment, if you still need this to be optimized. ////////////////////
This update includes
- Added Options to detect squeeze using Heikin Ashi Candle
- Added Options to use BBR or Momentum (ROC) for the Momentum Histogram
- Custom Momentum Smoothing time period
- Removed the Separate Look back periods for BB/KC - Since it doesn't really make sense using different lengths for KC and BB.
HA Closes can be really helpful in trading ETFs like FXE, GLD, FXY, SLV etc, which constantly gaps on daily basis. This helps in smoothing out. And most Importantly it Lines up with the Underlying's Squeeze.
[The Next Major Version is currently being Back tested with better timing triggers etc...... That will replace all other Squeeze indicators in the market - Some Major upgrades have been done to the squeezes to read the consolidation is with support or resistance. Also plan on adding best bet entries and pre-breakout signals. So far so good, this recent contradicting trends in daily / weekly in the market is making the indicator hard to work per theory]
The delay is because, I do not like to post any script (with signals) without sufficient back testing . I will not post these indicator with signals, unless I am sure it works per my theoretical derivations.
-
Thanks for Being Patient and all your support.
Until then - Good Luck Trading.
Squeeze Momentum Indicator [LazyBear]
Fixed a typo in the code where BB multiplier was stuck at 1.5. Thanks @ucsgears for bringing it to my notice.
Updated source: pastebin.com
Use the updated source instead of the what TV shows below.
This is a derivative of John Carter's "TTM Squeeze" volatility indicator, as discussed in his book "Mastering the Trade" (chapter 11).
Black crosses on the midline show that the market just entered a squeeze (Bollinger Bands are with in Keltner Channel). This signifies low volatility, market preparing itself for an explosive move (up or down). Gray crosses signify "Squeeze release".
Mr.Carter suggests waiting till the first gray after a black cross, and taking a position in the direction of the momentum (for ex., if momentum value is above zero, go long). Exit the position when the momentum changes (increase or decrease --- signified by a color change). My (limited) experience with this shows, an additional indicator like ADX / WaveTrend, is needed to not miss good entry points. Also, Mr.Carter uses simple momentum indicator, while I have used a different method (linreg based) to plot the histogram.
More info:
- Book: Mastering The Trade by John F Carter
List of all my indicators:

CMO (Chande Momentum Oscillator)Hi
Let me introduce my CMO (Chande Momentum Oscillator) script.
This indicator plots Chandre Momentum Oscillator. This indicator was
developed by Tushar Chande. A scientist, an inventor, and a respected
trading system developer, Mr. Chande developed the CMO to capture what
he calls "pure momentum". For more definitive information on the CMO and
other indicators we recommend the book The New Technical Trader by Tushar
Chande and Stanley Kroll.
The CMO is closely related to, yet unique from, other momentum oriented
indicators such as Relative Strength Index, Stochastic, Rate-of-Change,
etc. It is most closely related to Welles Wilder`s RSI, yet it differs
in several ways:
- It uses data for both up days and down days in the numerator, thereby
directly measuring momentum;
- The calculations are applied on unsmoothed data. Therefore, short-term
extreme movements in price are not hidden. Once calculated, smoothing
can be applied to the CMO, if desired;
- The scale is bounded between +100 and -100, thereby allowing you to
clearly see changes in net momentum using the 0 level. The bounded scale
also allows you to conveniently compare values across different securities.
