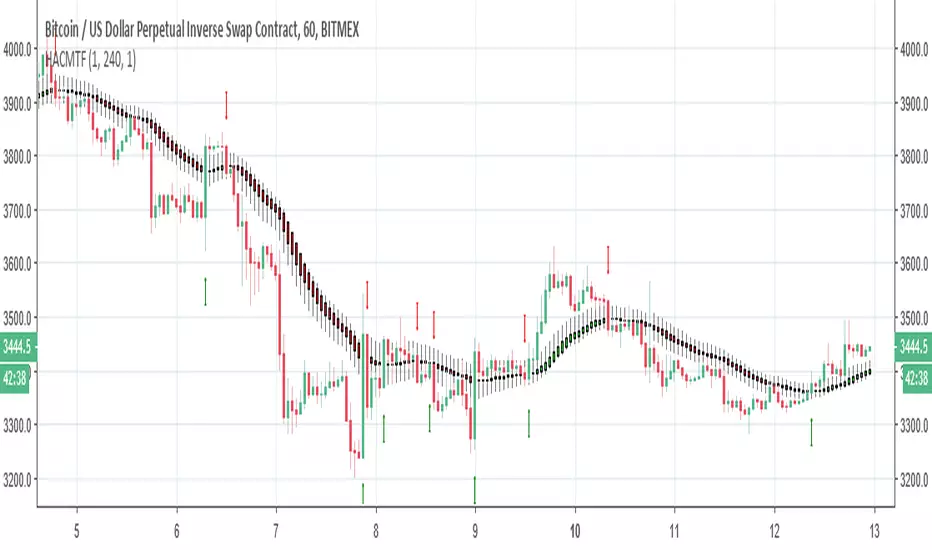
Heiken Ashi Candles MTFThis script allow you to get the HA candles in different MTF settings (MTF calculated as length not as time) . since we do not use security fuction we do not have repaint issue
Use the int2 to change the time frame
ابحث في النصوص البرمجية عن "mtf"
Up/Down Range Momentum MTFSo using the script of
and adding non repainting MTF function to it we create this momentum model
You can enter either at cross of blue line or at cross of 0 and vice versa at red line.
since it has MTF function you can look it on different time frames just set int 2 to the TF of your desire

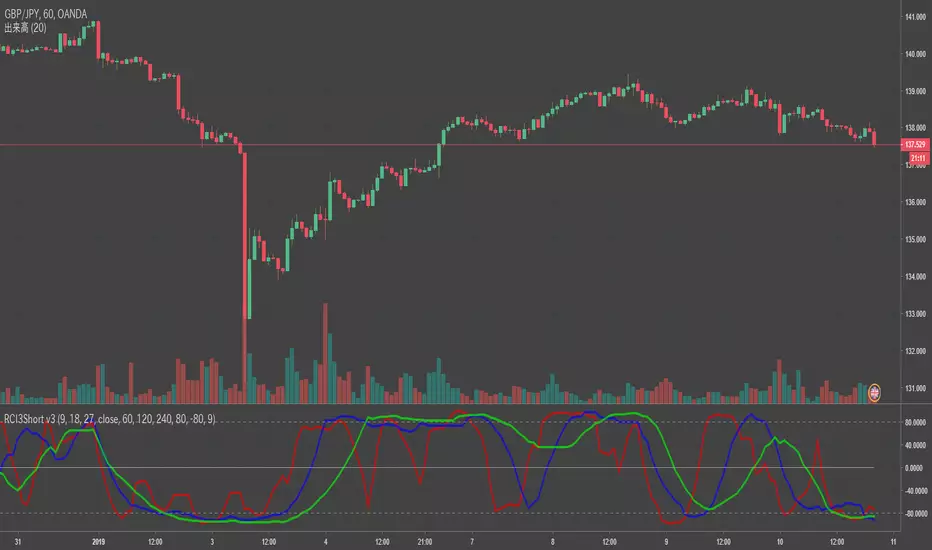
RCI3Short MTFFor RCI lover.
We are facing a timeout problem on smart phone apps of TV.
It looks like a staircase, but It frees us from timeout problems.
default MTF: 60 / 120 / 240
MTF line as middle/long lines
MA Study: Different Types and More [NeoButane]A study of moving averages that utilizes different tricks I've learned to optimize them. Included is Bollinger Bands, Guppy (GMMA) and Super Guppy.
The method used to make it MtF should be more precise and smoother than regular MtF methods that use the security function. For intraday timeframes, each number represents each hour, with 24 equal to 1 day. For daily, 3 is 3 day, for weekly, 4 is the 4 weekly, etc. If you're on a higher timeframe than the one selected, the length will not change.
Log-space is used to make calculations work on many cryptos. The rules for color changing Guppy is changed to make it not as choppy on MAs other than EMA. Note that length does not affect SWMA and VWAP and source does not affect VWAP.
A short summary of each moving average can be found here: medium.com
List of included MAs:
ALMA: Arnaud Legoux
Double EMA
EMA: Exponential
Hull MA
KAMA: Kaufman Adaptive
Linear Regression Curve
LSMA: Least Squares
SMA: Simple
SMMA/RMA: Smoothed/Running
SWMA: Symm. Weighted
TMA: Triangular
Triple EMA
VWMA: Volume Weighted
WMA: Weighted
ZLEMA: Zero Lag
VWAP: Vol Weighted Average
Welles Wilder MA

BottomFinder MTF Madness - 5x MTF Grid IndicatorsHello Again Trading View!
Bottom Finder Team here bringing another delicious indicator, this time to help spot those trends! This version is closed for Beta Testing with our subscribers only for the next few weeks. After beta improvements it will be released free to anyone who signs up as a free member on our site.
This is meant to be used on the 15m timeframe, and it looks up into higher TF's. It is meant to be maximized, so have this open in one tab and the chart on another. Dual Monitors are best. All options and Time frames are fully configurable inputs.
Indicators from top to bottom are:
1.)Polarity Filtration - 6 Timeframes
2.)Price Volume Trend - 4 Timeframes
3.)Stochastic RSI - 4 Timeframe Grid, and Current Timeframe in lines/ribbons
4.)MACD Crossovers - 8 Timeframes
5.)SuperTrend - 4 Timeframes
And last...
6.)Background Color indicator is up/down (green/red) price on 1 Hour Heiken Ashi candle chart.
No more swapping back and forth between timeframes!
For access to this and many other exclusive indicators - you can visit our telegram and ask about becoming a subscriber. All our paid indicators have a reasonable lifetime cap price. Once you reach it, indicator is yours for life - no more subscription.
ADX-DI MTF trend indication - JD version 2Version 2 added support for MTF, to see the trend direction on the lower or higher timeframe.
As an example to see the difference, the indicator is added three times, one time for the current TF, one set at the higher and one at the lower TF.
Cudo's to Chris Moody for the MTF-switching-code!!
JD.

BrainTrend MTF(Multi Time Frame ) No Repaint version
This is the NO REPAINT version with new algorithm, it also comes with alert.
In the original version, signal on current bar will always change until the Close price is fixed.
With this MTF version BrainTrend, you can apply any time frame of BrainTrend to your current chart.
As long as the selected MTF time frame is greater than the chart time frame.
BrainTrade is ideal for both day trading and position trading. BrainTrade help you to focus on the most essential information on markets. BrainTrade indicators provide market directions, provide trend and stops, provide buy and sell signals. With BrainTrade you now have immediate access to the river of information about the major trend changes, buy and sell signals, and stops for large number of market symbols. BrainTrade is revolutionizing the very nature of trading. People have lived for so long without information at their fingertips that they don’t realize what they’re missing.
Parameters available for you to adjust the BrainTrend Indicator.
timeframe: choos your desired timeframe.
stoch_period
stoch_max
stoch_min
atr_current_norm_factor
atr_before_norm_factor
atr_period
atr_before_step
Since there already are many explaination and details about this indicator, we don't repeat it here.
It works on all time frame and all markets(Stocks, Futures, Forex, Options,ETF, etc.)

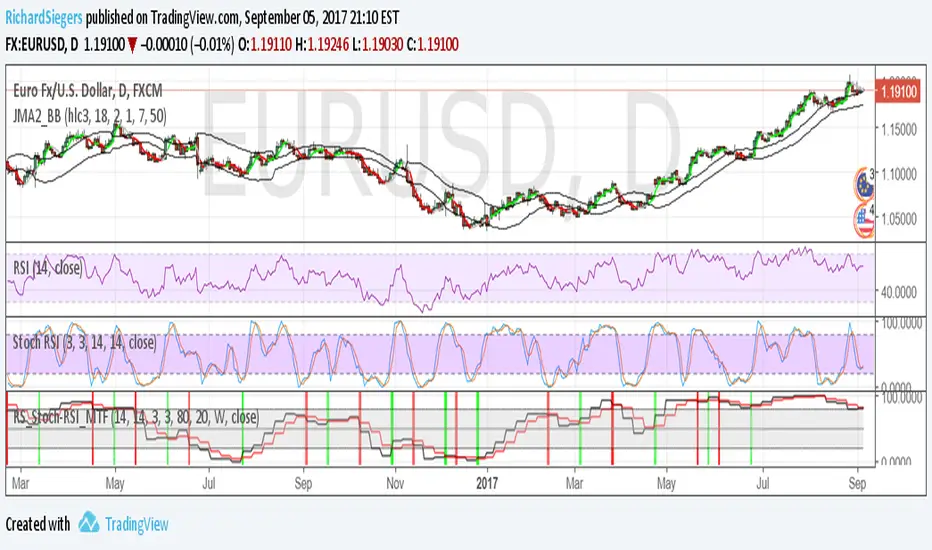
RS_Stoch-RSI_MTFmodification by Richard Siegers that turned stochastic mtf from ChrisMoody into stochastic-rsi mtf
B3 Bar Cycle MTF (fix)Apologies, there was an error in printing for the thick gray boxes, happened when MTF was switched on. All better, and here is the details from before:
This is an interesting study that can be used as a tool for determining trend direction, and also could be a trailing stop setter. I use it as a gauge on MTF settings. If on, you can look at the bar cycle of the 1h while on the 15m giving you a lot of information in one tool. If a line is missing high or low, it is because it was broken, if both exist you are trading in range and cloud appears. If both sides break you get thick gray boxes above and below bar.
Get used to editing the inputs to suit your liking. Often 3-5 length and always looking at different resolutions to get a big picture story. You could put multiple instances of the study up to see them simultaneously. I based the idea off of Krausz's 3 day cycle which you can read about in his teachings. I tend to find it looking better using Heikin Ashi bar-style.

True Strength Indicator MTFHere is an example of a script showing a multi-time frame of TSI.
Chart below compares FX EURUSD Daily TSI to 1H TSI
Here is an updated version
study("True Strength Indicator MTF", shorttitle="TSI MTF")
resCustom = input(title="Timeframe", type=resolution, defval="60" )
long = input(title="Long Length", type=integer, defval=25)
short = input(title="Short Length", type=integer, defval=13)
signal = input(title="Signal Length", type=integer, defval=13)
price = close
double_smooth(src, long, short) =>
fist_smooth = ema(src, long)
ema(fist_smooth, short)
pc = change(price)
double_smoothed_pc = double_smooth(pc, long, short)
double_smoothed_abs_pc = double_smooth(abs(pc), long, short)
tsi_value = 100 * (double_smoothed_pc / double_smoothed_abs_pc)
tsi = security(tickerid, resCustom,tsi_value)
plot(tsi, color=black)
plot(ema(tsi, signal), color=red)
hline(0, title="Zero")

OXE MTF Support/Resistance+Demand/Supply Zone ArsenalOXE MTF Support/Resistance + Demand/Supply Zones Indicator
Your Complete Multi-Timeframe Zone Arsenal
This professional-grade indicator transforms your chart into a zone confluence powerhouse, simultaneously tracking high-probability price reaction areas across 5 timeframes (Daily, H4, H1, M15, M5) – giving you the institutional edge you need to dominate the markets.
🎯 What It Is
A sophisticated dual-system zone detector that identifies both:
Classic Support/Resistance levels using pivot point detection
Smart Money Demand/Supply zones triggered by Break-of-Structure (BOS) confirmations
Unlike basic S/R indicators, this tool employs institutional methodology – capturing order blocks and imbalance zones where smart money is positioned, not just where price bounced.
⚡ Core Capabilities
Multi-Timeframe Mastery
Track up to 5 timeframes simultaneously without switching charts
Identify confluence zones where multiple timeframe levels align
Customize which timeframes to display for clean, focused analysis
Intelligent Zone Management
Automatic zone validation – tracks when zones flip from resistance→support or supply→demand
Invalid zone filtering – hide broken/invalidated zones to focus only on active opportunities
Configurable zone limits – control the number of zones per timeframe (up to 8 each)
Smart Money Detection
BOS-confirmed zones – only marks demand/supply after break-of-structure confirmation
Precise zone timing – captures the exact candle that created the imbalance
Visual differentiation – dashed borders distinguish demand/supply from traditional S/R
Professional Dashboard
Real-time zone counter – shows active zones per timeframe at a glance
Filter status indicators – tracks which validation filters are enabled
Color-coded timeframe labels – instant visual organization
💰 How This Transforms Your Trading
1. Find High-Probability Entries
Enter trades at zones where multiple timeframes converge – when H4 demand aligns with Daily support, you've found institutional backing.
2. Stay on the Right Side of the Market
The zone flipping system shows you when market structure changes – a supply zone that flips to demand tells you the narrative has shifted bullish.
3. Eliminate Guesswork
No more wondering "is this level still valid?" The automatic invalidation tracking removes subjectivity – zones are either active (tradeable) or broken (ignored).
4. Scale Your Timeframe Analysis
Whether you're scalping M5 or swing trading Daily, access all relevant zones without the mental overhead of switching between charts and manually tracking levels.
5. Trade Like Institutions
By combining pivot-based S/R with BOS-confirmed order blocks, you're seeing where retail AND institutional money is positioned – giving you the complete picture.
🔥 Perfect For
Day traders seeking M15/H1 confluence for precise entries
Scalpers needing M5 zones with higher-timeframe confirmation
Swing traders looking for Daily/H4 zone alignment for position trades
ICT/SMC practitioners combining order blocks with traditional analysis
Any trader who values clean, validated, multi-timeframe zones over cluttered charts

ATR/ADR MTF Projection ArrayATR/ADR MTF Projection Array
Overview
A powerful predictive tool that projects ATR (Average True Range) and ADR (Average Daily Range) levels as clean support and resistance arrays on your chart. Designed for traders who want to anticipate the high and low of the day using volatility-based projections with multi-timeframe confluence.
This indicator combines traditional ATR analysis with ICT-style ADR methodology, giving you institutional-grade level projections from a single, customizable tool.
Key Features
🎯 Dual Volatility Metrics
ATR Projections — Classic volatility-based levels with full multi-timeframe support
ADR Projections (ICT Style) — Average Daily Range levels using Inner Circle Trader methodology
Enable/disable each independently based on your trading preference
📊 Multi-Timeframe ATR Analysis
Plot ATR levels from up to 3 timeframes simultaneously (Daily, Weekly, Monthly or custom)
Each timeframe displays with distinct styling for easy identification
Perfect for confluence trading across multiple time horizons
⚡ ICT ADR Methodology
NY Midnight calculation mode (ICT standard) or Classic Daily
Key ICT levels built-in:
1/3 ADR (Judas Swing) — Critical manipulation level where fake moves often terminate
1/2 ADR — Mid-range reference
2/3 ADR — Trending day continuation target
100% ADR — Full daily range completion
150% ADR — Extension target for expansion days
Two projection modes: Static (from anchor) or Dynamic (from session high/low)
🔧 Flexible Anchor Points
Previous Close (default)
Daily Open
Weekly Open
Monthly Open
Session Open
📈 Range Completion Tracking
Real-time display of how much of the expected daily range has been consumed
Visual status indicator helps identify when the day's move may be exhausted
How To Use
For Bias Confirmation:
Establish your directional bias using your preferred method (trigger day, market structure, etc.)
Monitor the 1/3 ADR level during London/NY open for potential Judas Swing (manipulation move)
Target 2/3 to 100% ADR for your HOD/LOD objective
For Target Setting:
Use ATR levels as volatility-based profit targets
ADR 100% level often marks session extremes
When Range Used reaches 100%+, expect consolidation or reversal
For Multi-Timeframe Confluence:
Enable Weekly/Monthly ATR levels alongside Daily
Look for clustering of levels across timeframes for high-probability zones
Settings Guide
Master Controls — Toggle ATR/ADR systems and bull/bear levels independently
ATR Settings — Configure period, multiplier, anchor point, and select which timeframes to display
ATR Level Multipliers — Choose which projection levels to show (0.5x, 0.75x, 1.0x, 1.25x, 1.5x)
ADR Settings (ICT Style) — Select calculation mode (NY Midnight recommended), period (5 days is ICT standard), and projection mode
ADR Level Selection — Toggle individual ICT levels (1/3, 1/2, 2/3, 100%, 150%)
Visual Settings — Customize colors, line styles, labels, and info table position
Alerts Included
ATR 1.0x Bull/Bear Cross
ADR 1/3 Judas Swing Zone (Bull/Bear)
ADR 100% Range Completion (Bull/Bear)

Symbol Magnifier & MTF Clock# Symbol Magnifier & MTF Clock
Shows your symbol, price, and countdown timers for multiple timeframes on one chart.
## What It Does
**Symbol Display:**
- Big, easy-to-read symbol and price
- Shows time left until current candle closes
- Green for bullish, red for bearish
- Put it anywhere on your chart
**Multi-Timeframe Clock:**
- Track up to 6 timeframes at once: D1, H4, H1, M30, M15, M5
- See exactly when each candle will close
- Turns orange/red in the last 5 minutes as a warning
- Choose which timeframes to show
## Why Use It?
Never miss important candle closes across multiple timeframes. Perfect if you trade using multiple timeframe analysis or need to time your entries better.
## Settings
- Move displays to any corner
- Change text size
- Pick your colors
- Show only the timeframes you care about
That's it. Simple timing tool for multi-timeframe traders.

4H Supply & Demand – 50% Mitigation (MTF clean)4H Supply & Demand – 50% Mitigation (MTF clean)
This indicator shows strictly 4h supply & demand zones
automatically deletes any zone that got filled by 51%

STRAT - MTF Dashboard + FTFC + Reversals v2.7# STRAT Indicator - Complete Description
## Overview
A comprehensive multi-timeframe STRAT trading system indicator that combines market structure analysis, flip levels, Full Timeframe Continuity (FTFC), and reversal pattern detection across 12 timeframes.
## Core Features
### 1. **Multi-Timeframe STRAT Dashboard**
- Displays STRAT combos (1, 2u, 2d, 3) across 12 timeframes: 1m, 5m, 15m, 30m, 1H, 4H, 12H, Daily, Weekly, Monthly, Quarterly, Yearly
- Color-coded directional bias (green/red/doji)
- Inside bars (●) and Outside bars (●) highlighted
- Current timeframe marked with ★
### 2. **HTF Flip Levels with Smart Grouping**
- Displays higher timeframe (HTF) flip levels (open prices) as labels on the right side
- Automatically groups multiple timeframes at the same price level (e.g., "★ 1H/4H/D")
- Current timeframe flip level always displayed with ★ marker
- Color-coded: Green (above price) / Red (below price)
### 3. **Full Timeframe Continuity (FTFC)**
- User-selectable 4 timeframes for FTFC analysis (default: D, W, M, Q)
- Green line: FTFC Up (highest open of 4 timeframes)
- Red line: FTFC Down (lowest open of 4 timeframes)
- Identifies when price is above/below all 4 timeframe opens
### 4. **Hammer & Shooting Star Detection**
- **Hammer Pattern**: Long lower wick (≥2x body), small upper wick, signals potential bottom reversal
- **Shooting Star Pattern**: Long upper wick (≥2x body), small lower wick, signals potential top reversal
- Scans last 100 bars (adjustable) and marks ALL historical patterns
- Chart markers: 🔨 (Hammer) below bars, 🔻 (Shooting Star) above bars
- Dashboard column shows reversal patterns for each timeframe
- Adjustable wick-to-body ratio sensitivity (1.5 to 5.0)
### 5. **Debug Tables**
- **FTFC Debug**: Shows close vs. 4 timeframe opens, confirms all-green/all-red conditions
- **Reversal Debug**: Real-time analysis of current bar - body size, wick measurements, ratios, and pattern qualification
## Settings
### Display Settings
- Dashboard position (9 options: top-left to bottom-right)
- Dashboard text size (tiny to huge)
- Label offset and text size
- Toggle individual features on/off
### FTFC Settings
- Select 4 custom timeframes for continuity analysis
- Default: Daily, Weekly, Monthly, Quarterly
### Reversal Settings
- **Wick to Body Ratio**: Sensitivity for pattern detection (default 2.0)
- **Lookback Bars**: How many historical bars to scan (default 100, max 500)
- Show/hide reversal markers on chart
- Show/hide reversal debug table
## Use Cases
1. **Momentum Trading**: Identify STRAT setups (2-2, 2-1-2 reversals, 3-bar plays) across multiple timeframes
2. **Swing Trading**: Use HTF flip levels as support/resistance and FTFC for trend confirmation
3. **Reversal Trading**: Catch hammer/shooting star patterns at key levels for counter-trend entries
4. **Multi-Timeframe Analysis**: Confirm alignment across timeframes before entering trades
## How to Use
### For STRAT Traders
- Look for 2-1-2 reversal setups in the dashboard
- Watch for inside bars (●) at HTF flip levels for breakout trades
- Use outside bars (●) to identify potential volatility expansion
### For Reversal Traders
- 🔨 Hammers after downtrends = potential long entries
- 🔻 Shooting stars after uptrends = potential short entries
- Combine with HTF flip levels for high-probability setups
### For Trend Followers
- FTFC green line above = bullish structure
- FTFC red line below = bearish structure
- Enter when price breaks and holds above/below FTFC levels
## Visual Elements
- **Green Labels**: HTF flip levels above current price (resistance)
- **Red Labels**: HTF flip levels below current price (support)
- **Lime Line**: FTFC Up (highest timeframe open)
- **Red Line**: FTFC Down (lowest timeframe open)
- **🔨 Icon**: Hammer pattern (potential reversal up)
- **🔻 Icon**: Shooting Star pattern (potential reversal down)
- **★ Symbol**: Current timeframe or multiple timeframes grouped
## Performance Notes
This indicator performs 12 multi-timeframe security calls and may take 15-30 seconds to calculate on initial load. This is normal for comprehensive MTF analysis.
## Version
v2.7 - Simplified reversal detection, current TF labeling, optimized performance
---
**Perfect for**: STRAT traders, multi-timeframe analysts, reversal pattern traders, swing traders looking for high-probability setups with confluence across timeframes.

VB Finviz-style MTF Screener📊 VB Multi-Timeframe Stock Screener (Daily + 4H + 1H)
A structured, high-signal stock screener that blends Daily fundamentals, 4H trend confirmation, and 1H entry timing to surface strong trading opportunities with institutional discipline.
🟦 1. Daily Screener — Core Stock Selection
All fundamental and structural filters run strictly on Daily data for maximum stability and signal quality.
Daily filters include:
📈 Average Volume & Relative Volume
💲 Minimum Price Threshold
📊 Beta vs SPY
🏢 Market Cap (Billions)
🔥 ATR Liquidity Filter
🧱 Float Requirements
📘 Price Above Daily SMA50
🚀 Minimum Gap-Up Condition
This layer acts like a Finviz-style engine, identifying stocks worth trading before momentum or timing is considered.
🟩 2. 4H Trend Confirmation — Momentum Check
Once a stock passes the Daily screen, the 4-hour timeframe validates trend strength:
🔼 Price above 4H MA
📈 MA pointing upward
This removes structurally good stocks that are not in a healthy trend.
🟧 3. 1H Entry Alignment — Timing Layer
The Hourly timeframe refines near-term timing:
🔼 Price above 1H MA
📉 Short-term upward movement detected
This step ensures the stock isn’t just good on paper—it’s moving now.
🧪 MTF Debug Table (Your Transparency Engine)
A live diagnostic table shows:
All Daily values
All 4H checks
All 1H checks
Exact PASS/FAIL per condition
Perfect for tuning thresholds or understanding why a ticker qualifies or fails.
🎯 Who This Screener Is For
Swing traders
Momentum/trend traders
Systematic and rules-based traders
Traders who want clean, multi-timeframe alignment
By combining Daily fundamentals, 4H trend structure, and 1H momentum, this screener filters the market down to the stocks that are strong, aligned, and ready.

CRT MTF + HTF Candles - Milana TradesCRT MTF + HTF Candles is an educational tool that helps you visualize higher-timeframe CRT and HTF candles on your intraday chart
The script automatically tracks key HTF levels and shows three types of CRT events:
1. Pending CRT
When a higher-timeframe candle breaks the previous high or low, the indicator marks this as a “pending” CRT.
This helps you see potential liquidity grabs and where price is currently trapped inside the HTF range
2. Completed CRT
A CRT becomes “completed” when price reaches the opposite side of the previously broken level
3. Invalid CRT
If price closes outside the HTF range before completion, the CRT is marked as invalid.
This helps you identify failed breaks and possible reversals.
Multi-Timeframe HTF Candles
The script draws clean higher-timeframe candles directly on your lower timeframe chart.
Each candle includes:
Body and wicks
HTF open & close
Swing high/low markers
Timeframe labels
Optional timers (showing time remaining in the candle)
Optional imbalances (FVG / volume imbalance)
Optional Midpont line (0.5)
HTF candle spacing
You can adjust candle width, spacing, and alignment so HTF candles fit nicely over lower-TF bars.
Gaps & Imbalances
The tool can highlight:
Fair value gaps
Volume imbalance
Swing Sweep line
When price tried update swing but closed inside the candle cange
Equlibrium line (Midpoint 0.5)
Timeframe tags & timers
Shows clear labels for each HTF candle
You can choose which timeframes to show (1H, 2H, 4H, Daily, etc.) and how many candles should be displayed
Trade smart, stay disciplined, and keep improving every day
Enjoy :)

S/R MTF// This Pine Script™ code is subject to the terms of the Mozilla Public License 2.0 at mozilla.org
// © fluxchart
//@version=6
//S&R; V2.12
const bool DEBUG = false
const bool fixSRs = true
const bool fixRetests = false
indicator("crr S/R MTF", overlay = true, max_labels_count = 500, max_lines_count = 500, max_boxes_count = 500, dynamic_requests = true)
const int maxSRInfoListSize = 10
const int maxBarInfoListSize = 3000
const int maxDistanceToLastBar = 500
const int minSRSize = 5
const int retestLabelCooldown = 3
const float tooCloseATR = 1.0 / 8.0
const int labelOffsetBars = 20
const int atrLen = 20
atr = ta.atr(atrLen)
avgVolume = ta.sma(volume, atrLen)
var int curTFMS = timeframe.in_seconds(timeframe.period) * 1000
var map alerts = map.new()
alerts.put("Retest", false)
alerts.put("Break", false)
srPivotLength = input.int(15, "Pivot Length", minval = 3, maxval = 50, group = "General Configuration", display = display.none)
srStrength = input.int(1, "Strength", , group = "General Configuration", display = display.none)
srInvalidation = input.string("Close", "Invalidation", , group = "General Configuration", display = display.none)
expandZones = input.string("Only Valid", "Expand Lines & Zones", options = , group = "General Configuration", display = display.none)
showInvalidated = input.bool(true, "Show Invalidated", group = "General Configuration", display = display.none)
timeframe1Enabled = input.bool(true, title = "", group = "Timeframes", inline = "timeframe1", display = display.none)
timeframe1 = input.timeframe("", title = "", group = "Timeframes", inline = "timeframe1", display = display.none)
timeframe2Enabled = input.bool(false, title = "", group = "Timeframes", inline = "timeframe2", display = display.none)
timeframe2 = input.timeframe("D", title = "", group = "Timeframes", inline = "timeframe2", display = display.none)
timeframe3Enabled = input.bool(false, title = "", group = "Timeframes", inline = "timeframe3", display = display.none)
timeframe3 = input.timeframe("W", title = "", group = "Timeframes", inline = "timeframe3", display = display.none)
showBreaks = input.bool(true, "Show Breaks", group = "Breaks & Retests", inline = "ShowBR", display = display.none)
showRetests = input.bool(true, "Show Retests", group = "Breaks & Retests", inline = "ShowBR", display = display.none)
avoidFalseBreaks = input.bool(false, "Avoid False Breaks", group = "Breaks & Retests", display = display.none)
breakVolumeThreshold = input.float(0.3, "Break Volume Threshold", minval = 0.1, maxval = 2.0, step = 0.1, group = "Breaks & Retests", tooltip = "Only taken into account if Avoid False Breakouts is enabled.\nHigher values mean it's less likely to be a break.", display = display.none)
inverseBrokenLineColor = input.bool(false, "Inverse Color After Broken", group = "Breaks & Retests", display = display.none)
styleMode = input.string("Lines", "Style", , group = "Style", display = display.none)
lineStyle = input.string("____", "Line Style", , group = "Style", display = display.none)
lineWidth = input.int(2, "Line Width", minval = 1, group = "Style", display = display.none)
zoneSize = input.float(1.0, "Zone Width", minval = 0.1, maxval = 10, step = 0.1, group = "Style", display = display.none)
zoneSizeATR = zoneSize * 0.075
supportColor = input.color(#08998180, "Support Color", group = "Style", inline = "RScolors", display = display.none)
resistanceColor = input.color(#f2364580, "Resistance Color", group = "Style", inline = "RScolors", display = display.none)
breakColor = input.color(color.blue, "Break Color", group = "Style", inline = "RScolors2", display = display.none)
textColor = input.color(#ffffff80, "Text Color", group = "Style", inline = "RScolors2", display = display.none)
enableRetestAlerts = input.bool(true, "Enable Retest Alerts", tooltip = "Needs Show Retests option enabled.", group = "Alerts", display = display.none)
enableBreakAlerts = input.bool(true, "Enable Break Alerts", tooltip = "Needs Show Breaks option enabled.", group = "Alerts", display = display.none)
insideBounds = (bar_index > last_bar_index - maxDistanceToLastBar)
type srInfo
int startTime
float price
string srType
int strength
string timeframeStr
bool ephemeral = false
int breakTime
array retestTimes
type srObj
srInfo info
bool startFixed
bool breakFixed
bool rendered
string combinedTimeframeStr
line srLine
box srBox
label srLabel
label breakLabel
array retestLabels
type barInfo
int t
int tc
float c
float h
float l
var allSRList = array.new()
//#region Find Val RTN Time
findValRtnTime (barInfo biList, valToFind, toSearch, searchMode, minTime, maxTime, int defVal = na) =>
int rtnTime = defVal
float minDiff = na
if biList.size() > 0
for i = biList.size() - 1 to 0
curBI = biList.get(i)
if curBI.t >= minTime and curBI.t < maxTime
toLook = (toSearch == "Low" ? curBI.l : toSearch == "High" ? curBI.h : curBI.c)
if searchMode == "Nearest"
curDiff = math.abs(valToFind - toLook)
if na(minDiff)
rtnTime := curBI.t
minDiff := curDiff
else
if curDiff <= minDiff
minDiff := curDiff
rtnTime := curBI.t
if searchMode == "Higher"
if toLook >= valToFind
rtnTime := curBI.t
break
if searchMode == "Lower"
if toLook <= valToFind
rtnTime := curBI.t
break
rtnTime
//#endregion
formatTimeframeString (string formatTimeframe, bool short = false) =>
timeframeF = (formatTimeframe == "" ? timeframe.period : formatTimeframe)
if str.contains(timeframeF, "D") or str.contains(timeframeF, "W") or str.contains(timeframeF, "S") or str.contains(timeframeF, "M")
timeframe.from_seconds(timeframe.in_seconds(timeframeF))
else
seconds = timeframe.in_seconds(timeframeF)
if seconds >= 3600
hourCount = int(seconds / 3600)
if short
str.tostring(hourCount) + "h"
else
str.tostring(hourCount) + " Hour" + (hourCount > 1 ? "s" : "")
else
if short
timeframeF + "m"
else
timeframeF + " Min"
renderSRObj (srObj sr) =>
if na(sr.info.breakTime) or showInvalidated
sr.rendered := true
endTime = nz(sr.info.breakTime, time + curTFMS * labelOffsetBars)
extendType = extend.none
if na(sr.info.breakTime)
extendType := extend.right
if expandZones == "Only Valid" and na(sr.info.breakTime)
extendType := extend.both
else if expandZones == "All"
extendType := extend.both
endTime := time + curTFMS * labelOffsetBars
labelTitle = formatTimeframeString(sr.info.timeframeStr)
if not na(sr.combinedTimeframeStr)
labelTitle := sr.combinedTimeframeStr
labelTitle += " | " + str.tostring(sr.info.price, format.mintick) + ((sr.info.ephemeral and DEBUG) ? " " : "")
if styleMode == "Lines"
// Line
sr.srLine := line.new(sr.info.startTime, sr.info.price, endTime, sr.info.price, xloc = xloc.bar_time, color = sr.info.srType == "Resistance" ? resistanceColor : supportColor, width = lineWidth, style = lineStyle == "----" ? line.style_dashed : lineStyle == "...." ? line.style_dotted : line.style_solid, extend = extendType)
// Label
sr.srLabel := label.new(extendType == extend.none ? ((sr.info.startTime + endTime) / 2) : endTime, sr.info.price, xloc = xloc.bar_time, text = labelTitle, textcolor = textColor, style = label.style_none)
else
// Zone
sr.srBox := box.new(sr.info.startTime, sr.info.price + atr * zoneSizeATR, endTime, sr.info.price - atr * zoneSizeATR, xloc = xloc.bar_time, bgcolor = sr.info.srType == "Resistance" ? resistanceColor : supportColor, border_color = na, text = labelTitle, text_color = textColor, extend = extendType, text_size = size.normal, text_halign = (extendType != extend.none) ? text.align_right : text.align_center)
// Break Label
if showBreaks
if not na(sr.info.breakTime)
sr.breakLabel := label.new(sr.info.breakTime, sr.info.price, "B", yloc = sr.info.srType == "Resistance" ? yloc.belowbar : yloc.abovebar, style = sr.info.srType == "Resistance" ? label.style_label_up : label.style_label_down, color = breakColor, textcolor = color.new(textColor, 0), xloc = xloc.bar_time, size = size.small)
if (time - curTFMS <= sr.info.breakTime) and (time + curTFMS >= sr.info.breakTime)
alerts.put("Break", true)
// Retest Labels
if showRetests
if sr.info.retestTimes.size() > 0
for i = sr.info.retestTimes.size() - 1 to 0
curRetestTime = sr.info.retestTimes.get(i)
cooldownOK = true
if sr.retestLabels.size() > 0
lastLabel = sr.retestLabels.get(0)
if math.abs(lastLabel.get_x() - curRetestTime) < curTFMS * retestLabelCooldown
cooldownOK := false
if cooldownOK and (curRetestTime >= sr.info.startTime) and (na(sr.info.breakTime) or curRetestTime < sr.info.breakTime)
if time - curTFMS <= curRetestTime and time >= curRetestTime
alerts.put("Retest", true)
sr.retestLabels.unshift(label.new(curRetestTime, sr.info.price, "R" + (DEBUG ? (" " + str.tostring(sr.info.price)) : ""), yloc = sr.info.srType == "Resistance" ? yloc.abovebar : yloc.belowbar, style = sr.info.srType == "Resistance" ? label.style_label_down : label.style_label_up, color = sr.info.srType == "Resistance" ? resistanceColor : supportColor, textcolor = color.new(textColor, 0), xloc = xloc.bar_time, size = size.small))
safeDeleteSRObj (srObj sr) =>
if sr.rendered
line.delete(sr.srLine)
box.delete(sr.srBox)
label.delete(sr.srLabel)
label.delete(sr.breakLabel)
if sr.retestLabels.size() > 0
for i = 0 to sr.retestLabels.size() - 1
curRetestLabel = sr.retestLabels.get(i)
label.delete(curRetestLabel)
sr.rendered := false
var allSRInfoList = array.new()
var barInfoList = array.new()
pivotHigh = ta.pivothigh(srPivotLength, srPivotLength)
pivotLow = ta.pivotlow(srPivotLength, srPivotLength)
barInfoList.unshift(barInfo.new(time, time_close, close, high, low))
if barInfoList.size() > maxBarInfoListSize
barInfoList.pop()
if insideBounds and barstate.isconfirmed
// Find Supports
if not na(pivotLow)
validSR = true
if allSRInfoList.size() > 0
for i = 0 to allSRInfoList.size() - 1
curRSInfo = allSRInfoList.get(i)
if (math.abs(curRSInfo.price - pivotLow) < atr * tooCloseATR) and na(curRSInfo.breakTime)
validSR := false
break
if validSR
newSRInfo = srInfo.new(barInfoList.get(srPivotLength).t, pivotLow, "Support", 1, timeframe.period)
newSRInfo.retestTimes := array.new()
//for i = 1 to srPivotLength
//curBI = barInfoList.get(i)
//if (curBI.l <= newSRInfo.price and curBI.c >= newSRInfo.price)
//newSRInfo.strength += 1
//if curBI.t != newSRInfo.startTime
//newSRInfo.retestTimes.unshift(curBI.t)
allSRInfoList.unshift(newSRInfo)
while allSRInfoList.size() > maxSRInfoListSize
allSRInfoList.pop()
// Find Resistances
if not na(pivotHigh)
validSR = true
if allSRInfoList.size() > 0
for i = 0 to allSRInfoList.size() - 1
curRSInfo = allSRInfoList.get(i)
if (math.abs(curRSInfo.price - pivotLow) < atr * tooCloseATR) and na(curRSInfo.breakTime)
validSR := false
break
if validSR
newSRInfo = srInfo.new(barInfoList.get(srPivotLength).t, pivotHigh, "Resistance", 1, timeframe.period)
newSRInfo.retestTimes := array.new()
//for i = 1 to srPivotLength
//curBI = barInfoList.get(i)
//if (curBI.h >= newSRInfo.price and curBI.c <= newSRInfo.price)
//newSRInfo.strength += 1
//if curBI.t != newSRInfo.startTime
//newSRInfo.retestTimes.unshift(curBI.t)
allSRInfoList.unshift(newSRInfo)
if allSRInfoList.size() > maxSRInfoListSize
allSRInfoList.pop()
// Handle SR Infos
if insideBounds and (srInvalidation == "Wick" or barstate.isconfirmed)
if allSRInfoList.size() > 0
for i = 0 to allSRInfoList.size() - 1
srInfo curSRInfo = allSRInfoList.get(i)
// Breaks
invHigh = (srInvalidation == "Close" ? close : high)
invLow = (srInvalidation == "Close" ? close : low)
closeTime = time
if na(curSRInfo.breakTime)
if curSRInfo.srType == "Resistance" and invHigh > curSRInfo.price
if (not avoidFalseBreaks) or (volume > avgVolume * breakVolumeThreshold)
curSRInfo.breakTime := closeTime
if inverseBrokenLineColor and (not curSRInfo.ephemeral) and curSRInfo.strength >= srStrength
ephSR = srInfo.new(closeTime, curSRInfo.price, "Support", curSRInfo.strength, curSRInfo.timeframeStr, true)
ephSR.retestTimes := array.new()
allSRInfoList.unshift(ephSR)
else if curSRInfo.srType == "Support" and invLow < curSRInfo.price
if (not avoidFalseBreaks) or (volume > avgVolume * breakVolumeThreshold)
curSRInfo.breakTime := closeTime
if inverseBrokenLineColor and (not curSRInfo.ephemeral) and curSRInfo.strength >= srStrength
ephSR = srInfo.new(closeTime, curSRInfo.price, "Resistance", curSRInfo.strength, curSRInfo.timeframeStr, true)
ephSR.retestTimes := array.new()
allSRInfoList.unshift(ephSR)
// Strength & Retests
if na(curSRInfo.breakTime) and time > curSRInfo.startTime and barstate.isconfirmed
if curSRInfo.srType == "Resistance" and high >= curSRInfo.price and close <= curSRInfo.price
int lastRetestTime = 0
if curSRInfo.retestTimes.size() > 0
lastRetestTime := curSRInfo.retestTimes.get(0)
if lastRetestTime != time
if not curSRInfo.ephemeral
curSRInfo.strength += 1
curSRInfo.retestTimes.unshift(time)
else if curSRInfo.srType == "Support" and low <= curSRInfo.price and close >= curSRInfo.price
int lastRetestTime = 0
if curSRInfo.retestTimes.size() > 0
lastRetestTime := curSRInfo.retestTimes.get(0)
if lastRetestTime != time
if not curSRInfo.ephemeral
curSRInfo.strength += 1
curSRInfo.retestTimes.unshift(time)
fixSRToTimeframe (srObj sr) =>
srMS = math.max(timeframe.in_seconds(sr.info.timeframeStr), timeframe.in_seconds()) * 1000
if (not sr.startFixed)
if not sr.info.ephemeral
if sr.info.srType == "Resistance"
sr.info.startTime := findValRtnTime(barInfoList, sr.info.price, "High", "Nearest", sr.info.startTime - srMS, sr.info.startTime + srMS, sr.info.startTime)
else
sr.info.startTime := findValRtnTime(barInfoList, sr.info.price, "Low", "Nearest", sr.info.startTime - srMS, sr.info.startTime + srMS, sr.info.startTime)
sr.startFixed := true
else
if allSRList.size() > 0
for i = 0 to allSRList.size() - 1
curSR = allSRList.get(i)
if (not curSR.info.ephemeral) and (not na(curSR.info.breakTime)) and curSR.info.price == sr.info.price and ((sr.info.srType == "Resistance" and curSR.info.srType == "Support") or (sr.info.srType == "Support" and curSR.info.srType == "Resistance"))
if curSR.breakFixed
sr.info.startTime := curSR.info.breakTime
sr.startFixed := true
break
if not na(sr.info.breakTime)
if (not sr.breakFixed)
if sr.info.srType == "Resistance"
sr.info.breakTime := findValRtnTime(barInfoList, sr.info.price, srInvalidation == "Wick" ? "High" : "Close", "Higher", sr.info.breakTime - srMS, sr.info.breakTime + srMS, sr.info.breakTime)
else
sr.info.breakTime := findValRtnTime(barInfoList, sr.info.price, srInvalidation == "Wick" ? "Low" : "Close", "Lower", sr.info.breakTime - srMS, sr.info.breakTime + srMS, sr.info.breakTime)
sr.breakFixed := true
if sr.info.retestTimes.size() > 0 and fixRetests
for i = 0 to sr.info.retestTimes.size() - 1
curRetestTime = sr.info.retestTimes.get(i)
retestStartTime = curRetestTime - srMS
retestStartTime := math.max(retestStartTime, sr.info.startTime + 1)
retestEndTime = curRetestTime + srMS
if not na(sr.info.breakTime)
retestEndTime := math.min(retestEndTime, sr.info.breakTime - 1)
if sr.info.srType == "Resistance"
sr.info.retestTimes.set(i, findValRtnTime(barInfoList, sr.info.price, "High", "Higher", retestStartTime, retestEndTime, sr.info.retestTimes.get(i)))
else
sr.info.retestTimes.set(i, findValRtnTime(barInfoList, sr.info.price, "Low", "Lower", retestStartTime, retestEndTime, sr.info.retestTimes.get(i)))
getSR (srObj list, srPrice, eph, srType, timeframeStr) =>
srObj rtnSR = na
if list.size() > 0
for i = 0 to list.size() - 1
curSR = list.get(i)
if curSR.info.price == srPrice and curSR.info.ephemeral == eph and curSR.info.srType == srType and curSR.info.timeframeStr == timeframeStr
rtnSR := curSR
break
rtnSR
// Handle SR
handleTF (tfStr, tfEnabled) =>
if tfEnabled
tfSRInfoList = request.security(syminfo.tickerid, tfStr, allSRInfoList)
if not na(tfSRInfoList) and tfSRInfoList.size() > 0
for i = 0 to tfSRInfoList.size() - 1
srInfo curSRInfo = tfSRInfoList.get(i)
if fixSRs
currentSameSR = getSR(allSRList, curSRInfo.price, curSRInfo.ephemeral, curSRInfo.srType, curSRInfo.timeframeStr)
if not na(currentSameSR)
if currentSameSR.startFixed
curSRInfo.startTime := currentSameSR.info.startTime
if currentSameSR.breakFixed
curSRInfo.breakTime := currentSameSR.info.breakTime
curSRInfo.retestTimes := currentSameSR.info.retestTimes
// All other info should be replaced except fixed start, break and all retests.
currentSameSR.info := curSRInfo
if not currentSameSR.breakFixed
fixSRToTimeframe(currentSameSR)
else
srObj newSRObj = srObj.new(curSRInfo)
// We handle retests in current timeframe so no need to get them from upper.
newSRObj.info.retestTimes := array.new()
newSRObj.retestLabels := array.new()
fixSRToTimeframe(newSRObj)
allSRList.unshift(newSRObj)
else
srObj newSRObj = srObj.new(curSRInfo)
newSRObj.retestLabels := array.new()
allSRList.unshift(newSRObj)
true
if (bar_index > last_bar_index - maxDistanceToLastBar * 8) and barstate.isconfirmed
if not fixSRs
if allSRList.size() > 0
for i = 0 to allSRList.size() - 1
srObj curSRObj = allSRList.get(i)
safeDeleteSRObj(curSRObj)
allSRList.clear()
handleTF(timeframe1, timeframe1Enabled)
handleTF(timeframe2, timeframe2Enabled)
handleTF(timeframe3, timeframe3Enabled)
if allSRList.size() > 0
for i = 0 to allSRList.size() - 1
srObj curSRObj = allSRList.get(i)
safeDeleteSRObj(curSRObj)
tooClose = false
for j = 0 to allSRList.size() - 1
closeSR = allSRList.get(j)
if closeSR.rendered and math.abs(closeSR.info.price - curSRObj.info.price) <= tooCloseATR * atr and closeSR.info.srType == curSRObj.info.srType and closeSR.info.ephemeral == curSRObj.info.ephemeral
tooClose := true
if not str.contains((na(closeSR.combinedTimeframeStr) ? formatTimeframeString(closeSR.info.timeframeStr) : closeSR.combinedTimeframeStr), formatTimeframeString(curSRObj.info.timeframeStr))
if na(closeSR.combinedTimeframeStr)
closeSR.combinedTimeframeStr := formatTimeframeString(closeSR.info.timeframeStr) + " & " + formatTimeframeString(curSRObj.info.timeframeStr)
else
closeSR.combinedTimeframeStr += " & " + formatTimeframeString(curSRObj.info.timeframeStr)
break
if (curSRObj.info.strength >= srStrength) and (na(curSRObj.info.breakTime) or (curSRObj.info.breakTime - curSRObj.info.startTime) >= minSRSize * curTFMS) and (not tooClose)
renderSRObj(curSRObj)
// Current Timeframe Retests
if allSRList.size() > 0 and barstate.isconfirmed
for i = 0 to allSRList.size() - 1
srObj curSR = allSRList.get(i)
if na(curSR.info.breakTime) and time > curSR.info.startTime
if curSR.info.srType == "Resistance" and high >= curSR.info.price and close <= curSR.info.price
int lastRetestTime = 0
if curSR.info.retestTimes.size() > 0
lastRetestTime := curSR.info.retestTimes.get(0)
if lastRetestTime != time
curSR.info.retestTimes.unshift(time)
else if curSR.info.srType == "Support" and low <= curSR.info.price and close >= curSR.info.price
int lastRetestTime = 0
if curSR.info.retestTimes.size() > 0
lastRetestTime := curSR.info.retestTimes.get(0)
if lastRetestTime != time
curSR.info.retestTimes.unshift(time)
//plotchar(alerts.get("Break") ? high : na, "", "✅", size = size.normal)
//plotchar(alerts.get("Retest") ? high : na, "", "❤️", size = size.normal, location = location.belowbar)
alertcondition(alerts.get("Retest"), "New Retest", "")
alertcondition(alerts.get("Break"), "New Break", "")
if enableRetestAlerts and alerts.get("Retest")
alert("New Retests Occured.")
if enableBreakAlerts and alerts.get("Break")
alert("New Breaks Occured.")

LockedEye MTF CRT Map SentinelOverview
This script provides a structured multi-timeframe display of market conditions.
It summarizes key elements from M1 up to D1 using five components:
- CRT (Continuation/Reversal Trigger)
- MA6 micro-trend filter
- Candle-close direction
- MA250 macro trend filter
- Sentiment percentage computed from the above signals
The panel is designed to present information at a glance, allowing traders to understand how different timeframes align or disagree.
The purpose is not to merge random indicators. Each row uses a specific rule-based calculation that contributes to an integrated multi-timeframe read. The focus is on market structure, micro-trend, and directional pressure as expressed across several intervals.
How the Script Works
The script does not rely on external indicators. All calculations are performed internally through candle relationships, moving averages, MTF requests, and simple classification logic.
1. CRT Logic (Continuation and Reversal)
CRT identifies two types of behavior in each timeframe:
Continuation: The current candle closes outside the previous candle’s high or low.
Reversal after a sweep: Price takes the previous high or low but closes back inside the range.
A close outside the previous range suggests continuation.
A sweep followed by a close back inside suggests a shift in pressure or reversal .
The CRT row labels these conditions as Bull, Bear, or Wait.
2. MA6 Micro-Trend
The script uses a 6-period simple moving average to understand immediate trend pressure.
Close and open both above the MA6 = Bull
Close and open both below the MA6 = Bear
Mixed = Wait
This gives a quick view of short-term momentum without repainting.
3. Candle-Close Direction
This uses a simple comparison:
Close > Open = Bull
Close < Open = Bear
Equal = Neutral
It is a raw directional signal without interpretation.
4. MA250 Macro Filter
The script applies a 250-period MA to understand the broader trend.
Break above the MA250 = BR (BullRun)
Break below the MA250 = BC(BearCrash)
Inside range = Neutral
This acts as a long-term directional filter .
5. Sentiment Computation
The script aggregates CRT, MA6, and Candle-Close across all timeframes.
Each timeframe contributes a value.
The script then calculates the percentage of bull, bear, and neutral signals.
A short text summary explains whether signals are aligned or mixed.
How to Use the Panel
Multi-Timeframe Alignment
The panel is most useful when interpreting how lower and higher timeframes behave together:
When many timeframes show the same direction, it reflects stronger alignment.
When timeframes disagree, market conditions are more mixed or range-bound.
Users can watch for shifts when multiple rows turn from mixed to aligned.
Trend-Following Context
If higher timeframes (H2–D1) show consistent directional readings in CRT, MA6, and MA250, users may treat that as broader structural context.
Lower timeframes (M1–M15) can then be used to observe pullbacks or shifts within that larger trend.
Counter-Trend Context
If higher timeframes show one direction but lower timeframes show the opposite, this may indicate short-term reactions or pullbacks.
The script does not assume these reactions will continue; it only shows the multi-frame condition so users can decide how to interpret it.
Liquidity Sweep Context
CRT will classify moments when price takes a previous high or low and re-enters the range.
This is included so users can detect areas where the market moves beyond a level and immediately rejects it.
Alerts
The script includes alert conditions for:
CRT Bull or Bear flips on the chart’s timeframe
Multi-timeframe consensus reaching a user-defined threshold
Users can create alerts through the TradingView alert menu once the indicator is added to the chart.
Note:
The script includes a non-repaint mode for alert stability. This mode ensures only confirmed candle closes are used in calculations.
Chart Use
The script displays a fixed panel on the chart.
Users may select the panel’s position to avoid covering price action.
Users are advised to publish with a clean chart where only this script is active, unless pairing is required for explanation.
Toggles:
Close Candle(Non Repaint)
Monitor: BTCUSD along w RSI
Monitor 2: Any Coin
Flip M1-D1
Fast CRT
Final Notes
This script does not forecast future price movement and does not claim accuracy, profitability, or performance results.
It is a diagnostic tool that organizes real-time price behavior across multiple timeframes.
Users should apply their own judgment and risk management.

Fib and Slope Trend Detector [EWT] + MTF Dashboard🚀 Overview
The Momentum Structure Trend Detector is a sophisticated trend-following tool that combines Price Velocity (Slope) with Market Structure (Fibonacci) to identify high-probability trend reversals and continuations.
Unlike traditional indicators that rely heavily on lagging moving averages, this script analyzes the speed of price action in real-time. It operates on the core principle of market structure: Impulse moves are fast and steep, while corrections are slow and shallow.
🧠 The Logic: Physics Meets Market Structure
This indicator determines the trend direction by calculating the Slope (Velocity) of price swings.
ZigZag Calculation: It first identifies market swings (Highs and Lows) using a standard pivot detection algorithm.
Slope Calculation: It calculates the velocity of every completed leg using the formula: $Slope = \frac{|Price Change|}{|Time Duration|}$.
Trend Definition:
Uptrend : If the previous Up-move was fast (Impulse) and the subsequent Down-move is slower (Correction), the market is primed for an uptrend.
Downtrend : If the previous Down-move was fast (Impulse) and the subsequent Up-move is slower (Correction), the market is primed for a downtrend.
🔥 Key Features
1. Aggressive Real-Time Detection (No Lag)
Most structure indicators wait for a "Higher High" to confirm a trend, which often leads to late entries. This script uses an Aggressive Live Slope calculation:
It compares the current developing slope of the live price action against the slope of the previous completed leg.
Result: As soon as the current move becomes "steeper" (faster) than the previous correction, the trend flips immediately. This allows you to catch the "meat" of the move before a new pivot is even confirmed.
2. Fibonacci Validity Filter
Momentum alone isn't enough; we need structural integrity.
The script calculates the 78.6% Retracement level of the impulse leg.
If a correction moves deeper than this Fibonacci limit (on a closing basis), the trend structure is considered "broken" or "invalid," and the indicator switches to a Neutral state. This filters out choppy/ranging markets.
3. Multi-Timeframe (MTF) Dashboard
A customizable dashboard on the chart allows for fractal analysis. You can view the trend state (UP/DOWN/NEUTRAL) across 9 different timeframes (1m to 1M) simultaneously.
Green Row : Uptrend
Red Row : Downtrend
Gray : Neutral/Indeterminate
4. Smart Visuals
Background Colo r: Changes dynamically (Teal for Bullish, Red for Bearish, Gray for Neutral) to give you an instant read of the market state.
Slope Labels : Displays the calculated numeric slope on the chart, helping you visualize the momentum difference between impulse and corrective waves.
Invalidation Levels : Automatically plots the invalidation line (Stop Loss level) based on the market structure.
🛠️ Settings & Inputs
Strategy Settings
Pivot Deviation Length : Sensitivity of the ZigZag calculation (Default: 5). Lower numbers = more sensitive to small swings.
Max Retracement % : The Fibonacci limit for a valid correction (Default: 78.6%).
Min Bars for Live Calc : To prevent noise, the script waits for this many bars after a pivot before calculating the "Live Slope" (Default: 3).
Dashboard Settings
Show Dashboard : Toggle the table on/off.
Timeframe Toggles : Enable/Disable specific timeframes (1m, 5m, 15m, 30m, 1H, 4H, 1D, 1W, 1M) to suit your trading style.
🎯 How to Use
Wait for Background Change : When the background turns Teal, it indicates that a corrective pullback has ended and a new impulse with high velocity has begun.
Check Invalidation : Look at the plotted Stop Loss Level. If price closes below this line, the trade idea is invalid.
Confirm with Dashboard : Use the table to ensure the higher timeframes (e.g., 1H, 4H) align with your current chart's direction for higher probability setups.
Disclaimer : This tool is designed for trend analysis and educational purposes. Past performance (momentum) is not indicative of future results. Always manage your risk.

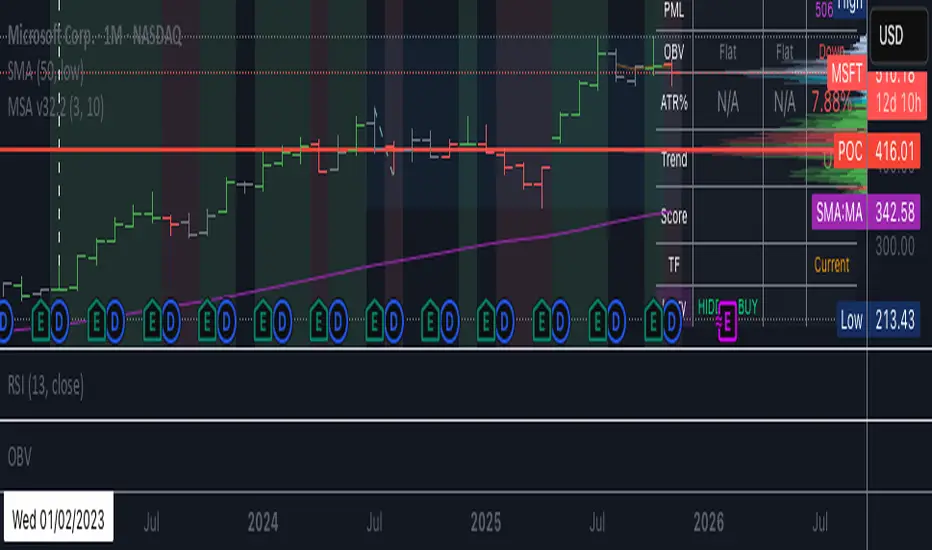
BC_Monthly Strength Armor [xAI] - v32.2 MTF LOCKED + SCORE FIXED🛡️ **Monthly Strength Armor - v32.2**
**Multi-Timeframe Institutional Edge Indicator**
🔥 **Detects smart money moves** using:
- **Monthly Range Position (Score 0–100)**
- **Higher High/Low Trend Structure (Daily/Weekly/Monthly)**
- **OBV Trend Lock (100% consistent)**
- **Larry Williams OHLC Institutional Patterns (Daily)**
📊 **MTF Table (locked values — no flicker)**
| Daily | Weekly | Monthly |
|-------|--------|---------|
| OBV | Trend | Score |
| ATR% | Larry | PMH/PML |
🎯 **Confluence Alerts**
- **3-TF Bullish / Bearish**
- **ULTRA BUY/SELL** (all TFs aligned)
- **Larry Institutional Buying/Selling**
✅ **No repaint | No warnings | Live-ready**
Built for **NVDA, MSFT, URA, QQQ, SPY**
*By @TedPrime x Grok @ xAI*
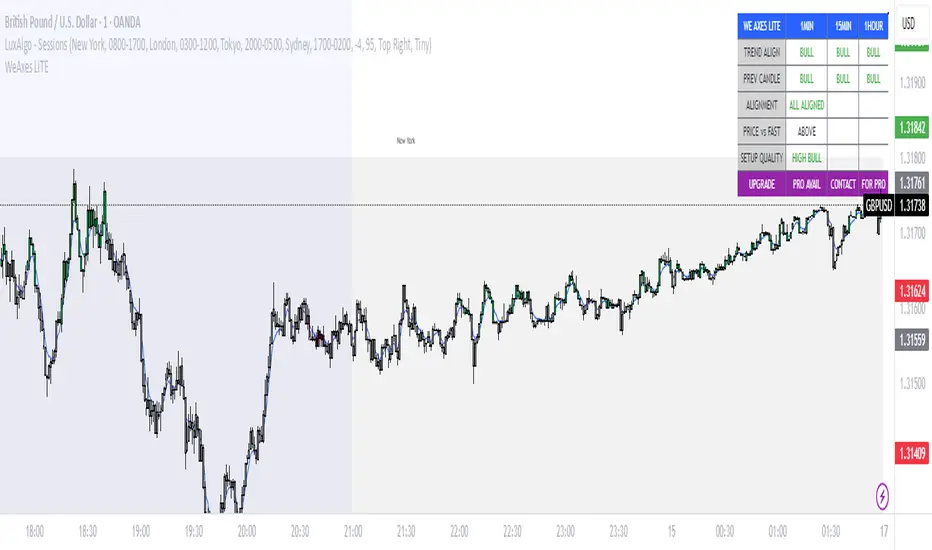
WeAxes MTF Scalper [LITE] WeAxes MTF Scalper
Professional Multi-Timeframe Alignment Tool - LITE Version
What This LITE Version Offers:
3-Timeframe Sync: Monitor 1min, 15min, and 1hr trends simultaneously
Visual Alignment System: Color-coded candles for perfect setups
Quick Setup Recognition: Instant HIGH/MEDIUM/LOW quality ratings
Clean Data Display: Essential alignment information at a glance
Perfect for Scalping:
Green Candles: Perfect bullish alignment across all timeframes
Red Candles: Perfect bearish alignment across all timeframes
Setup Quality: Know immediately if conditions are favorable
Multi-Timeframe Context: Never trade blind again
How to Use:
1. HIGH Quality Setups (Green/Red candles): Highest probability trades
2. MEDIUM Quality: All trends aligned, good for trend following
3. LOW Quality: Mixed signals, better to wait for alignment
PRO Version Includes:
- Advanced volume profiling across all timeframes
- Momentum strength calculations
- Detailed market structure analysis
- Smart Money Concepts integration
- Complete volume analysis
- And much more...
This LITE version gives you a taste of professional multi-timeframe analysis. Contact for PRO version access with full features.
Disclaimer: Use proper risk management. This tool assists analysis but doesn't guarantee profits.
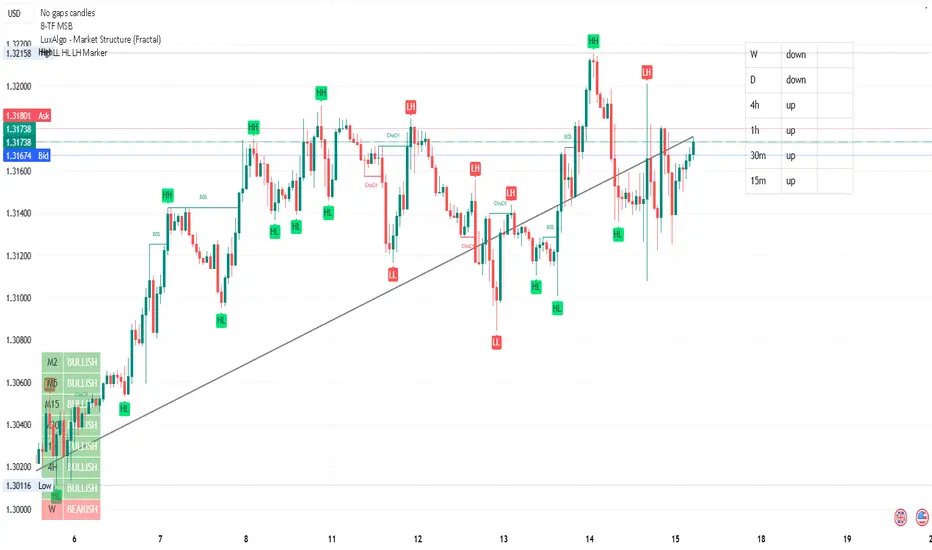
BACK TO BASIC, MTF, AOI, BOS Hiya ALL my Friends !!
I am going back to basic, MTF, AOI, BOS, mostly from freely available indicators, just adding the 8 TFs for reference. Hope this will simplify my analysis.
Cheers always !!
DYOR / NFA