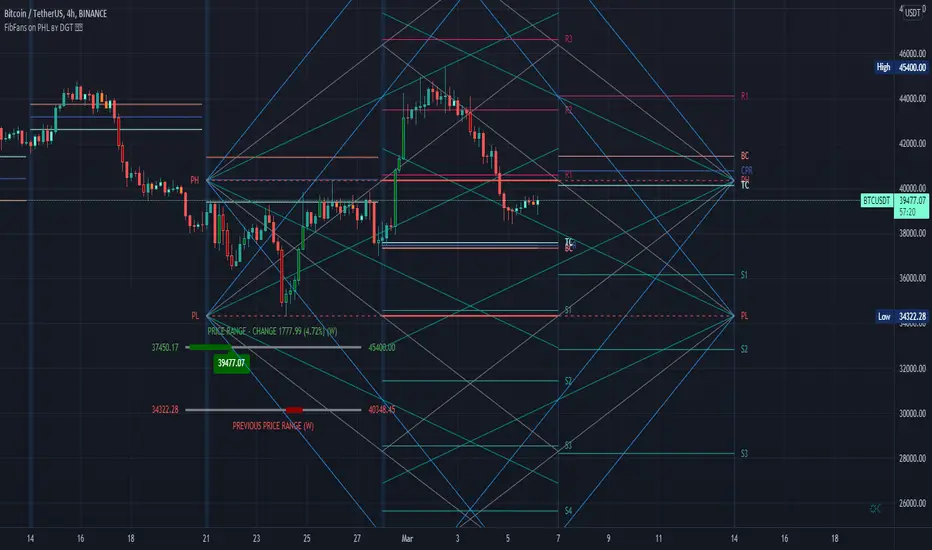
FibFans on Previous HTF HL [FaizanNawaz] by DGTFibonacci Fans application on top of Previous Higher TimeFrame High and Low. Idea owner is @faizannawaz1, special thanks to him for both the idea and tesing the application
WARNING : Study includes plottings in the future, and due to temporal gaps in non 7/24 markets such as weekends, holidays etc plotting of the fans will move to the open session (the effect will be observed on Friday and Monday). With crypto no any side affect will be observed.
More about Fibonacci Fans, how to apply fibonacci fans and automated fibonacci speed and resistance fans study
Adiitonally the study includes some addons, such as
Central Pivot Range and Traditional Pivot Points
Volume Weighted Colored Bars
Price Range Meter - Horizontal HTF Candle
Disclaimer :
Trading success is all about following your trading strategy and the indicators should fit within your trading strategy, and not to be traded upon solely
The script is for informational and educational purposes only. Use of the script does not constitute professional and/or financial advice. You alone have the sole responsibility of evaluating the script output and risks associated with the use of the script. In exchange for using the script, you agree not to hold dgtrd TradingView user liable for any possible claim for damages arising from any decision you make based on use of the script
ابحث في النصوص البرمجية عن "pivot"
CPR (Gaurav Baheti)The Central Pivot Range (CPR) is one of the most versatile price-based indicators available to traders. This versatility makes this indicator a mainstay in my trading arsenal.
Some authors have called the pivot range the “meat of the market”, while others refer to the central pivot point as the “heartbeat of the indicator”. In my opinion, the central pivot range is the Swiss Army Knife of pivots. At any given time, the range can be support or resistance , it can forecast trending or sideways price behavior, dictate the day’s direction, or serve as an integral part of a trend.

Trend Lines for RSI, CCI, Momentum, OBVHello Traders!
After publishing Trend Lines for RSI yesterday, I realized that Trend Lines for more indicators needed by the traders. so I decided to make it for four different indicators: RSI, CCI, OBV, Momentum
In the indicator options you can choose the indicator from pull-down menu.
How it works?
- On each bar it finds last 10 higher and lower Pivot Points (PP) for the indicator.
- from first bar to 10. Pivot Point it searchs if a trend line is possible
- for each PP it starts searching from the last PP .
- it checks if drawing a trend line possible or not and also it's broken or not
- if it's broken then optionally it shows broken trend lines as dotted (or you can option not to see broken lines)
- if it finds a continues trend line then it stops searhing more and draw trend line, this is done by checking angles (I did this to make the script faster, otherwise you may get error because of it needs time more than .2sec)
- the script makes this process for each PP
- then shows the trend lines
P.S. it may need 3-10 seconds when you added the script to the chart at first (because of calculations)
Trend lines for CCI:
Trend Lines for OBV
Trend Lines for Momentum:
You may want to watch how Trend Lines script works (that was made for RSI)
s3.tradingview.com
If you still didn't see Trend Lines v2 then visit:
All Comments are welcome..
Enjoy!

Trend Lines v2Hello Everyone. After working on new and better trend lines script for couple of weeks, finally I am proud to publish Trend Lines v2.
How it works?
- On each bar it finds last 10 higher and lower Pivot Points (PP).
- from first bar to 10. PP it search if a trend line is possible
- for each it starts searching from the last PP.
- it check if drawing a trend line possible or not and also it's broken or not
- if it's broken then optionally it shows broken trend lines as dotted
- if it finds a continues trend line and stop searhing more and draw trend line (I did this to make the script faster, otherwise you may get error because of it needs time more than .2sec)
- the script makes this process for each PP
optionally trend lines may be Solid or Dashed
optionally you may get rid of broken trend lines if you think it's crowded
and sometimes you may not see any trend line on the chart. this means you need to adjust the period for Pivot Points accordingly
also I made a video. if you watch this video you can see how the script works.
Important! after you add this tool to the chart you may need zoom-in and zoom-out to see all lines!
I thought a lot to make it free or not then I decided make it free and open source. you should know there is a lot of effort for this script, so if you think this is usefull please consider a donation ;)
Enjoy!

[fikira] Divergences (RSI)This script can be used with candlesticks, accompanied with " RSI + Divergences"
The calculation is different than my "Divergences (Pivots)"
Thank you!

Higher High Lower Low Strategy (With Source Code)This script finds pivot highs and pivot lows then calculates higher highs & lower lows. And also it calculates support/resistance by using HH-HL-LL-LH points.
Generally HH and HL shows up-trend, LL and LH shows down-trend.
If price breaks resistance levels it means the trend is up or if price breaks support level it means the trend is down, so the script changes bar color blue or black. if there is up-trend then bar color is blue, or if down-trend then bar color is black. also as you can see support and resistance levels change dynamically.
If you use smaller numbers for left/right bars then it will be more sensitive.
source code of :

Multi-Day VWAP V2Updated from V1.
Chart the multi-day Volume Weighted Average Price ( VWAP ). Normally, the VWAP is tracked for the current day, from the first bar of the day (regular or extended session). The VWAP shows the current value of:
-> sum(hlc3 * volume , barsForDay) / sum( volume , barsForDay),
-> where 'barsForDay' is the total number bars that have elapsed during the day for the chart interval.
The multi-day version tracks the VWAP for N days back, by averaging the previous N - 1 day bars VWAP and the current VWAP for the current bar (chart interval).
This is very different that simply using a volume weighted moving average , since the closing VWAP values are used for the historical day bars. The results are interesting for intraday trades... especially for values of 1, 2, 3, 4, and 5 days.
Version 2 includes the closing VWAP for the previous day. There are enough instances where the price chooses to bounce from the previous day's closing VWAP value that it is worth discussing. Usually this value is at or near the daily pivot, but sometimes not. Circled in the chart are some areas of recent SPY bounces on the previous day's closing VWAP.
It seems that when the 5-Day VWAP and normal VWAP have "enough" percentage separation, that there can be good intraday swing opportunities using bounces off VWAP indicators. This is similar to waiting for Hourly/Daily/Weekly/Monthly/etc pivots to have "enough" separation to allow for swing setups. When pivots are "closely" spaced, odds are the price is range bound for the time period (daily range in the case of day pivots, etc).
Previous closing VWAPs can be plotted for all 5 of the original. As with my other scripts, I welcome all comments to spark new ideas that we can all benefit from.
Enjoy.

ST15 CM inspired 4hr renko Pivots
Standard pivot points do not work with ATR Renko charts, but I really enjoy using pivot points to find strong s/r, so I started to look at scripts that could provide the same results as floor trader pivots but on a renko chart. I found a script written by CM that I was able to tweak a little and I got it work with ATR renkos. The only issue now is he only wrote the script to look for 1hr pivot points so I am now in the process off writing versions that can do the 240 1d 1w and 1m pivot points as well. Here is the 4hr :) enjoy! Thank you CM :)
Adaptive Risk Management [sgbpulse]1. Introduction:
Adaptive Risk Management is an advanced indicator designed to provide traders with a comprehensive risk management tool directly on the chart. Instead of relying on complex manual calculations, the indicator automates all critical steps of trade planning. It dynamically calculates the estimated Entry Price , the Stop Loss location, the required Position Size (Quantity) based on your capital and risk limits, and the three Take Profit targets based on your defined Reward/Risk ratios. The indicator displays all these essential data points clearly and visually on the chart, ensuring you always know the potential risk-reward profile of every trade.
ARM : The A daptive R isk M anagement every trader needs to ARM themselves with.
2. The Critical Importance of Risk Management
Proper risk management is the cornerstone of successful trading. Consistent profitability in the market is impossible without rigorously defining risk limits.
Risk Control: This starts by setting the maximum risk amount you are willing to lose in a single trade (Risk per Trade), and limiting the total capital allocated to the position (Max Capital per Trade).
Defining Boundaries (Stop Loss & Take Profit): It is mandatory to define a technical Stop Loss and a Take Profit target. A fundamental rule of risk management is that the Reward/Risk Ratio (R/R) must be a minimum of 1:1.
3. Core Features, Adaptivity, and Customization
The Adaptive Risk Management indicator is engineered for use across all major trading styles, including Swing Trading, Intraday Trading, and Scalping, providing consistent risk control regardless of the chosen timeframe.
Real-Time Dynamic Adaptivity: The indicator calculates all risk management parameters (Entry, Stop Loss, Quantity) dynamically with every new bar, thus adapting instantly to changing market conditions.
Trend Direction Adjustment: Define the analysis direction (Long/Uptrend or Short/Downtrend).
Intraday Session Data Control: Full control over whether lookback calculations will include data from Extended Trading Hours (ETH), or if the daily calculations will start actively only from the first bar of Regular Trading Hours (RTH).
Status Validation: The indicator performs critical status checks and displays clear Warning Messages if risk conditions are not met.
4. Intuitive Visualization and Real-Time Data
Dynamic Tracking Lines: The Entry Price and Stop Loss lines are updated with every new bar. Crucially, the length of these lines dynamically reflects the calculation's lookback range (e.g., the extent of Lookback Bars or the location of the confirmed Pivot Point), providing a visual anchor for the calculated price.
Risk and Reward Zones: The indicator creates a graphical background fill between Entry and Stop Loss (marked with the risk color) and between Entry and the Reward Targets (marked with the reward color).
Essential Information Labels: Labels are placed at the end of each line, providing critical data: Estimated Entry Price, Stock/Contract Quantity (Quantity), Total Entry Amount, Estimated Stop Loss, Risk per Share, Total Financial Risk (Risk Amount), Exit Amount, Estimated Take Profit 1/2/3, Reward/Risk Ratio 1/2/3, Total Reward 1/2/3, TP Exit Amount 1/2/3.
4.1. Data Window Metrics (16 Full Series)
The indicator displays 16 full data series in the TradingView Data Window, allowing precise tracking of every calculation parameter:
Entry Data: Estimated Entry, Quantity, Entry Amount.
Risk Data (Stop Loss): Estimated Stop Loss, Risk per Share, Risk Amount, Exit Amount.
Reward Data (Take Profit): Estimated Take Profit 1/2/3, Reward/Risk Ratio 1/2/3, Total Reward 1/2/3, TP Exit Amount 1/2/3.
4.2. Instant Tracking in the Status Line
The indicator displays 6 critical parameters continuously in the indicator's Status Line: Estimated Entry, Quantity, Estimated Stop Loss, Estimated Take Profit 1/2/3.
5. Detailed Indicator Inputs
5.1 General
Focused Trend: Defines the analysis direction (Uptrend / Downtrend).
Max Capital per Trade: The maximum amount allocated to purchasing stocks/contracts (in account currency).
Risk per Trade: The maximum amount the user is willing to risk in this single trade (in account currency).
ATR Length: The lookback period for the Average True Range (ATR) calculation.
5.2 Intraday Session Data Control
Regular Hours Limitation : If enabled, all daily lookback calculations (for Entry/Stop Loss anchor points) will begin strictly from the first Regular Trading Hours (RTH) bar. This limits the lookback range to the current RTH session, excluding preceding Extended Trading Hours (ETH) data. Only relevant for Intraday charts. Default: False (Off)
5.3 Entry Inputs
Entry Method: Selects the entry price calculation method:
Current Price: Uses the closing price of the current bar as the estimated entry point (Market Entry).
ATR Real Bodies Margin :
- Uptrend: Calculates the Maximum Real Body over the lookback period + the calculated safety margin.
- Downtrend: Calculates the Minimum Real Body over the lookback period - the calculated safety margin.
ATR Bars Margin :
- Uptrend: Calculates the Maximum High price over the lookback period + the calculated safety margin.
- Downtrend: Calculates the Minimum Low price over the lookback period - the calculated safety margin.
Lookback Bars: The number of bars used to calculate the extremes in the ATR-based entry methods (Relevant only for ATR Real Bodies Margin and ATR Bars Margin methods).
ATR Multiplier (Entry): The multiplier applied to the ATR value. The result of the multiplication is the calculated safety margin used to determine the estimated Entry Price.
5.4 Risk Inputs (Stop Loss)
Risk Method: Selects the Stop Loss price calculation method.
ATR Current Price Margin :
- Uptrend: Entry Price - the calculated safety margin.
- Downtrend: Entry Price + the calculated safety margin.
ATR Current Bar Margin :
- Uptrend: Current Bar's Low price - the calculated safety margin.
- Downtrend: Current Bar's High price + the calculated safety margin.
ATR Bars Margin :
- Uptrend: Lowest Low over lookback period - the calculated safety margin.
- Downtrend: Highest High over lookback period + the calculated safety margin.
ATR Pivot Margin :
- Uptrend: The first confirmed Pivot Low point - the calculated safety margin.
- Downtrend: The first confirmed Pivot High point + the calculated safety margin.
Lookback Bars: The lookback period for finding the extreme price used in the 'ATR Bars Margin' calculation.
ATR Multiplier (Risk): The multiplier applied to the ATR value. The result of the multiplication is the calculated safety margin used to place the estimated Stop Loss. Note: If set to 0, the Stop Loss will be placed exactly at the technical anchor point, provided the Minimum Margin Value is also 0.
Minimum Margin Value: The minimum price value (e.g., $0.01) the Stop Loss margin buffer must be.
Pivot (Left / Right): The number of bars required on either side of the pivot bar for confirmation (relevant only for the ATR Pivot Margin method).
5.5 Reward Inputs (Take Profit)
Show Take Profit 1/2/3: ON/OFF switch to control the visibility of each Take Profit target.
Reward/Risk Ratio 1/ 2/ 3: Defines the R/R ratio for the profit target. Must be ≥1.0.
6. Indicator Status/Warning Messages
In situations where the Stop Loss location cannot be calculated logically and validly, often caused by a mismatch between the configured Focused Trend (Uptrend/Downtrend) and the actual price action, the indicator will display a warning message, explaining the reason and suggesting corrective action.
Status Message 1: Pivot reference unavailable
Condition: The Stop Loss is set to the "ATR Pivot Margin" method, but the anchor point (Pivot) is missing or inaccessible.
Message Displayed: "Pivot reference unavailable. Wait for valid price action, or adjust the Regular Hours Limitation setting or Pivot Left/Right inputs."
Status Message 2: Calculated Stop Loss is unsafe
Condition: The calculated Stop Loss is placed illogically or unsafely relative to the trend direction and the Entry price.
Message Displayed: "Calculated Stop Loss is unsafe for current trend. Wait for valid price action or adjust SL Lookback/Multiplier."
7. Summary
The Adaptive Risk Management (ARM) indicator provides a seamless and systematic approach to trade execution and risk control. By dynamically automating all critical trade parameters—from Entry Price and Stop Loss placement to Position Sizing and Take Profit targets—ARM removes emotional bias and ensures every trade adheres strictly to your predefined risk profile.
Key Benefits:
Systematic Risk Control: Strict enforcement of maximum capital allocation and risk per trade limits.
Adaptivity: Dynamic calculation of prices and quantities based on real-time market data (ATR and Lookback).
Clarity and Trust: Clear on-chart visualization, precise data metrics (16 series), and unambiguous Status/Warning Messages ensure transparency and reliability.
ARM allows traders to focus on strategy and analysis, confident that their execution complies with the core principles of professional risk management.
Important Note: Trading Risk
This indicator is intended for educational and informational purposes only and does not constitute investment advice or a recommendation for trading in any form whatsoever.
Trading in financial markets involves significant risk of capital loss. It is important to remember that past performance is not indicative of future results. All trading decisions are your sole responsibility. Never trade with money you cannot afford to lose.

Supply & Demand ZonesThis indicator detects high-probability supply and demand zones using a multi-step smart money concept approach:
Liquidity Sweep Detection: Identifies when price sweeps above a pivot high (supply setup) or below a pivot low (demand setup), capturing liquidity grabs by institutional traders.
Displacement Confirmation: Requires a strong displacement candle (measured by ATR and body percentage) or fair value gap (FVG/imbalance) in the opposite direction after the sweep.
Volume Confirmation: Optional filter ensures zones form only when volume exceeds the user-defined threshold, indicating institutional participation.
Smart Filtering: Built-in logic prevents overlapping zones, enforces minimum spacing between signals, and requires confirmation bars to eliminate false signals.
Zone Lifecycle Management: Zones are automatically removed when price closes through them with momentum. Breached zones can optionally "flip" to the opposite type when re-tested with strong displacement.
✨ Key Features
Clean Visual Display: Small "D" (Demand) and "S" (Supply) labels with shaded zone boxes
Non-Repainting: All signals use confirmed historical data—no lookahead or repainting
Volume Filter: Optional confirmation using volume spike detection
Zone Flip Logic: Breached demand zones can become supply (and vice versa) when violated
Overlap Prevention: Smart algorithm prevents clustered or duplicate zones
Confirmation Delay: Configurable wait period after sweep to confirm genuine setups
Customizable Inputs: Adjust pivot sensitivity, displacement thresholds, volume filters, and more
Alert Ready: Built-in alert conditions for new supply and demand zone formations
🎯 How to Add to Your Chart
Favorite the Indicator: Click the star icon to add this script to your favorites
Open Your Chart: Navigate to the asset and timeframe you want to trade (works best on 5m-1H intraday charts)
Add Indicator: Click "Indicators" at the top, search for "Supply & Demand Zones (Smart Filtered)", and add to chart
Customize Settings: Click the gear icon ⚙️ to adjust inputs based on your trading style and instrument volatility
Set Alerts: Right-click the indicator name → "Add alert" → Select "Supply Zone" or "Demand Zone" conditions
📖 How to Use
Demand Zones (Green "D" Labels):
Price swept below a swing low (liquidity grab)
Strong bullish displacement or imbalance followed
Trading Action: Look for LONG entries when price returns to the zone or on immediate continuation
Stop Loss: Place just below the zone or sweep low
Target: Next resistance level, supply zone, or risk-reward ratio target
Supply Zones (Red "S" Labels):
Price swept above a swing high (liquidity grab)
Strong bearish displacement or imbalance followed
Trading Action: Look for SHORT entries when price returns to the zone or on immediate continuation
Stop Loss: Place just above the zone or sweep high
Target: Next support level, demand zone, or risk-reward ratio target
Flipped Zones (Orange Labels):
Previous demand/supply zone was broken with strong momentum
Zone has flipped polarity and may now act as the opposite type
Trading Action: Exercise caution—wait for additional confirmation before trading flipped zones
🔍 What to Look For
High-Quality Setups:
Zone forms with above-average volume (check volume filter is enabled)
Clear liquidity sweep visible on the chart
Strong displacement candle with large body percentage
Zone aligns with overall market trend or key structure levels
Multiple timeframe confirmation (check higher timeframe for context)
Avoid These Setups:
Zones forming in choppy, low-volume conditions
Multiple overlapping zones in the same area (indicator filters these automatically)
Zones that appear immediately after news events (set confirmation bars higher)
Counter-trend zones without additional confluence
⚙️ Recommended Settings by Timeframe
5-Minute Charts (Scalping):
Pivot Lookback: 3/3
Min Displacement ATR: 0.9
Confirmation Bars: 1
Min Zone Spacing: 3-5 bars
Volume Threshold: 1.2x
15-Minute Charts (Intraday):
Pivot Lookback: 4/4 (default)
Min Displacement ATR: 1.0 (default)
Confirmation Bars: 2 (default)
Min Zone Spacing: 5-8 bars
Volume Threshold: 1.2x
1-Hour Charts (Swing Trading):
Pivot Lookback: 5/5
Min Displacement ATR: 1.2-1.5
Confirmation Bars: 3
Min Zone Spacing: 8-12 bars
Volume Threshold: 1.3x
💡 Trading Tips & Best Practices
Combine with Price Action: Use this indicator alongside candlestick patterns, support/resistance, and trendlines for confirmation
Multiple Timeframe Analysis: Check higher timeframes for overall bias and major zones
Volume is Key: Enable volume filter to focus on institutional-backed moves
Risk Management: Always use stop losses and proper position sizing
Backtesting: Test settings on your preferred instruments and timeframes before live trading
Context Matters: Consider market conditions, news events, and session times
Wait for Confirmation: Don't rush entries—wait for price reaction at the zone
⚠️ Important Disclaimers
Educational Purpose Only: This indicator is provided for educational and informational purposes. It does not constitute financial advice, investment recommendations, or trading signals.
No Guarantees: Past performance and backtested results do not guarantee future results. Trading involves substantial risk of loss.

Volume Weighted Intra Bar Standard DeviationThis indicator provides a high-resolution analysis of market volatility by dissecting each bar on the chart into its fundamental components. It uses data from a lower, intra-bar timeframe to separate the total volatility of a single bar into its 'directional' and 'non-directional' parts.
Key Features:
Intra-Bar Volatility Decomposition: For each bar on the chart, the indicator analyzes the underlying price action on a smaller timeframe ('Intra-Bar Timeframe') and quantifies two types of volatility:
Between-Bar Volatility (Directional): Calculated from price movements between the intra-bar candles. This component represents the directional, trending price action within the main bar.
Within-Bar Volatility (Non-Directional): Calculated from price fluctuations inside each intra-bar candle. This component represents the choppy, noisy, or ranging price action.
Dual Display Modes: The indicator offers two modes to visualize this information:
Absolute Mode: Plots the total standard deviation as a stacked column chart, showing the absolute magnitude of volatility and the contribution of each component.
Normalized Mode: Plots the components as a 100% stacked column chart (scaled from 0 to 1), focusing purely on the percentage ratio of 'between-bar' (trending) and 'within-bar' (choppy) volatility.
Calculation Options:
Statistical Model: The 'Estimate Bar Statistics' option (enabled by default) uses a statistical model ('Estimator') to perform the decomposition. (Assumption: In this mode, the Source input is ignored, and an estimated mean for each bar is used instead).
Normalization: An optional 'Normalize Volatility' setting calculates volatility in percentage terms (log-space).
Volume Weighting: An option (Volume weighted) applies volume weighting to all intra-bar volatility calculations.
Volatility Pivot Detection: Includes a built-in pivot detector that identifies significant turning points (highs and lows) in the total volatility line. (Note: This is only visible in 'Absolute Mode').
Note on Confirmation (Lag): Pivot signals are confirmed using a lookback method. A pivot is only plotted after the Pivot Right Bars input has passed, which introduces an inherent lag.
Multi-Timeframe (MTF) Capability:
MTF Analysis Lines: The entire intra-bar analysis can be run on a higher timeframe (using the Timeframe input), with standard options to handle gaps (Fill Gaps) and prevent repainting (Wait for...).
Limitation: The Pivot detection (Calculate Pivots) is disabled if a Higher Timeframe (HTF) is selected.
Integrated Alerts: Includes 6 alerts for:
Volatility character changes (e.g., 'Character Change from Choppy to Trend').
Dominant character emerging (e.g., 'Trend Character Emerging').
Total Volatility pivot (High/Low) detection.
Caution: Real-Time Data Behavior (Intra-Bar Repainting) This indicator uses high-resolution intra-bar data. As a result, the values on the current, unclosed bar (the real-time bar) will update dynamically as new intra-bar data arrives. This behavior is normal and necessary for this type of analysis. Signals should only be considered final after the main chart bar has closed.
DISCLAIMER
For Informational/Educational Use Only: This indicator is provided for informational and educational purposes only. It does not constitute financial, investment, or trading advice, nor is it a recommendation to buy or sell any asset.
Use at Your Own Risk: All trading decisions you make based on the information or signals generated by this indicator are made solely at your own risk.
No Guarantee of Performance: Past performance is not an indicator of future results. The author makes no guarantee regarding the accuracy of the signals or future profitability.
No Liability: The author shall not be held liable for any financial losses or damages incurred directly or indirectly from the use of this indicator.
Signals Are Not Recommendations: The alerts and visual signals (e.g., crossovers) generated by this tool are not direct recommendations to buy or sell. They are technical observations for your own analysis and consideration.

Volume Weighted Standard DeviationThis indicator calculates the Standard Deviation and decomposes total volatility into its core components, allowing to analyze the underlying character of the market.
Key Features:
Volatility Decomposition: The indicator separates volatility based on the 'Estimate Bar Statistics' option.
Standard Mode (Estimate Bar Statistics = OFF): Calculates a simple (Volume-Weighted) Standard Deviation of the selected Source.
Decomposition Mode (Estimate Bar Statistics = ON): The indicator uses a statistical model ('Estimator') to calculate within-bar volatility (choppiness, noise) and between-bar volatility (trending moves). (Assumption: In this mode, the Source input is ignored, and an estimated mean for each bar is used instead).
Dual Display Modes: The indicator offers two modes to visualize this information:
Absolute Mode: Plots the total standard deviation as a stacked area chart, showing the proportional contribution of the 'Between' and 'Within' components.
Normalized Mode: Plots the direct ratio of each component's variance (from 0 to 1), making it easy to identify which character is dominant.
Calculation Options: The volatility calculation can be optionally Volume weighted. An optional Normalize Volatility setting performs the calculation in logarithmic space, making volatility comparable across different price scales.
Volatility Pivot Detection: Includes a built-in pivot detector that identifies significant turning points (highs and lows) in the total volatility line. (Note: This is only visible in 'Absolute Mode').
Note on Confirmation (Lag): Pivot signals are confirmed using a lookback method. A pivot is only plotted after the Pivot Right Bars input has passed, which introduces an inherent lag.
Multi-Timeframe (MTF) Capability:
MTF Volatility Lines: The volatility lines can be calculated on a higher timeframe, with standard options to handle gaps (Fill Gaps) and prevent repainting (Wait for...).
Limitation: The Pivot detection (Calculate Pivots) is disabled if a Higher Timeframe (HTF) is selected.
Integrated Alerts: Includes 6 alerts for:
Volatility character changes (e.g., 'Trend Character Emerging', 'Character Change from Trend to Choppy').
Volatility pivot (high or low) detection.
DISCLAIMER
For Informational/Educational Use Only: This indicator is provided for informational and educational purposes only. It does not constitute financial, investment, or trading advice, nor is it a recommendation to buy or sell any asset.
Use at Your Own Risk: All trading decisions you make based on the information or signals generated by this indicator are made solely at your own risk.
No Guarantee of Performance: Past performance is not an indicator of future results. The author makes no guarantee regarding the accuracy of the signals or future profitability.
No Liability: The author shall not be held liable for any financial losses or damages incurred directly or indirectly from the use of this indicator.
Signals Are Not Recommendations: The alerts and visual signals (e.g., crossovers) generated by this tool are not direct recommendations to buy or sell. They are technical observations for your own analysis and consideration.

Options levelsOverview
Options Levels 🎯 plots 13 key institutional and options-based levels directly on your chart — including Call Wall, Put Wall, Gamma Flip, Whales Pivot, five Whale levels, and Sigma deviation bands (σ¹ / σ²).
It’s designed for both intraday and swing traders, offering a clean visual structure with elegant emoji labels, flexible visibility controls, and precise right-edge extensions for each line.
✨ Key Features
Single structured input with 13 ordered levels:
CallWall, PutWall, GammaFlip, Whales Pivot, Whale1..Whale5, Upperσ1, Upperσ2, Lowerσ1, Lowerσ2
Expressive emoji labels (🟢, 🔴, ⚖️, 🌑, 🐋, σ¹/σ²) optimized for dark themes.
Right-edge alignment: each line extends exactly to its label — no infinite lines.
Group visibility toggles:
• Critical Levels → Call Wall, Put Wall, Gamma Flip, Whales Pivot
• Whale Levels → Whale 1–5
• Sigma Bands → Upper/Lower σ¹ and σ²
Dynamic line-length multipliers that emphasize key levels.
Built-in alert conditions:
• Price crossing above the Call Wall
• Price crossing below the Put Wall
⚙️ Inputs & Settings
📋 Level List (string) : comma-separated list of 13 numeric values.
Example:
🎨 Appearance
• Base line length (bars)
• Label visibility toggle
• Line thickness
• Extend line and label to the right
• Distance (bars) between last candle and label
👁️ Visibility Controls
• Toggle Critical, Whale, or Sigma levels independently
🚀 How to Use
Paste your list of 13 ordered levels into the input field.
Adjust base length and thickness according to your timeframe.
Enable “Extend to the right” to position labels neatly beyond the last candle.
Use visibility toggles to focus on specific level groups (e.g., hide Whale Levels for short-term setups).
Optionally enable alerts to track price breakouts above/below Call and Put Walls.
The plotted levels are derived from aggregated options flow data, institutional positioning, and volatility-based deviations (σ). They serve as reference zones rather than predictive signals, helping visualize where liquidity and dealer hedging pressure may cluster.
📖 Level Definitions
Call Wall 🟢 — The strike with the highest call open interest; potential resistance area.
Put Wall 🔴 — The strike with the highest put open interest; potential support area.
Gamma Flip ⚖️ — Level where total gamma exposure changes sign; may reflect a shift in dealer hedging behavior.
Whales Pivot 🌑 — Represents the average institutional positioning from the previous trading day, reflecting where large option flows were most concentrated.
Whale Levels 🐋 — High-premium or large-volume strikes typically linked to institutional activity.
Upper σ¹ / σ² 📈 — One and two standard deviations above spot; potential overextension zones.
Lower σ¹ / σ² 📉 — One and two standard deviations below spot; potential mean-reversion zones.
Levels are manually input by the user. This script is a visual reference, not a predictive model.
⚠️ Notes
Levels are user-provided (not calculated by this script).
The indicator does not issue buy/sell signals or provide performance guarantees.
Designed purely as a visual aid for contextual market reference.
Optimized with barstate.islast for performance (draws only at the latest bar).
Disclaimer:
This indicator is for educational and visual purposes only. It does not generate buy/sell signals or guarantee future results. User-provided levels are meant for contextual reference only.
Developed for traders who rely on market structure and options flow context. Feedback and suggestions are welcome.

Cascades & Sloped Lines (RU) • v6How it works
• The base trendline is built from the last two confirmed pivot lows (uptrend) and/or pivot highs (downtrend).
• “Cascades” are a set of parallel lines above and below the base line, spaced equally: either ATR × multiplier or a fixed percentage of price.
• Lines are automatically rebuilt when a new confirmed pivot appears. To avoid overloading the chart, old lines are removed.
Useful settings
• Increase Pivot Left/Right if you want “larger” swing points.
• Switch the step mode to Percent if you want a fixed distance.
• Adjust Lines Above/Below to get a “dense” or “sparse” cascade.
• Colors and thickness — match them to your style.

Fibonacci Sequence Circles [BigBeluga]🔵 Overview
The Fibonacci Sequence Circles is a unique and visually intuitive indicator designed for the TradingView platform. It combines the principles of the Fibonacci sequence with geometric circles to help traders identify potential support and resistance levels, as well as price expansion zones. The indicator dynamically anchors to key price points, such as pivot highs, pivot lows, or timeframe changes (daily, weekly, monthly), and generates Fibonacci-based circles around these anchor points.
⚠️For proper indicators visualization use simple not logarithmic chart
🔵 Key Features
Customizable Anchor Points : The indicator can be anchored to Pivot Highs , Pivot Lows , or timeframe changes ( Daily, Weekly, Monthly ), making it adaptable to various trading strategies.
Fibonacci Sequence Logic : The circles are generated using the Fibonacci sequence, where the diameter of each circle is the sum of the diameters of the two preceding circles.
first = start_val
secon = start_val + int(start_val/2)
three = first + secon
four = secon + three
five = three + four
six = four + five
seven = five + six
eight = six + seven
nine = seven + eight
ten = eight + nine
Adjustable Start Value : Traders can modify the starting value of the sequence to scale the circles larger or smaller, ensuring they fit the current price action.
Color Customization : Each circle can be individually enabled or disabled, and its color can be customized for better visual clarity.
Visual Labels : The diameter of each circle (in bars) is displayed next to the circle, providing additional context for analysis.
🔵 Usage
Step 1: Set the Anchor Point - Choose the anchor type ( Pivot High, Pivot Low, Daily, Weekly, Monthly ) to define the center of the Fibonacci circles.
Step 2: Adjust the Start Value - Modify the starting value of the Fibonacci sequence to scale the circles according to the price action.
Step 3: Customize Circle Colors - Enable or disable specific circles and adjust their colors for better visualization.
Step 4: Analyze Price Action - Use the circles to identify potential support/resistance levels, price expansion zones, or trend continuation areas.
Step 5: Combine with Other Tools - Enhance your analysis by combining the indicator with other technical tools like trendlines, moving averages, or volume indicators.
The Fibonacci Sequence Circles is a powerful and flexible tool for traders who rely on Fibonacci principles and geometric patterns. Its ability to anchor to key price points and dynamically scale based on market conditions makes it suitable for various trading styles and timeframes. Whether you're a day trader or a long-term investor, this indicator can help you visualize and anticipate price movements with greater precision.

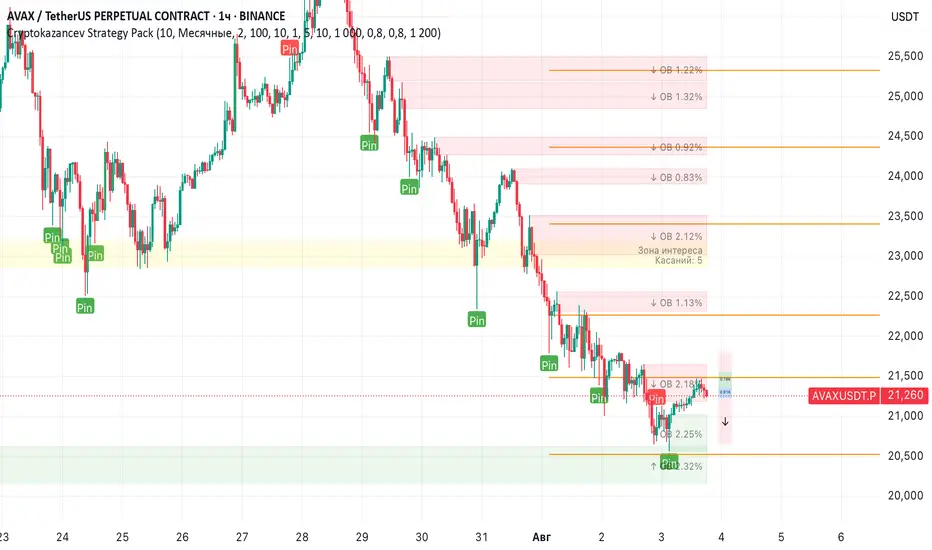
Cryptokazancev Strategy PackCryptokazancev Strategy Pack
Комплексный инструмент для анализа рыночной структуры / Comprehensive Market Structure Analysis Tool
🇷🇺 Описание на русском
Cryptokazancev Strategy Pack by ZeeZeeMon - это мощный набор инструментов для технического анализа, включающий:
• Ордерблоки (Order Blocks) с настройкой количества и цветов
• Пивоты (Pivot Points) различных таймфреймов
• Рыночную структуру с зонами Фибоначчи (0.618, 0.786)
• Разворотные конструкции (пинбары и поглощения)
• Зоны интереса на основе скопления свингов
📊 Основные функции:
1. Ордерблоки
- Автоматическое определение бычьих/медвежьих OB
- Настройка максимального количества блоков (до 30)
- Кастомизация цветов
2. Пивоты
- Поддержка таймфреймов: Дневные/Недельные/Месячные/Квартальные/Годовые
- Уровни Camarilla (P, R1-R4, S1-S4)
3. Рыночная структура
- Четкое определение тренда (UP/DOWN)
- Ключевые уровни Фибо (0.618 и 0.786)
- Настройка глубины анализа (10-1000 баров)
4. Разворотные конструкции
- Обнаружение пинбаров
- Обнаружение поглощений
- Настройка чувствительности
5. Зоны интереса
- Алгоритм кластеризации свингов
- Настройка через ATR-мультипликатор
- Лимит отображаемых зон
🇬🇧 English Description
ZeeZeeMon Pack is a comprehensive market analysis toolkit featuring:
• Order Blocks with customizable count and colors
• Pivot Points for multiple timeframes
• Market Structure with Fibonacci zones
• Reversal patterns (pinbars and engulfings)
• Interest Zones based on swing clustering
📊 Key Features:
1. Order Blocks
- Auto-detection of bullish/bearish OB
- Configurable max blocks (up to 30)
- Custom color schemes
2. Pivot Points
- Supports: Daily/Weekly/Monthly/Quarterly/Yearly
- Camarilla levels (P, R1-R4, S1-S4)
3. Market Structure
- Clear trend detection (UP/DOWN)
- Key Fibonacci levels (0.618 & 0.786)
- Adjustable analysis depth (10-1000 bars)
4. Reversal Patterns
- Smart pinbar detection
- ATR-based engulfing filter
- Sensitivity adjustment
5. Interest Zones
- Swing clustering algorithm
- ATR-multiplier configuration
- Display limit (up to 10 zones)
⚙️ Technical Highlights:
• Built with Pine Script v5
• Performance-optimized
• Well-commented code
• Flexible settings system
⚠️ Важно / Important:
Индикатор в бета-версии. Тестируйте перед использованием в реальной торговле.
This is BETA version. Please test before live trading.
💬 Поддержка / Support:
Комментарии к скрипту / Script comments section