RSI Divergences (Regular, Hidden, Exaggerated)RSI Divergences (Regular, Hidden, Exaggerated)
This indicator detects and visually highlights all major types of RSI divergences on your chart: Regular, Hidden, and Exaggerated divergences, both bullish and bearish.
Key Features:
Calculates RSI based on a user-defined length and timeframe that automatically matches your chart's timeframe.
Identifies pivot highs and lows on both price and RSI using customizable pivot left/right bars.
Detects divergences when RSI and price movements disagree, signaling potential trend reversals or continuation.
Differentiates between three types of divergences:
Regular Divergence: Classic signal for possible trend reversal.
Hidden Divergence: Often indicates trend continuation.
Exaggerated Divergence: A less common form signaling momentum changes.
Draws clear colored lines and labels on the RSI pane for each divergence, using green for bullish and red for bearish signals.
Includes RSI overbought (70) and oversold (30) bands with gradient fills to help visualize RSI zones.
Efficient use of arrays to track pivots and manage plotting history for smooth performance.
Usage:
Ideal for traders looking to leverage RSI divergences for better timing entries and exits in trending and range-bound markets. The script is fully customizable and works seamlessly across different timeframes
ابحث في النصوص البرمجية عن "rsi"

RSI Run‑Length by ATTARSI Run‑Length by ATTA – The Next Generation of RSI
The RSI Run‑Length by ATTA indicator was developed to quantify not only the magnitude of price movements but also the continuity with which they occur. Instead of relying on point‑by‑point averages of gains and losses, it counts each sequence of consecutive gains (up‑run) and each sequence of consecutive losses (down‑run), applies Wilder’s RMA smoothing to these counts, and then computes the classic RSI formula on their ratio.
This approach significantly reduces market noise by giving greater weight to sustained trends, while simultaneously reducing the lag inherent in traditional methods. Rather than waiting for signals triggered by isolated fluctuations, RSI Run‑Length by ATTA detects turning points at the earliest stages of movement streaks and maintains precise, timely responsiveness.
Core Principles:
Run‑Length Counting: Measures trend depth without distortion from isolated spikes.
Wilder’s RMA on Counts: Provides statistical smoothing to suppress excessive volatility.
Classic RSI Formula: Applies the familiar RSI calculation to the smoothed run‑length ratio.
This mechanism enables early identification of momentum shifts and the construction of strategies based on stable sequences rather than sporadic gains. The simplicity of a single parameter (run‑length period – default 14) and the logical sequence of counting, smoothing, and ratio calculation make the tool both transparent and intuitive for technical traders and quantitative analysts alike.
Usage Instructions:
Select the run‑length period (commonly 14 bars).
Set overbought/oversold thresholds (recommended 70/30).
Overlay with complementary indicators (classic RSI, MACD, etc.) for confirmation.
I invite traders and analysts to incorporate RSI Run‑Length by ATTA into their indicator libraries to gain deeper, more actionable insights into price momentum.
Multifactor Buy/Sell Strategy V2 | RSI, MACD, ATR, EMA, Boll.BITGET:1INCHUSDT
This Pine Script code for TradingView is a multifactor Buy/Sell indicator that combines several technical factors to generate trading signals based on trend, volatility, and volume conditions. Here’s a breakdown of the main components and functionality:
Indicator Name
- Multifactor Buy/Sell Strategy V2 — an overlay indicator applied directly on the price chart.
### Input Parameters
The script includes multiple customizable parameters:
- RSI, EMA, MACD parameters — for setting periods and signals of MACD and RSI.
- ATR and Bollinger Bands — used for volatility analysis and level determination.
- Minimum Volatility Threshold — sets a minimum Bollinger Band width threshold for determining high volatility.
Core Indicators
1. RSI — calculated to identify oversold (below 30) and overbought (above 70) conditions.
2. EMA and MACD — calculates exponential moving averages and MACD histogram to determine trend direction.
3. ATR and Bollinger Bands — used to assess current volatility and establish dynamic upper and lower bands.
Volatility and Volume Analysis
- Determines the current ATR level and Bollinger Band width to evaluate high volatility.
- Calculates the volume moving average to track periods of increased volume during high volatility.
Trend Analysis
The script uses the difference between fast and slow EMAs to define strong trends:
- Uptrend — when the fast EMA is above the slow EMA, the price is above the fast EMA, and the trend is strong.
- Downtrend — when the fast EMA is below the slow EMA, the price is below the fast EMA, and the trend is strong.
Momentum Filter
- Based on the price change over the last three bars and compared against the minimum volatility threshold to identify strong momentum.
Buy and Sell Signal Generation
- Buy Signal: Uptrend with RSI oversold, positive MACD histogram, high volatility and volume, strong momentum, and sufficient Bollinger Band width.
- Sell Signal: Downtrend with RSI overbought, negative MACD histogram, high volatility and volume, strong momentum, and sufficient Bollinger Band width.
Visualization
- Buy and sell signals are displayed as green and red triangles on the chart.
- Plots for fast and slow EMAs, upper and lower bands, and Bollinger Bands.
Alerts
The script includes alert conditions for buy and sell signals, allowing notifications to be sent via email or mobile app.
Information Panel
A small table on the chart displays current volatility dataThis Pine Script code for TradingView is a multifactor Buy/Sell indicator that combines several technical factors to generate trading signals based on trend, volatility, and volume conditions. Here’s a breakdown of the main components and functionality:
Indicator Name
- Multifactor Buy/Sell Strategy V2 — an overlay indicator applied directly on the price chart.
Input Parameters
The script includes multiple customizable parameters:
- **RSI, EMA, MACD parameters** — for setting periods and signals of MACD and RSI.
- **ATR and Bollinger Bands** — used for volatility analysis and level determination.
- **Minimum Volatility Threshold** — sets a minimum Bollinger Band width threshold for determining high volatility.
Core Indicators
1. RSI — calculated to identify oversold (below 30) and overbought (above 70) conditions.
2. EMA and MACD — calculates exponential moving averages and MACD histogram to determine trend direction.
3. ATR and Bollinger Bands — used to assess current volatility and establish dynamic upper and lower bands.
Volatility and Volume Analysis
- Determines the current ATR level and Bollinger Band width to evaluate high volatility.
- Calculates the volume moving average to track periods of increased volume during high volatility.
Trend Analysis
The script uses the difference between fast and slow EMAs to define strong trends:
- Uptrend — when the fast EMA is above the slow EMA, the price is above the fast EMA, and the trend is strong.
- Downtrend — when the fast EMA is below the slow EMA, the price is below the fast EMA, and the trend is strong.
Momentum Filter
- Based on the price change over the last three bars and compared against the minimum volatility threshold to identify strong momentum.
Buy and Sell Signal Generation
- Buy Signal: Uptrend with RSI oversold, positive MACD histogram, high volatility and volume, strong momentum, and sufficient Bollinger Band width.
- Sell Signal: Downtrend with RSI overbought, negative MACD histogram, high volatility and volume, strong momentum, and sufficient Bollinger Band width.
Visualization
- Buy and sell signals are displayed as green and red triangles on the chart.
- Plots for fast and slow EMAs, upper and lower bands, and Bollinger Bands.
Alerts
The script includes alert conditions for buy and sell signals, allowing notifications to be sent via email or mobile app.
Information Panel
A small table on the chart displays current volatility
- Volatility Status — indicates high or low volatility.
- Bollinger Band Width — current width as a percentage.
- ATR Ratio — ratio of current ATR to long-term average ATR.
This script is suitable for trading in high-volatility conditions, combining multiple filters and factors to generate precise buy and sell signals.

RSI-Trend FormationRSI Trend Formation uses RSI (9) along with 3 EMA and 21 WMA . 3 EMA and 21 WMA graphs have been plotted on RSI (9). RSI value above 50 will be considered as 'BUY' zone and RSI value below 50 will be considered as 'SELL' zone.
When 21 WMA ( Volume Strength) and 3 EMA (Price Strength) crosses RSI from above (that means both of these will go below RSI ), it is a Buy signal.
When 21 WMA ( Volume Strength) and 3 EMA (Price Strength) crosses RSI from below (that means both of these will go above RSI ), it is a Sell signal.
This is the best time of 3/5/15 min Time Frame for Intraday Traders..

RSI Divergence LiquidityRSI Divergence Liquidity is an indicator designed to help you catch high-probability BUY reversals by combining two powerful concepts:
OANDA:XAUUSD
Liquidity Sweep / Swing Low: automatically marks swing-low levels and tracks when price sweeps below them and reacts back.
Bullish RSI Divergence: filters noise by comparing RSI at the swing area versus RSI at the retest, favoring reversals with stronger momentum confirmation.
How it works
The script draws Swing Low lines using Pivot Lows. When a new Swing Low forms, the previous one is cut/frozen .
When price retests a Swing Low and the candle conditions are met (bar n bullish, bar n-1 bearish), the script checks:
Whether RSI at n/n-1 is higher than the RSI at the swing (bullish divergence logic)
Whether min RSI at the swing is below a threshold (default < 36) to focus on oversold swing areas
If all conditions pass, the indicator prints an upward triangle right when bar n closes → a potential BUY signal.
How to use
Enter BUY when an up triangle appears at/near the Swing Low (liquidity sweep zone).
Stop Loss idea: below the most recent swing low / below the sweep wick.
Take Profit idea: nearest supply zone, prior high, or fixed RR such as 1:2 / 1:3 depending on your system.
Recommended settings
Best on: M5–H1 (depending on your style), especially effective when price is trending down and performs a clear sweep.
For stricter filtering: lower Max minRSI at Swing (x) to only take signals from deeper RSI lows.
Smaller Pivot Lookback → more swings/signals; larger values → fewer but cleaner swings.
Note: This tool improves probability, not certainty. Combine it with market structure / key levels and proper risk management for best results.

RSI + Psy + ADXRSI + Psychological Line + ADX (with RCI-replacement logic)
This custom TradingView indicator combines three major technical analysis tools—RSI, Psychological Line (Psy), and ADX—to help traders identify trend strength, market momentum, and overbought/oversold conditions with improved clarity.
1. Multi-Period RSI
The indicator calculates three RSI values:
Short-term RSI (9)
Mid-term RSI (26)
Long-term RSI (52)
These help users observe short-, mid-, and long-term momentum simultaneously.
Threshold lines are drawn at 70, 50, and 30 for standard RSI overbought/oversold analysis.
2. Psychological Line (Psy) with Dynamic Column Display
The Psy indicator counts how many closes within the selected period (default: 12) were higher than the previous close.
Values above 75 indicate overbought markets.
Values below 25 indicate oversold markets.
When Psy crosses these thresholds, it is displayed as a column chart centered at 50, visually expanding upward (overbought) or downward (oversold).
3. ADX Trend Strength with Color Coding
ADX is calculated from DI+ and DI− values (using true range and directional movement).
The ADX line changes color based on trend strength:
Blue: Weak trend (below 20)
Yellow: Moderate trend (20–30)
Red: Strong trend (above 30)
This helps traders easily recognize when the market transitions from low-volatility to strong-trend conditions.

RSI Hybrid + EMA Cloud + Swings(15m/2H)RSI Hybrid + EMA Cloud (15m Trend + 2H Momentum)
A dual-timeframe trading system combining fast 15-minute trend structure with higher-timeframe 2-Hour momentum, volume and structural levels.
🧩 What This Indicator Does
This tool blends:
🔹 15m Trend (EMA Cloud) – 2 Points
EMA 7 vs 21 → Short trend
EMA 30 vs 74 → Long trend
Cloud shading highlights bullish/bearish alignment
Faster, intraday trend sensitivity
🔹 2H Momentum (RSI Hybrid) – 3 Points
RSI > 50
RSI > SMA(4)
RSI > SMA(12)
Gives short / medium / long momentum confirmation from the higher timeframe.
🔹 2H Volume Pressure – 1 Point
Volume vs 20-SMA
Mild / Moderate / Strong Bull/Bear
Confirms true participation behind price moves
⭐ Score System (0–6 Total)
Component Points
15m EMA Trend 2
2H RSI Hybrid 3
2H Volume Power 1
Total 6
Interpretation:
5–6 → High-confluence direction
3–4 → Partial confluence
1–2 → Weak bias
0 → No reliable direction
Designed for discretionary and semi-systematic intraday traders.
📊 15m Structural Levels
Includes:
✔ Last confirmed 15m Swing High / Swing Low
Based on close-price pivots, not highs/lows.
✔ Live Running High since last Swing LOW
Tracks how far price has extended upward.
✔ Live Running Low since last Swing HIGH
Tracks downward extension after a swing high.
✔ ATR(15m)
Volatility reference for SL/TP or risk modeling.
These levels help in timing entries, managing stops, and identifying breakout/breakdown zones.
🖥 On-Chart Info Table
Summarizes:
15m EMA short & long trend
2H RSI short/medium/long momentum
RSI vs 50
2H volume power
Bull & Bear score (with breakdown)
Last 15m swing highs/lows
ATR(15m)
Color-coded for clarity
💡 Why Use This Indicator
High-speed 15m trend detection
Higher-TF 2H momentum & volume confirmation
Multi-layered bias presented in a simple score
Built-in structure for more intelligent entries/exits
Works on indices, stocks, FX, crypto
Ideal for intraday traders who want speed + reliability

RSI-GringoRSI-Gringo — Stochastic RSI with Advanced Smoothing Averages
Overview:
RSI-Gringo is an advanced technical indicator that combines the concept of the Stochastic RSI with multiple smoothing options using various moving averages. It is designed for traders seeking greater precision in momentum analysis, while offering the flexibility to select the type of moving average that best suits their trading style.
Disclaimer: This script is not investment advice. Its use is entirely at your own risk. My responsibility is to provide a fully functional indicator, but it is not my role to guide how to trade, adjust, or use this tool in any specific strategy.
The JMA (Jurik Moving Average) version used in this script is a custom implementation based on publicly shared code by TradingView users, and it is not the original licensed version from Jurik Research.
What This Indicator Does
RSI-Gringo applies the Stochastic Oscillator logic to the RSI itself (rather than price), helping to identify overbought and oversold conditions within the RSI. This often leads to more responsive and accurate momentum signals.
This indicator displays:
%K: the main Stochastic RSI line
%D: smoothed signal line of %K
Upper/Lower horizontal reference lines at 80 and 20
Features and Settings
Available smoothing methods (selectable from dropdown):
SMA — Simple Moving Average
SMMA — Smoothed Moving Average (equivalent to RMA)
EMA — Exponential Moving Average
WMA — Weighted Moving Average
HMA — Hull Moving Average (manually implemented)
JMA — Jurik Moving Average (custom approximation)
KAMA — Kaufman Adaptive Moving Average
T3 — Triple Smoothed Moving Average with adjustable hot factor
How to Adjust Advanced Averages
T3 – Triple Smoothed MA
Parameter: T3 Hot Factor
Valid range: 0.1 to 2.0
Tuning:
Lower values (e.g., 0.1) make it faster but noisier
Higher values (e.g., 2.0) make it smoother but slower
Balanced range: 0.7 to 1.0 (recommended)
JMA – Jurik Moving Average (Custom)
Parameters:
Phase: adjusts responsiveness and smoothness (-100 to 100)
Power: controls smoothing intensity (default: 1)
Tuning:
Phase = 0: neutral behavior
Phase > 0: more reactive
Phase < 0: smoother, more delayed
Power = 1: recommended default for most uses
Note: The JMA used here is not the proprietary version by Jurik Research, but an educational approximation available in the public domain on TradingView.
How to Use
Crossover Signals
Buy signal: %K crosses above %D from below the 20 line
Sell signal: %K crosses below %D from above the 80 line
Momentum Strength
%K and %D above 80: strong bullish momentum
%K and %D below 20: strong bearish momentum
With Trend Filters
Combine this indicator with trend-following tools (like moving averages on price)
Fast smoothing types (like EMA or HMA) are better for scalping and day trading
Slower types (like T3 or KAMA) are better for swing and long-term trading
Final Tips
Tweak RSI and smoothing periods depending on the time frame you're trading.
Try different combinations of moving averages to find what works best for your strategy.
This indicator is intended as a supporting tool for technical analysis — not a standalone decision-making system.

Daksh RSI POINT to ShootHere are the key points and features of the Pine Script provided:
### 1. **Indicator Settings**:
- The indicator is named **"POINT and Shoot"** and is set for non-overlay (`overlay=false`) on the chart.
- `max_bars_back=4000` is defined, indicating the maximum number of bars that the script can reference.
### 2. **Input Parameters**:
- `Src` (Source): The price source, default is `close`.
- `rsilen` (RSI Length): The length for calculating RSI, default is 20.
- `linestylei`: Style for the trend lines (`Solid` or `Dashed`).
- `linewidth`: Width of the plotted lines, between 1 and 4.
- `showbroken`: Option to show broken trend lines.
- `extendlines`: Option to extend trend lines.
- `showpivot`: Show pivot points (highs and lows).
- `showema`: Show a weighted moving average (WMA) line.
- `len`: Length for calculating WMA, default is 9.
### 3. **RSI Calculation**:
- Calculates a custom RSI value using relative moving averages (`ta.rma`), and optionally uses On-Balance Volume (`ta.obv`) if `indi` is set differently.
- Plots RSI values as a green or red line depending on its position relative to the WMA.
### 4. **Pivot Points**:
- Utilizes the `ta.pivothigh` and `ta.pivotlow` functions to detect pivot highs and lows over the defined period.
- Stores up to 10 recent pivot points for highs and lows.
### 5. **Trend Line Drawing**:
- Lines are drawn based on pivot highs and lows.
- Calculates potential trend lines using linear interpolation and validates them by checking if subsequent bars break or respect the trend.
- If the trend is broken, and `showbroken` is enabled, it draws dotted lines to represent these broken trends.
### 6. **Line Management**:
- Initializes multiple lines (`l1` to `l20` and `t1` to `t20`) and uses these lines for drawing uptrend and downtrend lines.
- The maximum number of lines is set to 20 for uptrends and 20 for downtrends, due to a limit on the total number of lines that can be displayed on the chart.
### 7. **Line Style and Color**:
- Defines different colors for uptrend lines (`ulcolor = color.red`) and downtrend lines (`dlcolor = color.blue`).
- Line styles are determined by user input (`linestyle`) and use either solid or dashed patterns.
- Broken lines use a dotted style to indicate invalidated trends.
### 8. **Pivot Point Plotting**:
- Plots labels "H" and "L" for pivot highs and lows, respectively, to visually indicate turning points on the chart.
### 9. **Utility Functions**:
- Uses helper functions to get the values and positions of the last 10 pivot points, such as `getloval`, `getlopos`, `gethival`, and `gethipos`.
- The script uses custom logic for line placement based on whether the pivots are lower lows or higher highs, with lines adjusted dynamically based on price movement.
### 10. **Plotting and Visuals**:
- The main RSI line is plotted using a color gradient based on its position relative to the WMA.
- Horizontal lines (`hline1` and `hline2`) are used for visual reference at RSI levels of 60 and 40.
- Filled regions between these horizontal lines provide visual cues for potential overbought or oversold zones.
These are the main highlights of the script, which focuses on trend detection, visualization of pivot points, and dynamic line plotting based on price action.

RSI Dashboard Monitor [Skiploss]RSI Dashboard Monitor is indicator for scanner Relative Strength Index ( RSI ) for 4 symbols and 10 Timeframe, detached from the main chart.
You can choose to display all 4 symbols or just 1 symbol, also can choose resolution (TF). Still, these 10 timeframes should be enough to use. Default is set to 14 but you can modify it from settings.
How it work??
RSI >= 75 : Fill color maximum overbought
RSI >= 65 : Fill color medium overbought
RSI >= 55 : Fill color minimum overbought
RSI >= 45 : Fill color minimum overbought
RSI >= 35 : Fill color medium overbought
RSI >= 25 : Fill color maximum overbought
** Values level and color style can modify it from settings

3 Seas RSI Wave OscillatorTraditional Triple RSI Oscillator combining a Fast, Normal, and Slow RSI to achieve high accuracy entry and exit strategies. This indicator is UNIQUE because it uses a mathematical filter to trim false signals from the RSI, thus creating a reliable RSI driven entry and exit indicator represented by red and green arrows. For additional functionality divergences are identified and live plotted. UNIQUELY Alongside the 0 axis an OBV function is charted relative to the RSI to allow OBV and RSI divergences to be observed on equal mathematical scales, this is exceedingly useful to observe relative strength at pools of liquidity. The three main configured RSI's are also plotted for traditional usage case but can be removed.
Green arrow indicates a Buy opportunity optimized for standard Dollar Cost Averaging strategies.
Red arrow indicates a Sell opportunity optimized for standard Dollar Cost Averaging strategies.
Not Financial Advice.
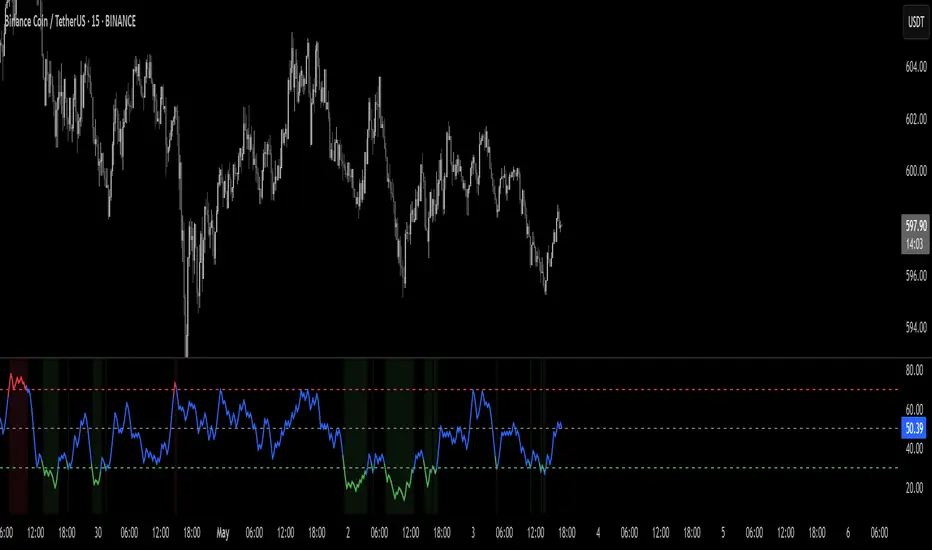
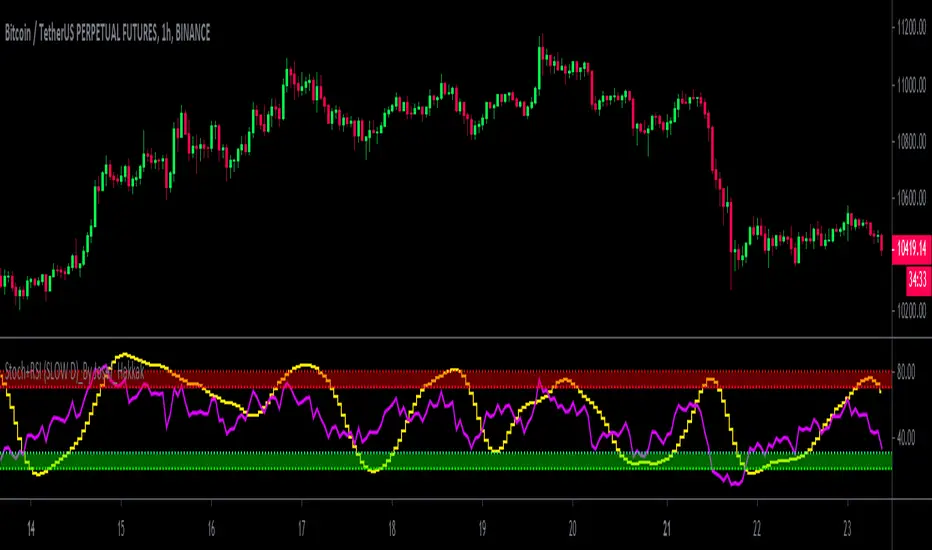
Stoch+RSI (SLOW D)_By Josef_HakkakStoch+RSI (SLOW D)_By Josef_Hakkak
Stochastic and RSI by SLOW D%
-> How to use:
B UY = When the yellow line (D of Slow Stoch ) goes out of the green range, it is better that the purple line ( RSI ) is be low
SELL = When the yellow line (D of Slow Stoch ) goes out of the red range, it is better to have the purple line ( RSI ) is be high
This script was previously written by RRanjanFX and has now been edited by me and changes have been made to optimize for shorter timeframes.
Edited and updated and optimized from:
RRanjanFX
Many thanks and loyal to RRanjanFX
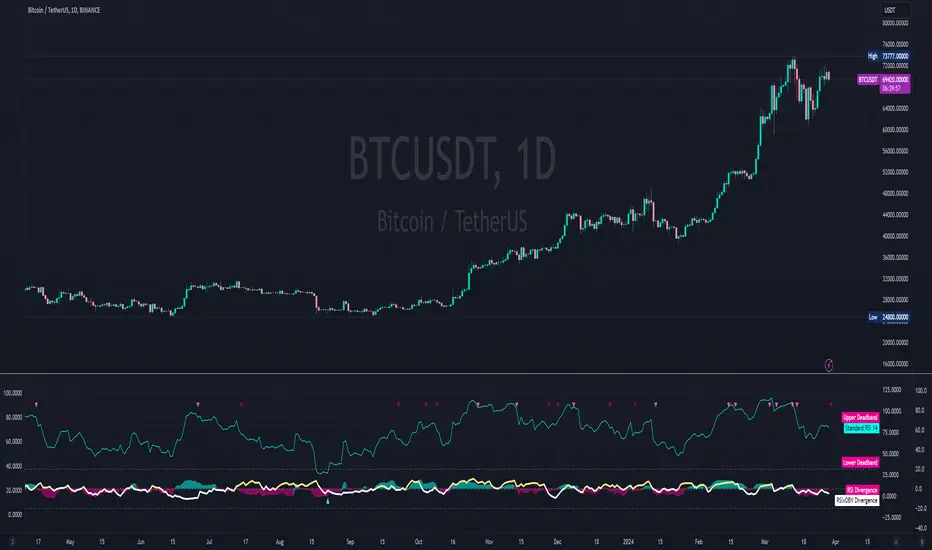
RSI + Psy + ADX P2RSI + Psy + ADX
This indicator combines multi-length RSI analysis with the Psychological Line (PSY) and ADX trend strength to highlight reversal zones, emotional extremes, and trend conditions in a single unified panel.
🔹 Features
1️⃣ Triple RSI with Dynamic Colors
Displays Short / Mid / Long RSI values (9 / 26 / 52 by default)
Line color changes based on RSI levels:
🔴 Overbought (above 68)
🟢 Oversold (below 32)
⚪ Neutral market conditions
Fixed zone levels at 70 / 50 / 30 for simple visual analysis
2️⃣ Psychological Line (PSY) Extreme Signal
Measures the percentage of bearish candles in the selected period
Only highlights emotional extremes (overbought & oversold conditions)
Red/Green histogram makes market sentiment easy to read
3️⃣ ADX Trend Strength Detector
Confirms trend momentum using ADX
Color-coded levels:
🔵 Weak trend
🟡 Moderate trend
🔴 Strong trend (possible trend continuation)
Helps avoid counter-trend trades during strong momentum
4️⃣ RSI Background Highlight (Mid-term RSI Only)
Background turns RED in overbought area
Background turns GREEN in oversold area
Provides fast and clean recognition of reversal zones
🎯 Best Uses
Identifying low-risk reversal entry zones
Avoiding entries against strong trends
Confirming momentum and sentiment alignment
Useful for scalping, day-trading, and swing-trading strategies
💡 Tip
For higher precision, combine this indicator with:
🔹 Support/Resistance Levels
🔹 Candlestick Reversal Patterns
🔹 Volume Spikes or Breakout Tools

RSI Risk | AlgoFy TraderRSI Risk | AlgoFy Trader
Overview
The RSI Risk | AlgoFy Trader is a trading system that combines RSI-based entry signals with automated capital management. This strategy identifies potential momentum shifts while controlling risk through calculated position sizing.
Key Features
Dynamic Risk Management:
Fixed Risk Per Trade: Users set maximum risk percentage per trade.
Automatic Position Sizing: Calculates position size based on stop-loss distance.
Capital Protection: Limits each trade's risk to user-defined percentage.
RSI Entry System:
Momentum Detection: Uses RSI crossovers above/below defined thresholds.
Clear Signals: Provides long/short entries on momentum transitions.
Multiple Exit Layers:
Dynamic Stop Loss: Stop based on recent price structure.
Fixed Safety Stop: Optional percentage-based stop loss.
Partial Take Profit: Optional early profit-taking.
Trailing Stop: Optional dynamic profit protection.
Performance Tracking:
Trade Statistics: Tracks win/loss streaks and performance metrics.
Monthly Dashboard: Shows monthly/yearly P&L with equity views.
Trade Details: Displays risk percentage and position size.
How It Works
Signal Detection: Monitors RSI for crossover events.
Risk Calculation: Determines stop-loss based on recent volatility.
Position Sizing: Calculates exact position to match risk percentage.
Example:
Account: $10,000 | Risk: 2% ($200 max)
Stop loss at 4% distance
Position size: $5,000
Result: 4% loss on $5,000 = $200 (2% of account)
Recommended Settings
Risk: 1-2% per trade
Enable fixed stop at 3-4%
Consider trailing stop activation
This script provides disciplined RSI trading with automated risk control, adjusting exposure while maintaining strict risk limits.

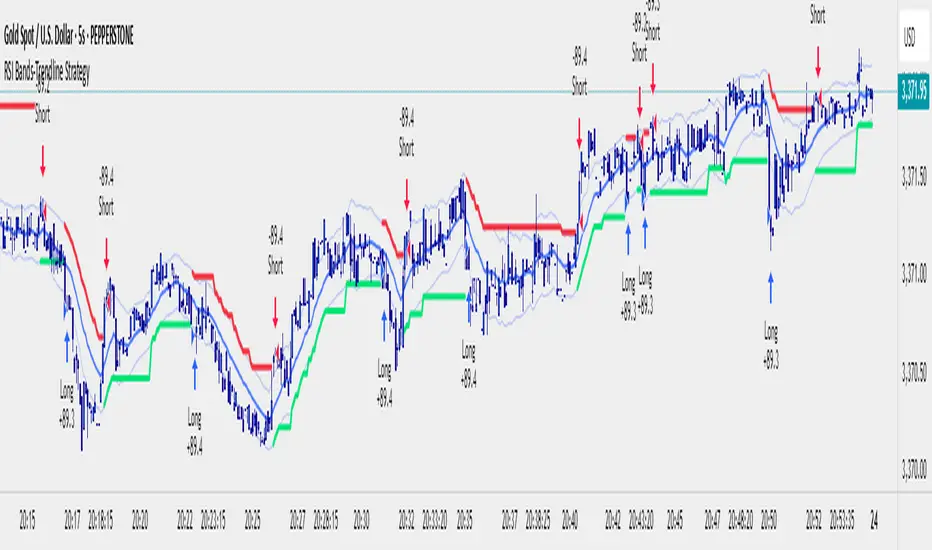
RSI Bands With RSI - ATR Trend StrategyRSI Bands With RSI-ATR Trend Line Strategy
Overview
A trend-following strategy that combines RSI regime detection with a smoothed baseline and ATR bands. Works similar to Supertrend: the line flips bullish or bearish only when price closes beyond the band, aiming to filter noise and catch clean moves.
How It Works
RSI above 50 = bullish bias, below 50 = bearish bias
A dynamic baseline is calculated from RSI and price range, then smoothed
ATR bands expand/contract with volatility
Close above the upper band → bullish flip → long entry
Close below the lower band → bearish flip → short entry
Between bands → prior trend continues
Features
Automatic Buy/Sell entries on confirmed flips
Configurable RSI, Smoothing, ATR, and Multiplier inputs
Visual trend line (green = bull, red = bear)
Backtest ready with initial capital and commission settings
Best Use Cases
Trending markets across Forex, Crypto, Indices, Commodities
Works on multiple timeframes (higher TFs = cleaner flips)
Flexible settings for conservative swing trading or aggressive scalping
⚠️ For testing/education only. Always manage risk and confirm with higher-timeframe or structure filters.
RSI + MACD Long-Only StrategyRSI + MACD Long-Only Strategy
Overview: Momentum-based, long-only strategy combining RSI and MACD. Entries favor upside momentum; exits trigger on momentum fades or risk targets. Signals are state-gated so you get one exit per entry (no multiple exits without a prior entry).
Entry conditions:
RSI crosses above the midline (default 50) while MACD is bullish (MACD > Signal, optionally MACD > 0), OR
MACD crosses above its Signal while RSI is at/above the midline.
Optional filters:
EMA trend filter: only enter if price > EMA(n).
Oversold context: only enter within N bars after RSI dipped below the oversold threshold.
Exit conditions:
RSI crosses below the midline, OR
MACD crosses below its Signal with MACD histogram ≤ 0.
Optional risk exit: Take Profit / Stop Loss based on percentage from average entry price.
Risk management:
Inputs: Use TP/SL (on/off), TP% (default 3.0), SL% (default 1.5).
Implements protective strategy.exit (limit/stop) while in position.
Signal-based exit uses strategy.close to flatten.
Position management:
Long-only, no pyramiding (single position at a time).
Internal state ensures entries occur only when flat and exits only when in a position.
Inputs you can tune:
RSI: length, overbought, oversold, midline.
MACD: fast length, slow length, signal length; toggle “Require MACD > 0”.
Signals: oversold lookback window; EMA trend on/off and EMA length.
Risk: TP% and SL%.
Visuals: show entry/exit markers, bar coloring; optional debug background on raw triggers.
Visuals and alerts:
Plots EMA (optional), draws entry/exit markers, optional bar coloring, and a faint background on raw long triggers to aid tuning.
Alert conditions provided for entries and exits.
Notes:
Designed for bar-close evaluation; performance varies by symbol/timeframe—tune inputs accordingly.
Long-only; intended for trend-following momentum with basic risk control.
Not financial advice.

RSI, CCI, ADX Panel (Custom TF for Each)RSI, CCI, and ADX Combined – Multi-Timeframe, Fully Customizable Panel Indicator for TradingView
Overview
This Pine Script indicator integrates the Relative Strength Index (RSI), Commodity Channel Index (CCI), and Average Directional Index (ADX) into a single, clean panel for effortless technical analysis. Each indicator operates independently, with customizable length, smoothing, and time frame for maximum flexibility. Traders can now monitor momentum, trend strength, and overbought/oversold conditions across different time frames—all in one place.
Key Features
Independent Controls: Set length, smoothing (ADX), and time frame individually for each indicator via the settings panel.
Multi-Timeframe Support: Each oscillator (RSI, CCI, ADX) can be calculated on its own time frame, enabling nuanced inter-timeframe analysis.
Customizable Visualization: Adjust line color and thickness for each indicator to match your chart style.
Clean, Non-Overlay Display: All three indicators are plotted in a dedicated panel beneath the price chart, reducing clutter.
Reference Levels: Includes standard reference lines for oversold/overbought (RSI, CCI) and trend threshold (ADX) for quick visual cues.
Usage Ideas
Swing Trading: Compare short- and long-term momentum using different time frames for RSI, CCI, and ADX.
Trend Confirmation: Use ADX to filter RSI and CCI signals—only trade overbought/oversold conditions during strong trends.
Divergence Hunting: Spot divergences between time frames for early reversal signals.
Scalping: Set RSI and CCI to lower time frames for entry, while monitoring higher timeframe ADX for trend context.
How to Install
Paste the script into the Pine Editor on TradingView.
Add to chart. Adjust settings as desired.
Save as a template for quick reuse on any chart—all your custom settings will be preserved.
Customization
Edit lengths and time frames in the indicator’s settings dialog.
Toggle reference lines on/off as needed.
Fine-tune line appearance (color, thickness) for clarity.
Note:
This indicator does not provide automated buy/sell signals. It is a customizable analytical tool for manual or semi-automated trading. Use in combination with other technical or fundamental analysis for best results.
Combine Momentum, Trend, and Volatility—Seamlessly and Visually—With One Indicator.

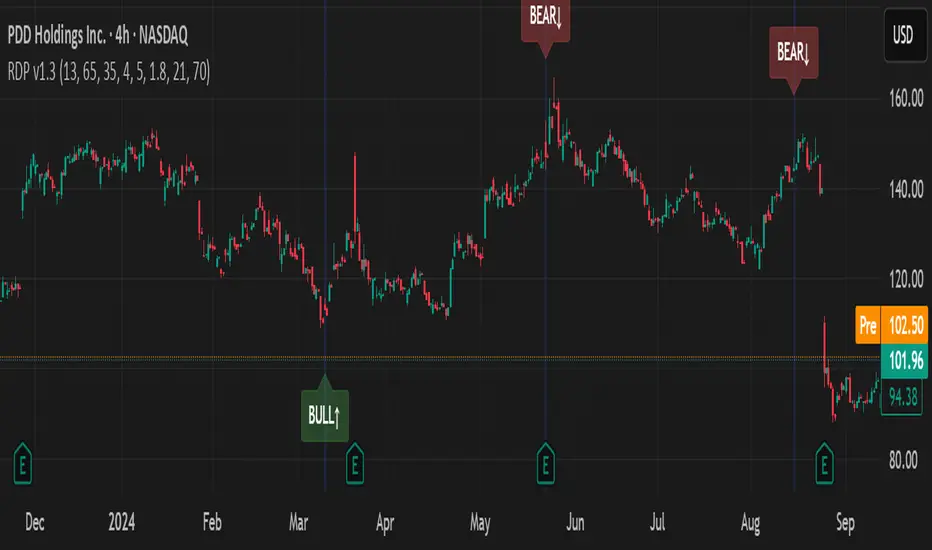
RSI Divergence Pro+ VolumeRSI Divergence Pro+ Volume
What It Does:
RSI Divergence Pro+ Volume is a non-repainting indicator that helps traders spot potential bullish and bearish reversal zones using a classic technical analysis concept—RSI divergence—combined with advanced volume confirmation. The script highlights moments when price and RSI disagree, filtering for signals only when there is a significant volume spike, which helps reduce false positives in quiet or illiquid markets.
How It Works:
Bullish Divergence: Triggered when price makes a lower low but RSI forms a higher low, suggesting possible exhaustion in selling pressure.
Bearish Divergence: Triggered when price makes a higher high but RSI forms a lower high, signaling potential buying exhaustion.
Volume Confirmation: Signals only appear when trading volume exceeds a dynamic threshold (based on a user-defined moving average and multiplier), making alerts more reliable.
Visual Features: Customizable labels and optional gradient highlights mark the exact bars where divergence with volume confirmation occurs, making signals easy to see.
Alert System: Built-in alerts for both bullish and bearish divergences so traders can receive instant notifications.
How to Use:
Apply the script to any timeframe or liquid asset (15m–4H recommended for best results).
Watch for green “BULL↑” labels below bars (bullish divergence) and red “BEAR↓” labels above bars (bearish divergence).
Blue/violet background highlights confirm volume-verified signals.
Combine with your own risk management and confirmation tools for trade entries/exits.
Adjust lookback and volume settings to match your asset and style.
Originality & Usefulness:
This indicator stands out by combining traditional RSI divergence with advanced volume filtering, giving more credible and actionable reversal alerts. All logic is non-repainting and calculated on closed bars only. Settings are fully grouped and customizable, with professional visuals for clarity.
Limitations & Disclaimers:
Not every divergence results in a major reversal—use with other analysis.
More effective in trending or volatile markets; may produce more false signals in choppy/range conditions.
Signals are generated on bar close and do not repaint.
No indicator is a substitute for proper trading discipline and risk management.
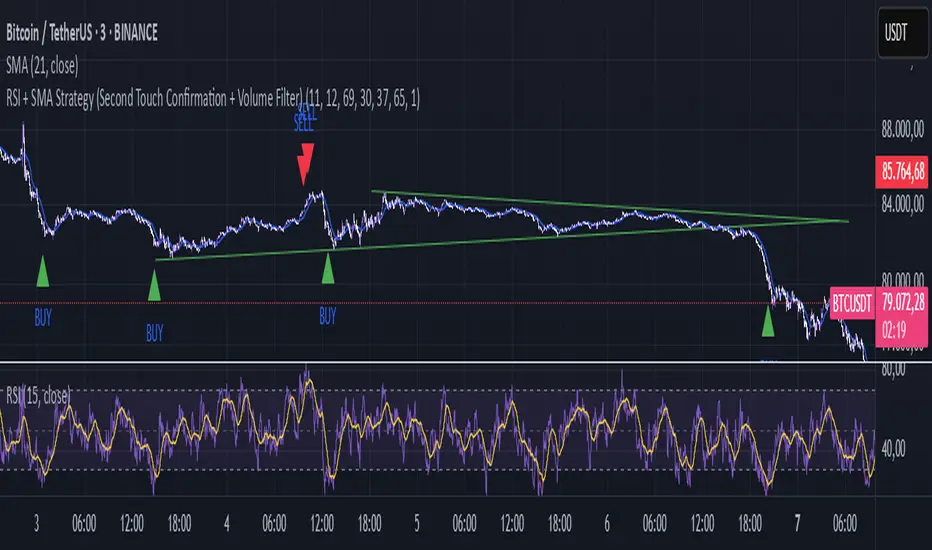
RSI + SMA Strategy (Second Touch Confirmation + Volume Filter)RSI + SMA Strategy (Second Touch Confirmation + Volume Filter)
👉 Optimized for the 3-minute timeframe
This indicator combines the power of the RSI (Relative Strength Index) and its SMA (Simple Moving Average) to generate highly reliable BUY and SELL signals. The strategy is designed to confirm signals only on the second consecutive touch of the overbought (70) and oversold (30) thresholds, reducing false signals caused by sudden market movements. Additionally, it includes a dynamic volume filter, ensuring that signals are generated only during periods of high liquidity.
Key Features
Second Touch RSI:
BUY and SELL signals are generated only after the RSI reaches the overbought/oversold threshold for the second consecutive time, improving accuracy.
Volume Filter:
Signals are confirmed only if the current volume exceeds the 20-period moving average multiplied by a configurable value (volume_multiplier), filtering out low-liquidity moments.
Optimized for Short Timeframes:
Perfect for the 3-minute timeframe, ideal for scalping and intraday trading strategies.
Customizable Parameters:
Adjustable settings for RSI, SMA, overbought/oversold thresholds, and volume filter, making it adaptable to various markets and conditions.
How to Use It
BUY Signal: When RSI touches the oversold threshold (30) for the second consecutive time and crosses above its SMA, with volume higher than average.
SELL Signal: When RSI touches the overbought threshold (70) for the second consecutive time and crosses below its SMA, with volume higher than average.
Upcoming Developments
📢 We will soon release our private strategy!
This strategy will be based on advanced logic and optimized to achieve even more consistent results in volatile markets like cryptocurrencies. Stay tuned for more details!
Disclaimer
This indicator is designed to support decision-making in trading. We recommend testing it on a demo account before using it in live trading. Remember that trading involves risks and does not guarantee profits.
BUY/SELL RSI FLIUX v1.0The "BUY/SELL RSI FLUX v1.0" indicator is designed to provide buy and sell signals based on the RSI (Relative Strength Index) and price action in relation to support and resistance levels. It overlays directly on the price chart and includes the following components:
- Support and Resistance Levels: Determined over a specified number of bars (lengthSR), these levels represent potential barriers where price action may stall or reverse.
- ATR (Average True Range): Used to measure market volatility. While it's calculated in the script, it's not visualized on the chart as per the latest modification.
- RSI: The RSI is calculated over a defined period (lengthRSI) and is used to identify overbought or oversold conditions. Buy signals are generated when the RSI is below the oversold threshold (rsiOversold) and the price is above the support level. Conversely, sell signals occur when the RSI is above the overbought threshold (rsiOverbought), the price is below the resistance level, and additionally, the price is below a long-term moving average, which acts as a trend filter.
- Long-Term Moving Average: This moving average is plotted to help identify the prevailing market trend. Sell signals are filtered based on the price's position in relation to this moving average.
- Buy/Sell Signals: Visual representations in the form of shapes are plotted below (for buy) or above (for sell) the price bars to indicate potential entry points.
By combining these elements, the indicator aims to provide high-probability trading signals that align with both the market's momentum and trend.

RSI Double DeckerRSI Double Decker is simple combination of 2 RSI
We have used double RSI -5 period and 14 period ,timeframe used is one hour ,timeframe can be modified as per your strategy
this indicator helps you to stay away when its sideways
BUY- when 5 period RSI crosses above 14 period RSI rsi14 > 50 and rsi5 >70
SELL-when 5 period RSI crosses below 14 period RSI rsi14 <50 and rsi5 <30
this indicator was build from inspiration by -twitter/technovestor - Vivek Gadodia

DW-RSI EMA with EMA of RSIThis is an RSI Oscillator with an EMA of the RSI for a signal line. The RSI line is Green when above the signal line and Red when below the signal line.
This does not use the traditional 30% / 70% over sold / over bought analysis. Therefore the levels are not shown.
The analysis is this:
When the RSI is above the signal line then price has a bullish bias.
When the RSI is below the signal line then price has a bearish bias.
I wrote use this for Forex Spot Currencies where I feel overbought and oversold may be less valid than it may be in other markets such as stocks.
As with all indicators, do not use as your sole reason to enter the market, but use with other indicators or price action signals to get a confluence of signals to confirm your entry.
I use it with an 8, 21 and 50 EMA to confirm entry and exit. I give it more weight for exits than I do for entries.

RSI with Visual Buy/Sell Setup | Corrective/Impulsive IndicatorRSI with Visual Buy/Sell Setup | 40-60 Support/Resistance | Corrective/Impulsive Indicator v2.15
|| RSI - The Complete Guide PDF ||
Modified Zones with Colors for easy recognition of Price Action.
Resistance @ downtrend = 60
Support @ uptrend = 40
Over 70 = Strong Bullish Impulse
Under 30 = Strong Bearish Impulse
Uptrend : 40-80
Downtrend: 60-20
--------------------
Higher Highs in price, Lower Highs in RSI = Bearish Divergence
Lower Lows in price, Higher Lows in RSI = Bullish Divergence
--------------------
Trendlines from Higher/Lower Peaks, breakout + retest for buy/sell setups.
###################
There are multiple ways for using RSI, not only divergences, but it confirms the trend, possible bounce for continuation and signals for possible trend reversal.
There's more advanced use of RSI inside the book RSI: The Complete Guide
Go with the force, and follow the trend.
"The Force is more your friend than the trend"
