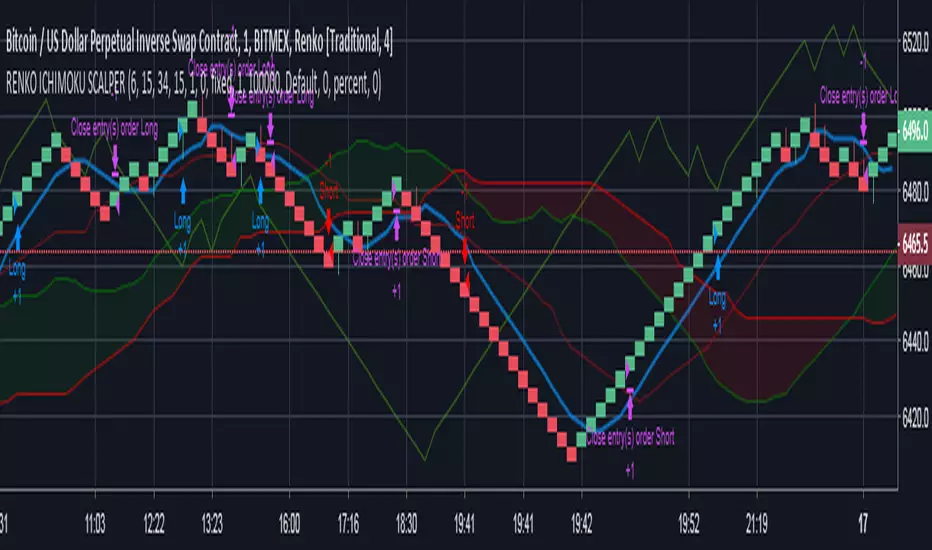
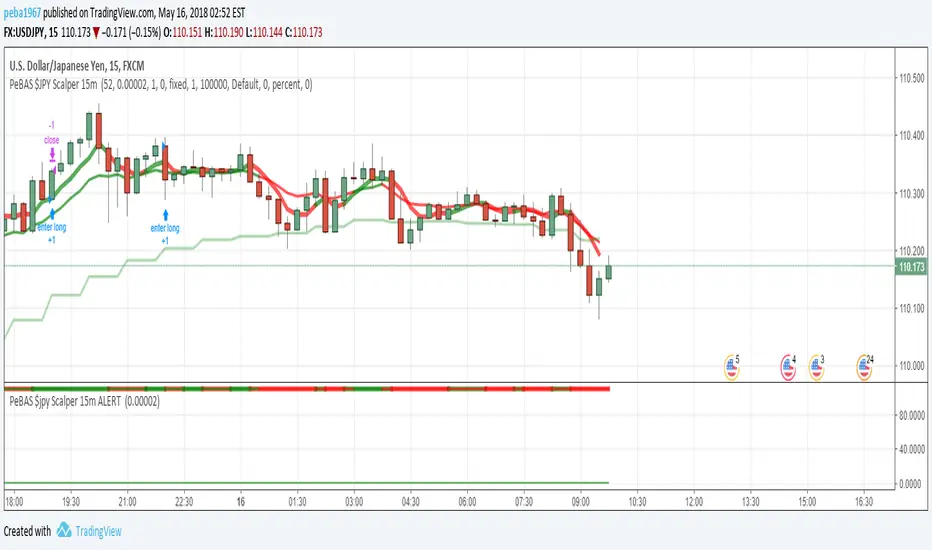
WH TrendTrend recognition channel, supports and resistances adjustable by desired time frame, adjustable scalper with long and short signals, adjustable recommended take profit points. Alerts can be set for every important aspect
Pairs very well with the modified WH RSI and Stoch pictured.
Will be up for a short while to test
ابحث في النصوص البرمجية عن "scalp"

5e_ CaptainBB w/mo-Alertswith the setups of bollinger and cap bands alongside multiple oscialltor alerts we can see how the mixture of the 3 work on the 2h ethereum chart.
basic rule is if the trend breaches the bollinger and cap band and the oscialltors agree then it is a buy/sell opportunity depending on where the break is made (upper would be sell, lower would be buy).
a cross over of the mid bband (21 ema ) below the mid cap band suggests the trend is negative = short, likewise a cross above the mid cap band suggests the trend is positive = long
watch for rejection around the mid bands area and be prepared to cut long/short early if rejection is seen.
best way to enter the trade is on confirmation and waiting for the price to find support inside the bands, fibonnaci will aid this too.
last tip is to use the daily pivot ; P, R and S to gauge knife catches, targets etc.
be wary on lower time-frames as signals will paint correctly but could be short lived on the chart (and fail without SL or TP).
used with heikin ashi will produce more signals.
using bars will produce the signals shown and color code the trend the best - authors favourite.
candles have same view as bars only colours seem weird.
^^up to you.
FYI bollinger basis is 21ma (not standard 20).
adjust colors to suit and reduce noise. for example dim the vertical bars as they are more for intra-channel scalping
//credit to ChartArt, CapnOscar and Hinco01 for their coding//

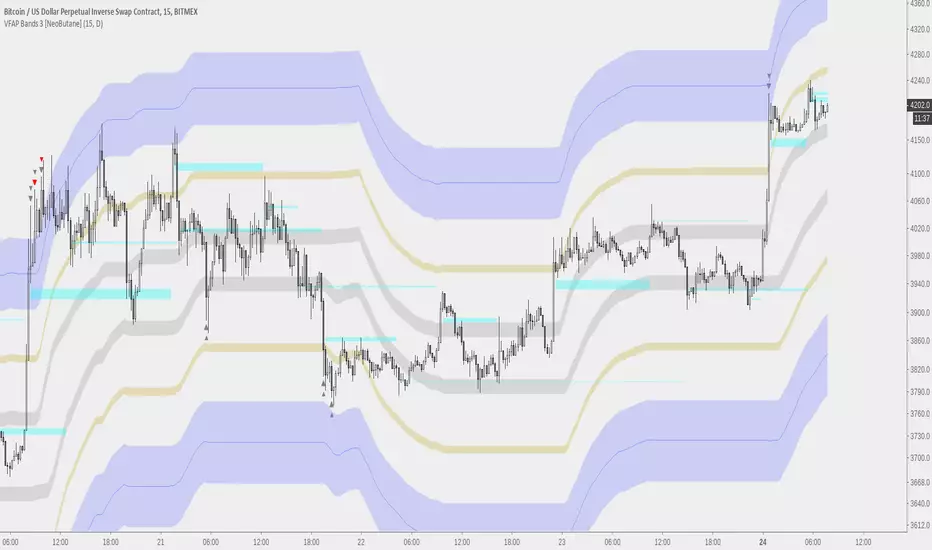
MVWAP Scalper Prototype [NeoButane]This is a tool that is best utilized on timeframes under 30 minutes.
Besides the MVWAP, the horizontal levels provide support/resistance and shows a 'magnet' to where price might go again.
SMA_CrossThis strategy is a variation of standard sma cross that comes as default with pine script
The idea is to NOT wait for a cross between fast and slow moving averages but to anticipate it considering the distance between the two MAs
Strategy can be used also for scalping, just need to be optimized for low tiime frames as 1 minute or 5 minute.
TIP: stay far from resistance and supports. I use my script "LCS/HCR Support and Resistance multi timeframes" to easily identify major supports
and resistance areas (note that I said areas and not lines).
Thanks to ChrisMoody: I used his code snippet for switching between various moving average types and calculation of TEMA and HULL ma.
Next improvements:
- money managment
- self optimization
- convert to study with alerts
This strategy is free to use but code is private. If you like or have question please use comment section.
Check also my other scripts at www.tradingview.com .
Thanks for your feedbaks.
CryptoCaptain 15M ScalperAfter huge success in CryptoCaptain AI 4H Swing trade indicator ,
My group requested me to make a scalping indicator.
Here is the masterpiece.
No repaints guaranteed.
PS: Its not free.
Always trade with StopLoss.
CryptoCaptain 0_0
Works best on bitfinex 15m chart.
Leave a comment if you want to try. Temporary trial is legit.
Checkout my 4H swing indicator :

BitSinais - Simple version of our indicatorSimple indicator with arrows pointing long or short entries.
Works on low time frames for scalping as well as on bigger time frames for position.
It's part of our trading bot. (in development)
Private use. To get access, send me a private message and we can talk about.
//
Versão simples do nosso inicador, com setas indicando entradas long ou short.
Funciona em tempos mais curtos para scalp e em tempos mais longos para position.
É parte do nosso bot, que ainda está em desenvolvimento.
Uso privado. Para ter acesso, me envie uma mensagem no chat privado.

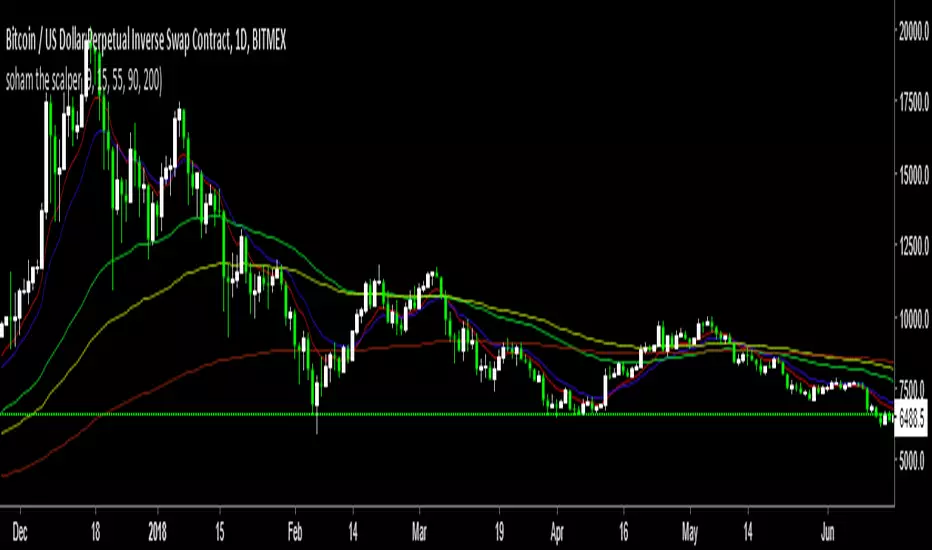
soham the scalperMultiple Ema you can use this is for scalp in any timeframe you want.
and also you can this ema with "laguerre based-rsi" so you can find clear buy and sell signals.
if you want beauty on chart then go with Guppy ema xD
if you guys need access just Dm me its free..
Shinkansen EMA ScalperRed = Last 8 Candle Support
Green = Last 8 Candle Resistant
Blue line is EMA
I'm glad if you happy to using this indicator and take more profit from scalp :D

Shinkansen SAR ScalperRed = Last 8 Candle Support
Green = Last 8 Candle Resistant
Blue line is Parabolic SAR
I'm glad if you happy to using this indicator and take more profit from scalp :D

JustHung EMA Scalper update
This is a recent update of the 20-cycle EMA scenario combined with the highest and lowest prices for a good support and resistance.
In this chart I push the EMA price at high and low to get points to buy and sell earlier, combined with the color of the body of the change when the RSI is over 70 or below 30 to maximize profit.
Should use reasonable stop loss.
Good luck!


Godmode 3.1.4 - SNOW_CITY SCALPER EDITION - 7/2017 Updates to xSilas Godmode Oscillator published December 19th, 2014
Thanks to LEGION, LAZYBEAR, Ni6HTH4wK, xSilas
Updates:
Changed default sources to include BITSTAMP and REMOVED BTC-e
Changed default lengths for SCALPING SUPREMACY - See Instructions
Changed "Caution dots" to RED because YELLOW was hard to see.
I mostly Ignore the oscillators and only use the caution dots with this configuration:
MOST EFFECTIVE USE: BITSTAMP:BTCUSD BITSTAMP:BTCUSD
- Use on 1m charts of your BITMEX swap, yes 1m. I know, but it works better this way. 5m and 15m work best when using on an exchange index.
- IF overall 2H trend is DOWN, the 1m godmode on swap CAUTION DOTS appear on the UPPER BOUNDS means good SHORT entry points, and the lower dots suggest a possible reversal and good exit opportunity (not always)
- If overall 2H trend is UP, the 1m godmode on swap CAUTION DOTS appear on the LOWER BOUNDS means good LONG entry points, and upper dots suggest possible oversold if they start to round over, again not always.
This is ultra simple, and very effective.
Default settings for VERY sensitive CAUTION DOT blop: 17,6,4
Use these settings for a slightly less sensitive CAUTION DOT blop: 14,12,9

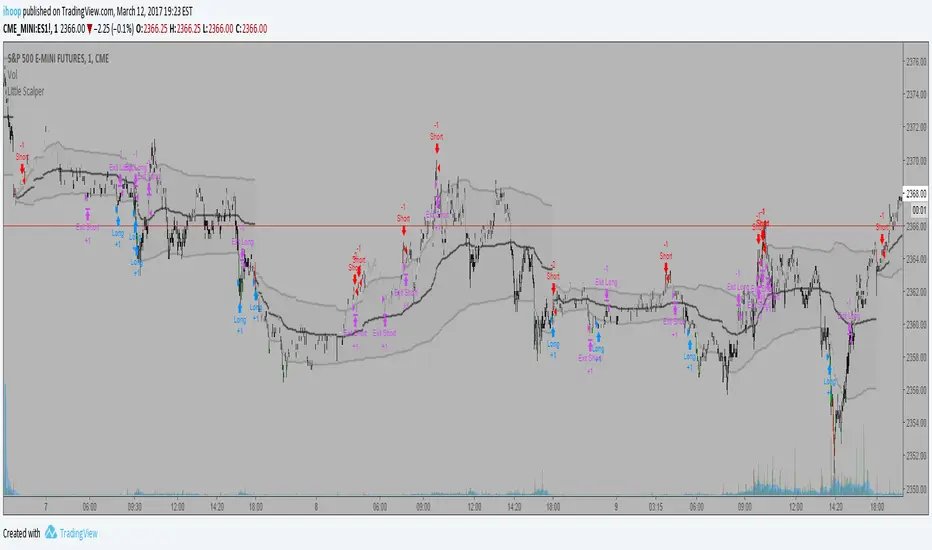
Little ScalperYet another script to scalp the ES......This script contains completely different algorithm than my "Bottom Feeder" scripts and seeks to take advantage of the great intraday tool known as VWAP as well as several other tools as filters. This strategy has the ability to go long or short, being almost equally profitable on trades from either side. While this script does has defined entries, exits, and profit targets, it does not have a defined stop loss. As with all my other scripts, this script DOES NOT repaint and can be used for live trading, albeit with caution since the exit criteria is relatively loose.
ATR ZigZag BreakoutATR ZigZag Breakout
This strategy uses my ATR ZigZag indicator (powered by the ZigZagCore library) to scalp breakouts at volatility-filtered highs and lows.
Everyone knows stops cluster around clear swing highs and lows. Breakout traders often pile in there, too. These levels are predictable areas where aggressive orders hit the tape. The idea here is simple:
→ Let ATR ZigZag define clean, volatility-filtered pivots
→ Arm a stop market order at those pivots
→ Join the breakout when the crowd hits the level
The key to greater success in this simple strategy lies in the ZigZag. Because the pivots are filtered by ATR instead of fixed bar counts or fractals, the levels tend to be more meaningful and less noisy.
This approach is especially suited for intraday trading on volatile instruments (e.g., NQ, GC, liquid crypto pairs).
How It Works
1. Pivot detection
The ATR ZigZag uses an ATR-based threshold to confirm swing highs and lows. Only when price has moved far enough in the opposite direction does a pivot become “official.”
2. Candidate breakout level
When a new swing direction is detected and the most recent high/low has not yet been broken in the current leg, the strategy arms a stop market order at that pivot.
• Long candidate → most recent swing high
• Short candidate → most recent swing low
These “candidate trades” are shown as dotted lines.
3. Entry, SL, and TP
If price breaks through the level, the stop order is filled and a bracket is placed:
• Stop loss = ATR × SL multiplier
• Take profit = SL distance × RR multiplier
Once a level has traded, it is not reused in the same swing leg.
4. Cancel & rotate
If the market reverses and forms a new swing in the opposite direction before the level is hit, the pending order is cancelled and a new candidate is considered in the new direction.
Additional Features
• Optional session filter for backtesting specific trading hours

Flow Rider Mother Candle Breakout Long Short indicator - ScalpOVERVIEW
// ═══════════════════════════════════════════════════════════
// 1. Detects HIGH VOLUME "Mother/Big" candles
// 2. Waits for 2+ INSIDE bars (consolidation)
// 3. Enters SHORT on bearish breakout below mother low Enters Long on bullish breakout above
// 4. Stop Loss: Highest point + 1.5x largest upper wick (default)
// 5. Targets: TP1 @ 0.618, TP2 @ 1.618 Fibonacci extensions

Trend BG v2Trend BG v2 colors the chart background based on Directional Movement (DM) and DI strength. It provides an easy visual way to identify trending and non-trending conditions on any timeframe.
How It Works
The script calculates:
Upward Directional Movement (DM+)
Downward Directional Movement (DM–)
True Range smoothed with RMA (14-period)
Positive DI and Negative DI values from classic ADX logic
The trend state is determined by comparing +DI vs –DI:
+DI > –DI → Uptrend
–DI > +DI → Downtrend
Otherwise → Neutral / Sideways
The script then applies a background color based on the detected trend.
Color transparency and theme can be adjusted using the input options.
Why This Script Is Useful
Instead of plotting DI lines or ADX curves, this version presents the trend directly on the background, making it ideal for:
Quick trend recognition
Visual filtering of choppy vs trending markets
Enhancing manual or automated setups
Intraday scalping, positional trend following, and multi-timeframe analysis
The background display is subtle, customizable, and does not interfere with other indicators on the chart.
Key Features
Trend-colored chart background (Up / Down / Neutral)
Adjustable color palette and transparency
Built using classic Directional Movement logic
Works on all markets and all timeframes
Lightweight and efficient (no repainting)
How to Use It
Apply the indicator on your chart and use the background colors to:
Align trades with the market trend
Avoid trading during neutral or low-momentum periods
Confirm trend direction before entries
Improve clarity when using your existing indicators
This indicator does not generate buy/sell signals by itself; instead, it helps visualize the underlying trend environment so traders can make more informed decisions.

Doctor Scalp (BUY/SELL) [by Adi]A script for fast scalping using. Works best with a 5-minute-to-1-hour interval.

XAUUSD Scalping 1min TFThis script is for use on the 1min timeframe, we are looking for quick scalp trades when price reverses from Highs or lows - when the shot fires taking a 1:2 Trade 500pips TP and 250pips SL

30M Scalping Strategy with Debug LogsWhat’s changed
Spot‑only: all short logic removed—only long entries and exits are generated.
Logging: uses log.info() to send entry/exit details (timestamp, price, ATR, RSI) to the Pine Logs console.
Clean & concise: core scalp logic (EMAs, RSI, MACD, volume, ATR SL/TP) remains intact.

AL Brooks - Price Action Multi-Signal Suite📘 Price Action Multi-Signal Suite📘
This indicator is a complete visual toolset for traders who use price action principles inspired by Al Brooks-style analysis.
It combines multiple nuanced signals — like first/second entries, breakout failures, trend bias, higher-timeframe context, and dynamic trend channels — into one elegant, customizable interface.
It is built with clarity, flexibility, and actionable precision in mind.
🧠 Core Concepts Behind the Tool
1. Trend Bias with EMA (20 by default)
The indicator calculates a standard EMA (default: 20) to establish trend direction bias.
When price is above EMA, we consider the market to be in a bull trend, and vice versa.
The EMA line changes color dynamically — green (bull), red (bear), gray (neutral).
🟢 Example:
If price is forming higher highs and staying above EMA with strong bull bars, the bias is bullish. In this phase, you're looking for High 1 and High 2 (H1/H2) setups.
2. First and Second Entries (H1/H2 and L1/L2)
High 1 (H1): First pullback in a bull trend after a minor new high.
High 2 (H2): A second attempt to push up after a failed H1.
Low 1 (L1) and Low 2 (L2): Mirror the above logic for bear trends.
📈 Example Trade – H2 Long:
Price breaks out above EMA.
Pulls back and forms an H1, but it fails to break out.
Second push (H2) forms a higher low, then closes strong above previous bar → BUY entry.
📉 Example Trade – L2 Short:
Market is below EMA.
A rally creates L1, fails.
L2 forms and closes below the previous bar low with a bear body → SELL entry.
3. Second Entry Logic (Simplified Swing Count)
This adds context to H2/L2 by ensuring at least two swings occurred in the same direction.
Reduces false signals in choppy markets.
Painted as colored circles (aqua = long, fuchsia = short).
4. Breakout Failure Detection
Detects false breakouts using 10-bar highs/lows:
Failed High Breakout: Price breaks a 10-bar high but closes back inside → potential reversal short.
Failed Low Breakout: Price breaks a 10-bar low but closes back inside → potential long.
🚨 Example:
Price breaks above a recent high but closes below it with a strong bear bar → look for reversal or fade setups.
5. Inside / Outside Bars
Helps recognize compression (inside bars) or volatility expansions (outside bars).
Inside bars often precede breakouts.
Outside bars may signal traps or indecision.
Use these in combination with entry logic. An H2 after an inside bar can signal a strong, clean breakout.
6. Higher Timeframe (HTF) Context
Pulls EMA and trend bias from a higher timeframe (default: 1hr).
Background color indicates HTF bias (adjustable opacity).
Green = HTF uptrend.
Red = HTF downtrend.
🧭 Usage: Trade in the direction of the HTF bias when possible. An H2 with HTF bias bullish adds confluence.
7. Trend Channels (Automatic, Visual)
Dynamically draws trend channel lines based on pivot highs/lows.
These act as support/resistance, visual guides for traps or continuation.
Trendline breakouts or touches often align with H2/L2 setups.
📏 Example:
Price touches lower channel and forms a second entry long (L2) with a strong bull bar → high-quality reversal trade.
⚙️ Customization Options
Toggle each signal component (entries, bias, bars, failures, channels).
Adjust EMA length, HTF resolution, background opacity.
Keep your chart clean and focused on the signals that matter to you.
📊 Trade Example Summary
H2 with HTF Bullish
Trade Setup: Strong bull bar after a failed H1, above EMA
Expected Move: Trend continuation upward
L2 with Channel Hit
Trade Setup: Pullback hits lower trend channel, forms L2
Expected Move: Reversal or scalp down
Failed High Breakout
Trade Setup: Price breaks above a 10-bar high, but reverses and closes inside
Expected Move: Quick fade or reversal short
Inside Bar + H2
Trade Setup: Price compresses into an inside bar, followed by a breakout with H2
Expected Move: Momentum breakout trade
Outside Bar + L2
Trade Setup: Price breaks strongly in one direction (outside bar), second push fails upward, forms L2
Expected Move: Short on weakness
Please note, this is an educational idea and representation of whatever I understood of it.
Historical performances may not be replicable in present/future.
Trade at your own responsibility.
Regards! ^^
