SPX Weekly Expected Moves# SPX Weekly Expected Moves Indicator
A professional Pine Script indicator for TradingView that displays weekly expected move levels for SPX based on real options data, with integrated Fibonacci retracement analysis and intelligent alerting system.
## Overview
This indicator helps options and equity traders visualize weekly expected move ranges for the S&P 500 Index (SPX) by plotting historical and current week expected move boundaries derived from weekly options pricing. Unlike theoretical volatility calculations, this indicator uses actual market-based expected move data that you provide from options platforms.
## Key Features
### 📈 **Expected Move Visualization**
- **Historical Lines**: Display past weeks' expected moves with configurable history (10, 26, or 52 weeks)
- **Current Week Focus**: Highlighted current week with extended lines to present time
- **Friday Close Reference**: Orange baseline showing the previous Friday's close price
- **Timeframe Independent**: Works consistently across all chart timeframes (1m to 1D)
### 🎯 **Fibonacci Integration**
- **Five Fibonacci Levels**: 23.6%, 38.2%, 50%, 61.8%, 76.4% between Friday close and expected move boundaries
- **Color-Coded Levels**:
- Red: 23.6% & 76.4% (outer levels)
- Blue: 38.2% & 61.8% (golden ratio levels)
- Black: 50% (midpoint - most critical level)
- **Current Week Only**: Fibonacci levels shown only for active trading week to reduce clutter
### 📊 **Real-Time Information Table**
- **Current SPX Price**: Live market price
- **Expected Move**: ±EM value for current week
- **Previous Close**: Friday close price (baseline for calculations)
- **100% EM Levels**: Exact upper and lower boundary prices
- **Current Location**: Real-time position within the EM structure (e.g., "Above 38.2% Fib (upper zone)")
### 🚨 **Intelligent Alert System**
- **Zone-Aware Alerts**: Separate alerts for upper and lower zones
- **Key Level Breaches**: Alerts for 23.6% and 76.4% Fibonacci level crossings
- **Bar Close Based**: Alerts trigger on confirmed bar closes, not tick-by-tick
- **Customizable**: Enable/disable alerts through settings
## How It Works
### Data Input Method
The indicator uses a **manual data entry approach** where you input actual expected move values obtained from options platforms:
```pinescript
// Add entries using the options expiration Friday date
map.put(expected_moves, 20250613, 91.244) // Week ending June 13, 2025
map.put(expected_moves, 20250620, 95.150) // Week ending June 20, 2025
```
### Weekly Structure
- **Monday 9:30 AM ET**: Week begins
- **Friday 4:00 PM ET**: Week ends
- **Lines Extend**: From Monday open to Friday close (historical) or current time + 5 bars (current week)
- **Timezone Handling**: Uses "America/New_York" for proper DST handling
### Calculation Logic
1. **Base Price**: Previous Friday's SPX close price
2. **Expected Move**: Market-derived ±EM value from weekly options
3. **Upper Boundary**: Friday Close + Expected Move
4. **Lower Boundary**: Friday Close - Expected Move
5. **Fibonacci Levels**: Proportional levels between Friday close and EM boundaries
## Setup Instructions
### 1. Data Collection
Obtain weekly expected move values from options platforms such as:
- **ThinkOrSwim**: Use thinkBack feature to look up weekly expected moves
- **Tastyworks**: Check weekly options expected move data
- **CBOE**: Reference SPX weekly options data
- **Manual Calculation**: (ATM Call Premium + ATM Put Premium) × 0.85
### 2. Data Entry
After each Friday close, update the indicator with the next week's expected move:
```pinescript
// Example: On Friday June 7, 2025, add data for week ending June 13
map.put(expected_moves, 20250613, 91.244) // Actual EM value from your platform
```
### 3. Configuration
Customize the indicator through the settings panel:
#### Visual Settings
- **Show Current Week EM**: Toggle current week display
- **Show Past Weeks**: Toggle historical weeks display
- **Max Weeks History**: Choose 10, 26, or 52 weeks of history
- **Show Fibonacci Levels**: Toggle Fibonacci retracement levels
- **Label Controls**: Customize which labels to display
#### Colors
- **Current Week EM**: Default yellow for active week
- **Past Weeks EM**: Default gray for historical weeks
- **Friday Close**: Default orange for baseline
- **Fibonacci Levels**: Customizable colors for each level type
#### Alerts
- **Enable EM Breach Alerts**: Master toggle for all alerts
- **Specific Alerts**: Four alert types for Fibonacci level breaches
## Trading Applications
### Options Trading
- **Straddle/Strangle Positioning**: Visualize breakeven levels for neutral strategies
- **Directional Plays**: Assess probability of reaching target levels
- **Earnings Plays**: Compare actual vs. expected move outcomes
### Equity Trading
- **Support/Resistance**: Use EM boundaries and Fibonacci levels as key levels
- **Breakout Trading**: Monitor for moves beyond expected ranges
- **Mean Reversion**: Look for reversals at extreme Fibonacci levels
### Risk Management
- **Position Sizing**: Gauge likely price ranges for the week
- **Stop Placement**: Use Fibonacci levels for logical stop locations
- **Profit Targets**: Set targets based on EM structure probabilities
## Technical Implementation
### Performance Features
- **Memory Managed**: Configurable history limits prevent memory issues
- **Timeframe Independent**: Uses timestamp-based calculations for consistency
- **Object Management**: Automatic cleanup of drawing objects prevents duplicates
- **Error Handling**: Robust bounds checking and NA value handling
### Pine Script Best Practices
- **v6 Compliance**: Uses latest Pine Script version features
- **User Defined Types**: Structured data management with WeeklyEM type
- **Efficient Drawing**: Smart line/label creation and deletion
- **Professional Standards**: Clean code organization and comprehensive documentation
## Customization Guide
### Adding New Weeks
```pinescript
// Add after market close each Friday
map.put(expected_moves, YYYYMMDD, EM_VALUE)
```
### Color Schemes
Customize colors for different trading styles:
- **Dark Theme**: Use bright colors for visibility
- **Light Theme**: Use contrasting dark colors
- **Minimalist**: Use single color with transparency
### Label Management
Control label density:
- **Show Current Week Labels Only**: Reduce clutter for active trading
- **Show All Labels**: Full information for analysis
- **Selective Display**: Choose specific label types
## Troubleshooting
### Common Issues
1. **No Lines Appearing**: Check that expected move data is entered for current/recent weeks
2. **Wrong Time Display**: Ensure "America/New_York" timezone is properly handled
3. **Duplicate Lines**: Restart indicator if drawing objects appear duplicated
4. **Missing Fibonacci Levels**: Verify "Show Fibonacci Levels" is enabled
### Data Validation
- **Expected Move Format**: Use positive numbers (e.g., 91.244, not ±91.244)
- **Date Format**: Use YYYYMMDD format (e.g., 20250613)
- **Reasonable Values**: Verify EM values are realistic (typically 50-200 for SPX)
## Version History
### Current Version
- **Pine Script v6**: Latest version compatibility
- **Fibonacci Integration**: Five-level retracement analysis
- **Zone-Aware Alerts**: Upper/lower zone differentiation
- **Dynamic Line Management**: Smart current week extension
- **Professional UI**: Comprehensive information table
### Future Enhancements
- **Multiple Symbols**: Extend beyond SPX to other indices
- **Automated Data**: Integration with options data APIs
- **Statistical Analysis**: Success rate tracking for EM predictions
- **Additional Levels**: Custom percentage levels beyond Fibonacci
## License & Usage
This indicator is designed for educational and trading purposes. Users are responsible for:
- **Data Accuracy**: Ensuring correct expected move values
- **Risk Management**: Proper position sizing and risk controls
- **Market Understanding**: Comprehending options-based expected move concepts
## Support
For questions, issues, or feature requests related to this indicator, please refer to the code comments and documentation within the Pine Script file.
---
**Disclaimer**: This indicator is for informational purposes only. Trading involves substantial risk of loss and is not suitable for all investors. Past performance does not guarantee future results.
ابحث في النصوص البرمجية عن "spx"

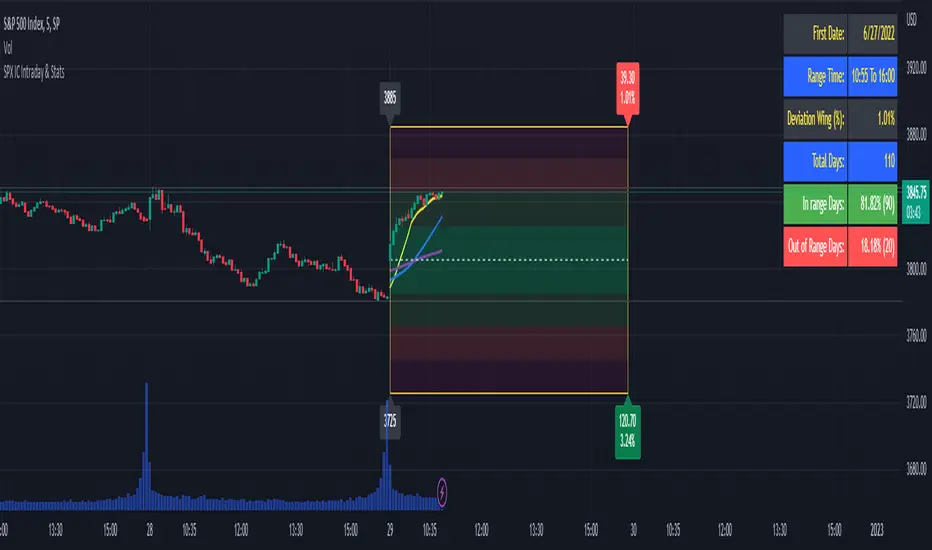
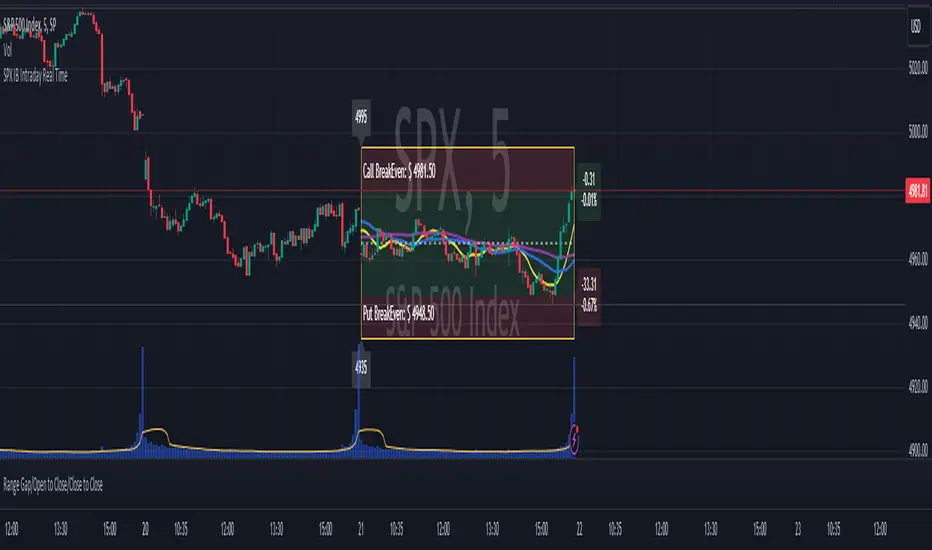
SPX IC Intraday & StatsThis indicator was designed for traders who make intraday Iron Condors with the SPX.
It basically has 2 main parts:
Part 1:
The indicator shows the distance, in real time, between the current SPX price and the IC selling wings (calls and puts wings) that have been selected. This result is displayed in percentages and in points. In the upper right corner (for calls) and lower right corner (for puts). The label will change color as the price moves closer to or further away from the sell strike. Darker red color as it approaches the wings, lighter green color as the price approaches the center of the Iron Condor.
Part 2:
Statistical dashboard showing the number of times in the past that from a certain hour (the current time) to the market close (4pm US East Time) the SPX moved outside or inside the width of the selected wings. The position of the table is configurable. By default, it's in the upper right corner.
Dashboard:
First Date: the first day of the sample (this varies depending on the timeframe, the higher the timeframe the larger the sample is, as TradingView counts more bars backwards, by default TV offers 10000 bars for the PRO version). Recommended 5 minutes.
Range Time: refers to the time range of the sample. From the current time to 4pm (US East Time).
Deviation Wing (%): It's the deviation (in percentage) based on the current time, from the current SPX price to the wing strikes. It takes the smaller value, either call or put wing.
Total Days: the number of days in the sample.
In range Days: the number of days that the price remained in that range from the current time to the market close.
Out of Range Days: the number of days the price ended outside that range from the current time to the market close.
Configuration:
Open Time (Hour): IC opening hour.
Open time (Minute): IC opening minutes.
Width Wings: width of the wings from the SPX price at the configured time.
Mini Rectangles: Refers to include within the IC 4 deviations (mini rectangles) to better visualize where the SPX price is with reference to the wings. Darker red color as it gets closer to the wings, lighter green color as the price gets closer to the center of the Iron Condor.
Add SMAs: Add SMAs 8, 20 and 50 to the IC chart.
Include Fundamental Days: Include or not in the sample important news days. They are considered: FED Meetings, CPI Reports, Unemployment Reports, Powell Speech.
Include Days: (Monday, Tuesday, Wednesday, Thursday, Friday). Include (or not) in the sample the chosen days.
Apply Filters Since: Sampling start date. Per default: False.
Table Position: Dashboard position.
Note 1: It's recommended to use the Dark Theme Color of TradingView.
Note 2: this indicator will only work in intraday timeframes less than 30 minutes (1m, 2m, 5m, 10m, 15m, 30m) and will only show results while the market is open.
************************************
Spanish Version:
Este indicador fue diseñado para los traders que hacen intradías de Iron Condors con el SPX.
Básicamente cuenta con 2 partes principales:
Parte 1:
El indicador muestra la distancia, en tiempo real, entre el actual precio del SPX y las alas vendedoras (alas calls y puts) que se hayan seleccionado. Este resultado se muestra en porcentajes y en puntos. En la esquina superior derecha (para los calls) e inferior derecha (para los puts). El label cambiará de color a medida que el precio se acerque o aleje del precio de las alas. Color rojo más oscuro a medida que se acerque a las alas, color verde claro cuando el precio se acerque al centro del Iron Condor.
Parte 2:
Dashboard estadístico que muestra la cantidad de veces que desde una determinada hora (el tiempo actual) hasta el cierre del mercado (4pm US East Time) el SPX se movió fuera o dentro del ancho de las alas seleccionadas. La posición de la tabla es configurable. Por defecto esta en la esquina superior derecha.
Dashboard:
First Date: el primer día de la muestra (esto varía dependiendo el timeframe, a mayor timeframe la muestra es mayor, ya que TradingView contará más barras para atrás (por default TV ofrece 10000 barras para la versión PRO). Recomendado 5 minutos.
Range Time: se refiere al rango horario de la muestra. Desde la hora actual hasta las 4pm (US East Time)
Deviation Wing (%): Es la desviación en porcentaje en base a la hora actual, desde el precio actual del SPX hasta el ancho de las alas. Toma el menor valor, sea al ala call o al ala put.
Total Days: la cantidad de días de la muestra.
In range Days: la cantidad de días que el precio se mantuvo en ese rango desde la hora actual hasta el cierre del mercado
Out of Range Days: la cantidad de días que el precio terminó fuera de ese rango desde la hora actual hasta el cierre del mercado.
Configuración:
Open Time (Hour): Hora de apertura del IC.
Open time (Minute): Minutos de apertura del IC.
Width Wings: ancho de las alas desde el precio del SPX a la hora configurada.
MiniRectangles: Se refiere a incluir dentro del IC 4 desviaciones (mini rectángulos) para visualizar de mejor manera donde se encuentra el precio del SPX con referencia a las alas. Color rojo más oscuro a medida que se acerque a las alas, color verde claro cuando el precio se acerque al centro del Iron Condor.
Add SMAs: Agrega al cuadro las SMA 8, 20 y 50.
Include Fundamental Days: Incluye o no en la muestra días de noticias importantes. Son considerados: FED Meetings, CPI Reports, Unemployment Reports, Powell Speech.
Include Days: (Monday, Tuesday, Wednesday, Thursday, Friday). Incluye (o no) en la muestra los días elegidos.
Apply Filters Since: Fecha de comienzo del muestreo.
Table Position: Posición del dashboard.
Nota 1: se recomienda usar el Dark Theme Color de TradingView.
Nota 2: este indicador solo funcionará en temporalidades intradías menores a 30 minutos (1m,2m,5m,10m,15m,30m) y Solo mostrará resultados mientras el mercado esté abierto, o sea en tiempo real.
SPX Levels Adjusted to Active TickerThis indicator allows you to plot custom SPX levels directly on the ES1! (E-mini S&P 500 Futures) chart, automatically adjusting for the spread between SPX and ES1!. This is particularly useful for traders who perform technical analysis on SPX but execute trades on ES1!.
Features:
Input up to three SPX key levels to track (e.g., 5000, 4950, 4900)
The script adjusts these levels in real-time based on the current spread between SPX and ES1!
Displays the spread in the chart header for quick reference
Plots updated horizontal lines that move with the spread
Includes optional labels showing the spread periodically to reduce clutter
Supports Multiple Tickers, ES1!, SPY and SPX500USD.
Ideal for futures traders who want SPX context while trading ES1!.

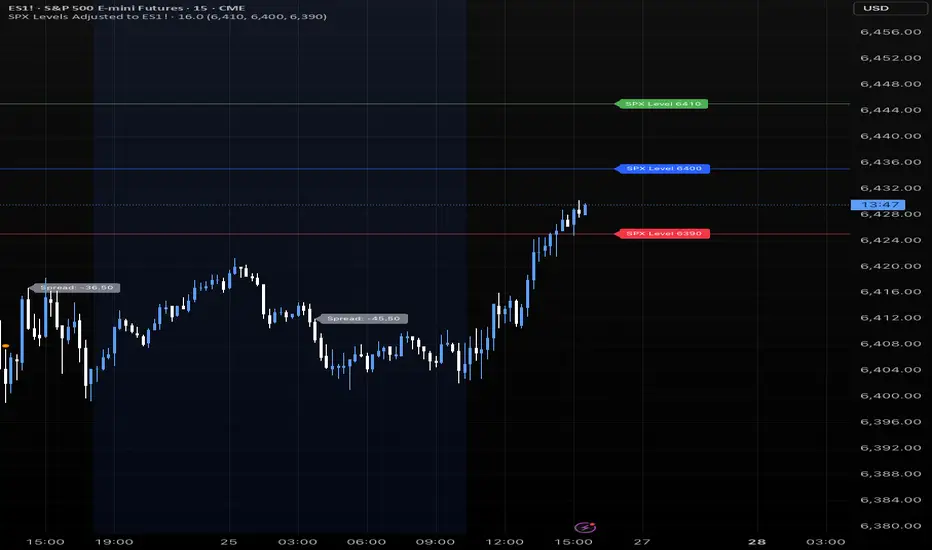
SPX Levels Adjusted to ES1!This indicator allows you to plot custom SPX levels directly on the ES1! (E-mini S&P 500 Futures) chart, automatically adjusting for the spread between SPX and ES1!. This is particularly useful for traders who perform technical analysis on SPX but execute trades on ES1!.
Features:
Input up to three SPX key levels to track (e.g., 5000, 4950, 4900)
The script adjusts these levels in real-time based on the current spread between SPX and ES1!
Displays the spread in the chart header for quick reference
Plots updated horizontal lines that move with the spread
Includes optional labels showing the spread periodically to reduce clutter
Ideal for futures traders who want SPX context while trading ES1!.
Make sure to apply this indicator on the ES1! chart, not SPX.
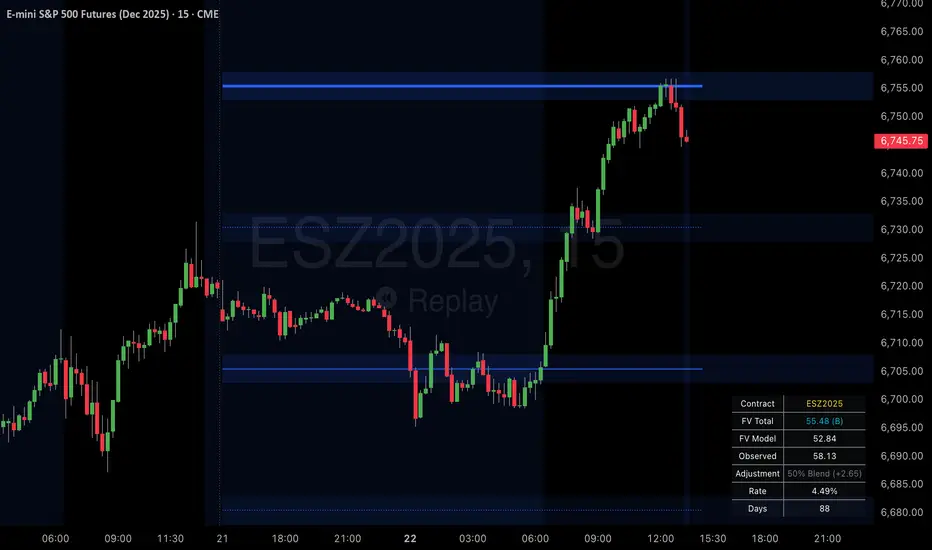
SPX Psych Levels for /ES Futures (Fair Value)Overview
This indicator displays S&P 500 psychological levels adjusted for ES futures fair value premium. These levels act as powerful magnets for price action due to the convergence of technical trading and options market dynamics.
What is Fair Value Premium?
Simply put, its the difference between the SPX price and the ES futures price. This changes dynamically based on interest rate, dividends, and time to expiration.
Why Psych Levels are Increasingly Important
Psychological levels are round numbers where traders naturally place orders. These obvious levels attract stop losses, profit targets, and breakout orders from both retail and institutional traders. Algorithms often target these same levels, creating a self-fulfilling prophecy of support and resistance. Importantly, this effect has been exacerbated by the options market.
Using May 2025 as an example, SPX options averaged 3.46 million contracts a day ≈US $1.8 trillion notional, dwarfing trading in SPY or ES/MES futures. 0-day-to-expiry (0DTE) trades hit a record-high 61% share of all SPX volume, making the options complex the primary arena for intraday price discovery.
Strikes at psychological numbers (ending in 00 and 50) captured 66% of total open interest and 58% of 0DTE volume for the entire month. This massive concentration at round number strikes creates powerful hedging flows:
Dealer Gamma Hedging: As price approaches these levels, market makers must dynamically hedge their options exposure, creating reflexive buying/selling pressure
Pin Risk: Options dealers face maximum uncertainty at these levels near expiration, leading to increased hedging activity
Charm Flows: Time decay accelerates near these levels, forcing position adjustments
How It Works
The indicator automatically:
Calculates the fair value premium between ES futures and SPX using real-time interest rate data, dividends, and time to expiration
Adjusts SPX round numbers by this premium to show where they appear on ES charts
Updates once daily at futures session open (5PM CT) to maintain stable reference points throughout the trading session
Key Features
All TradingView Native: All calculations performed automatically using data available within TradingView - no external data feeds or manual updates required
Multiple Level Increments: Display major (100-point), intermediate (50-point), and minor (25-point) psychological levels
Margin of Error Zones: Optional ±2.5 point zones accounting for fair value calculation variance
Full Customization: Colors, line styles, and widths for each level type
Fair Value Info Table: Displays current contract, fair value calculation, interest rate, and days to expiration
Automatic Contract Detection: Works on ES1!/MES1! continuous contracts and automatically detects the current front month contract
Important Notes
This indicator does not access any options data. It identifies levels where options activity naturally concentrates based on market structure. The power comes from understanding that these obvious levels create predictable dealer hedging flows, making them high-probability reaction zones.
Trading Applications
These levels can be used as dynamic areas of interest to be incorporated into a complete trading strategy.
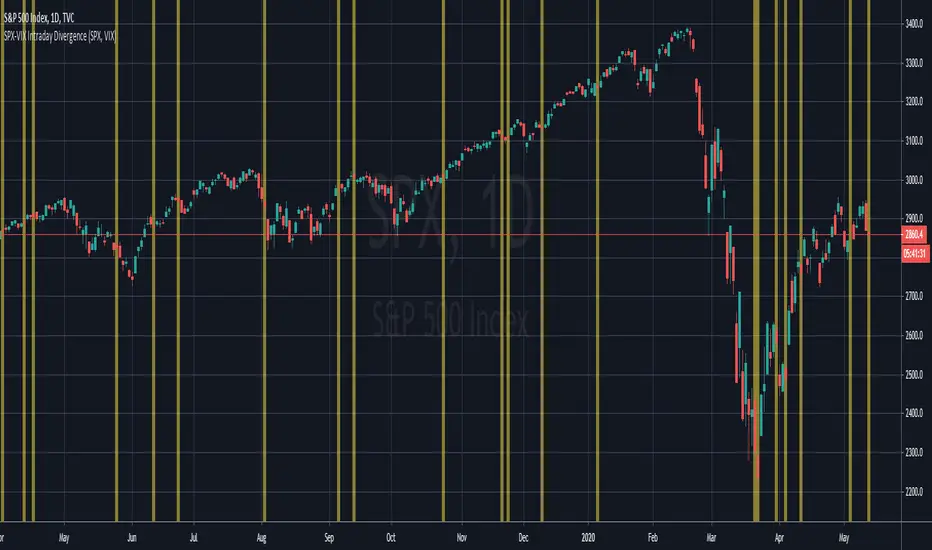
SPX-VIX Intraday DivergenceAs a long-term buyer/short-seller, you will always find different ways to enter the market , moving average crossovers, breakouts , overbought/oversold conditions being some of the classy methods. However, they are decreasingly effective... 😢
Recently I have realized that analysis beyond the technical indicators will bring trading to the next level because I will be able to confirm my trading signals without relying too much on basic price actions and patterns which are easily manipulated by big banks and institutions. 👍
Today I will introduce you to my divergence indicator making use of SPX and VIX. Unlike MacD or RSI divegence , which would involve normative judgement , it will take account of the unusual move by SPX alongwith the VIX , to the exploit chances that options market, where most experienced investors participated in has a preceding insight into the equity market about the upcoming moves.
I have divided signals into two groups.
Bullish divergence - SPX Down , VIX also Down 👇
Bearish divergence - SPX Up , VIX also Up 👆
I hope this script will enable us to take advantage of the options market activities , to provide a REAL divergence signal, and be used coupled with our own chart patterns or other price signals, and more importantly to score more and more winning trades!!!
If you want more useful scripts from me, please like and share my posts. And don't forget to follow my account to grab the latest ideas and tools! 😘
SPX Expected MoveThis indicator plots the "expected move" of SPX for today's trading session. Expected move is the amount that SPX is predicted to increase or decrease from its current price, based on the current level of implied volatility. The implied volatility in this indicator is computed from the current value of the VIX (or one of several volatility symbols available on Trading view). The computation is done using standard formula. The resulting plots are labeled as 1 and 2 standard deviations. The default values are to use VIX as well as 252 trading days in the years.
Use the square root of (days to expiration, or in this case a fraction of the day remaining) divided but the square root of (252, or number of trading days in a year).
timeRemaining = math.sqrt(DTE) / math.sqrt(252)
Standard deviation move = SPX bar closing price * (VIX/100) * timeRemaining

SPX IB Intraday Real TimeThis indicator was designed for traders doing Iron Butterflies intradays with the SPX.
Draw and assemble the picture of an IB with the call and put wings chosen according to the selected configuration. Additionally, it shows both breakevens according to the credit obtained.
The indicator shows the distance, in real time, between the current price of the SPX and the breakevens (calls and puts) that have been selected. This result is shown in percentages and points. In the upper right corner (for calls) and lower right (for puts). The label will change color as the price moves closer or further away from the breakevens.
Setting:
Open Time (Hour): IB opening time.
Open Time (Minute): IB opening minutes.
Open Price: Strike to which the center or body of the IB was opened.
Auto Price Open: If enabled, it will take the strike at the price closest to the SPX.
Wings Width: width of the IB wings.
Credit: Refers to the credit obtained according to the IB that was opened.
Shows Breakeven: Shows breakeven points at expiration based on credit earned.
Add SMAs: Adds the SMAs 8, 20 and 50 to the chart.
Note 1: It is recommended to use TradingView's Dark Theme Color.
Note 2: this indicator will only work in intraday times of less than 30 minutes (1m,2m,5m,10m,15m,30m) and will only show results while the market is open, that is, in real time.
************************************
Spanish Version:
Este indicador fue diseñado para los traders que hacen intradías de Iron Butterflies con el SPX.
Dibuja y arma el cuadro de un IB con las alas call y puts elegidas de acuerdo a la configuración seleccionada. Además, muestra ambos breakevens según el crédito obtenido.
El indicador muestra la distancia, en tiempo real, entre el actual precio del SPX y los breakevens (calls y puts) que se hayan seleccionado. Este resultado se muestra en porcentajes y en puntos. En la esquina superior derecha (para los calls) e inferior derecha (para los puts). El label cambiará de color a medida que el precio se acerque o aleje de los breakevens.
Configuración:
Open Time (Hour): Hora de apertura del IB.
Open Time (Minute): Minutos de apertura del IB.
Open Price: Strike al que se abrió el centro o cuerpo del IB.
Auto Price Open: Si se encuentra habilitado tomará el strike al precio más cercano al SPX.
Wings Width: ancho de las alas del IB.
Credit: Se refiere al crédito obtenido según el IB que se abrió.
Shows Breakeven: Muestra los puntos de breakeven en la expiración según el crédito obtenido.
Add SMAs: Agrega al cuadro las SMA 8, 20 y 50.
Nota 1: se recomienda usar el Dark Theme Color de TradingView.
Nota 2: este indicador solo funcionará en temporalidades intradías menores a 30 minutos (1m,2m,5m,10m,15m,30m) y solo mostrará resultados mientras el mercado esté abierto, o sea en tiempo real.
SPX ES SpreadA very simple indicator to display the spread between ES and SPX. The table by default displays in the upper right corner of the chart. If you are on the chart for SPX, it will show the current price of ES, as well as the difference in points between the two. Similarly, if on the chart for ES, it will show the price for SPX as well as the difference in points between the two. The table does not appear at all if the chart symbol is anything other than ES or SPX. The specific symbols used can be defined by the user.

SPX Fair Value Bands WSHOSHOThis is a variation of the SPX Fair Value Bands indicator which uses WSHOSHO instead of WALCL.
WSHOSHO only includes the 'Securities Held Outright' portion of the Fed balance sheet. This effectively eliminates the portions related to BTFP (Bank Term Funding Program).
SPX Implied Probability of closing above/belowThis is a recreation of the work done by Michael Rechenthin aka "Dr.Data" from Tastytrade back in 2016 (this indicator is for SP:SPX only)
You can watch the episode where "Dr.Data", Tom and Tony go over this concept on the following link:
www.tastytrade.com
The following are my personal additions:
- ability to choose between TVC:VIX and NASDAQ:VOLI as the IV input
- ability to choose between 252 and 365 for the number of days
Note that I’m displaying 4 decimal places (#.####) to be as accurate as possible but sometimes you will see 0% or 100% displayed which means that more decimal places are needed (0% could be 0.00005% or 100% could be 99.99995%).

Implied SPX from ES Implied SPX from ES Futures (ETH)
Description:
This script calculates the implied SPX index level based on real-time ES futures pricing during extended trading hours (ETH). It uses the spread between the previous day’s ES and SPX RTH closes to adjust for fair value and intraday divergence.
📈 Features:
Tracks current ES price vs. yesterday's RTH spread to estimate SPX
Useful for SPX options traders who want to monitor synthetic index levels during ETH
Ideal for assessing SPX movement when the cash market is closed
This tool is especially helpful for those trading SPX index options overnight or seeking to align SPX levels with ES futures movement.

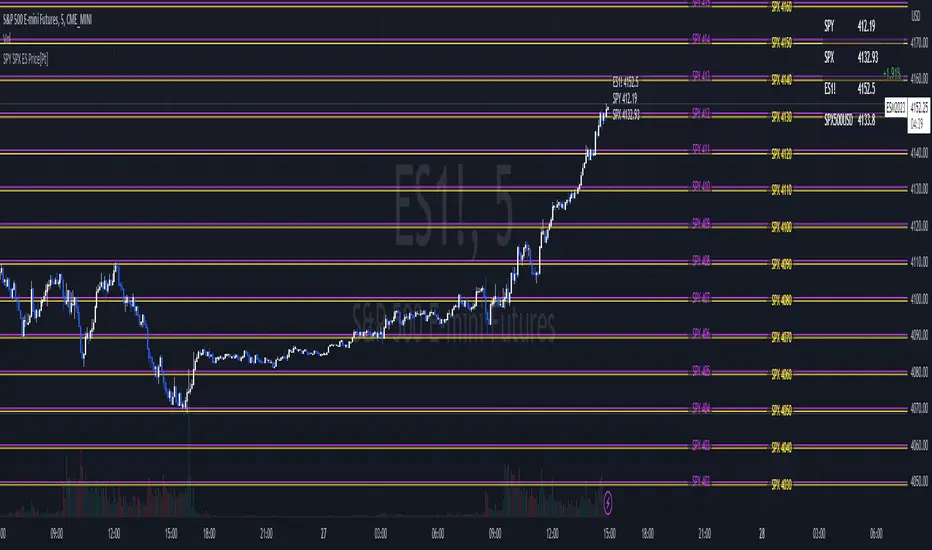
SPY SPX ES Price Converter+ [Pt]This is a + version of my original SPY SPX ES Price Converter indicator
Description
The SPY SPX ES Price Converter is a powerful and easy-to-use tool that allows traders to view corresponding price levels for linked instruments in real-time. This includes SPY, SPX, ES, and SPX500USD. Although these instruments often move in sync, differences in price movements, volume, and trading hours can create unique key levels and support/resistance areas for each. By mapping these levels on the same chart, traders can more easily spot trading opportunities and improve their chances of success.
Customizable features
- multiplier from the closest whole number price level
- line color
- line style
- label position / size
- # of levels to display
- toggle current price display table
|| ------------------------------------------------------------------------------------------------------------------------------------------------------------------------------------||
This script includes the following premium unique features.
SPY / SPX Gaps detector
A gap is an area on a chart where the price between two bars changes significantly without any trades happening between them. Such gaps often occur when a strong shift in sentiment happens during the hours when markets are usually closed. This indicator highlights these gaps on the chart and extends them further until they have been covered (i.e., when a newer bar has crossed that gap).
Overnight gaps from SPY or SPX can be mapped directly onto ES chart
VWAPs
VWAPs of these linked instruments can be mapped onto the chart. For example, ES VWAP mapped onto SPY chart, or vise versa. This allows for clear visualization of the price action near these VWAP levels.
Custom Cross Instruments Price Targets
Want to trade SPY options while watching ES chart or vise versa? You can setup to 8 price targets and see the corresponding converted price level. No need to switch between charts to try to figure out which price level corresponds to which.

SPX → NQ Levels ConverterSPX → NQ Levels Converter is a Pine Script indicator that projects key S&P 500 (SPX) levels onto the NASDAQ 100 (NQ) chart using a configurable conversion ratio.
• Dynamic ratio: calculates the live SPX/NQ ratio in real time.
• Static ratio: allows manual input of a fixed ratio.
• Supports up to 10 custom SPX levels, automatically converted into their equivalent NQ values.
• Each level is displayed with a line and label (SPX → NQ) with independent color settings.
• Advanced visualization controls:
• line extension (right, left, both, or fixed)
• line length & placement
• label side & offset.
• Lines and labels auto-update on every bar to stay accurate over time.
Use case: particularly useful for traders who track SPX option levels or support/resistance zones but execute trades on the NQ.

Adaptive Trend Flow Strategy with Filters for SPXThe Adaptive Trend Flow Strategy with Filters for SPX is a complete trading algorithm designed to identify traits and offer actionable alerts for the SPX index. This Pine Script approach leverages superior technical signs and user-described parameters to evolve to marketplace conditions and optimize performance.
Key Features and Functionality
Dynamic Trend Detection: Utilizes a dual EMA-based totally adaptive method for fashion calculation.
The script smooths volatility the usage of an EMA filter and adjusts sensitivity through the sensitivity enter. This allows for real-time adaptability to market fluctuations.
Trend Filters for Precision:
SMA Filter: A Simple Moving Average (SMA) guarantees that trades are achieved best while the rate aligns with the shifting average trend, minimizing false indicators.
MACD Filter: The Moving Average Convergence Divergence (MACD) adds some other layer of confirmation with the aid of requiring alignment among the MACD line and its sign line.
Signal Generation:
Long Signals: Triggered when the fashion transitions from bearish to bullish, with all filters confirming the pass.
Short Signals: Triggered while the trend shifts from bullish to bearish, imparting opportunities for final positions.
User Customization:
Adjustable parameters for EMAs, smoothing duration, and sensitivity make certain the strategy can adapt to numerous buying and selling patterns.
Enable or disable filters (SMA or MACD) based totally on particular market conditions or consumer possibilities.
Leverage and Position Sizing: Incorporates a leverage aspect for dynamic position sizing.
Automatically calculates the exchange length based on account fairness and the leverage element, making sure hazard control is in area.
Visual Enhancements: Plots adaptive fashion ranges (foundation, top, decrease) for actual-time insights into marketplace conditions.
Color-coded bars and heritage to visually represent bullish or bearish developments.
Custom labels indicating crossover and crossunder occasions for clean sign visualization.
Alerts and Automation: Configurable alerts for each lengthy and quick indicators, well matched with automated buying and selling structures like plugpine.Com.
JSON-based alert messages consist of account credentials, motion type, and calculated position length for seamless integration.
Backtesting and Realistic Assumptions: Includes practical slippage, commissions, and preliminary capital settings for backtesting accuracy.
Leverages excessive-frequency trade sampling to make certain strong strategy assessment.
How It Works
Trend Calculation: The method derives a principal trend basis with the aid of combining fast and gradual EMAs. It then uses marketplace volatility to calculate adaptive upper and decrease obstacles, creating a dynamic channel.
Filter Integration: SMA and MACD filters work in tandem with the fashion calculation to ensure that handiest excessive-probability signals are accomplished.
Signal Execution: Signals are generated whilst the charge breaches those dynamic tiers and aligns with the fashion and filters, ensuring sturdy change access situations.
How to Use
Setup: Apply the approach to SPX or other well suited indices.
Adjust person inputs, together with ATR length, EMA smoothing, and sensitivity, to align together with your buying and selling possibilities.
Enable or disable the SMA and MACD filters to test unique setups.
Alerts: Configure signals for computerized notifications or direct buying and selling execution through third-celebration systems.
Use the supplied JSON payload to integrate with broking APIs or automation tools.
Optimization:
Experiment with leverage, filter out settings, and sensitivity to find most effective configurations to your hazard tolerance and marketplace situations.
Considerations and Best Practices
Risk Management: Always backtest the method with realistic parameters, together with conservative leverage and commissions.
Market Suitability: While designed for SPX, this method can adapt to other gadgets by means of adjusting key parameters.
Limitations: The method is trend-following and can underperform in enormously risky or ranging markets. Regularly evaluate and modify parameters primarily based on recent market conduct.
If you have any questions please let me know - I'm here to help!

Chande Kroll Trend Strategy (SPX, 1H) | PINEINDICATORSThe "Chande Kroll Stop Strategy" is designed to optimize trading on the SPX using a 1-hour timeframe. This strategy effectively combines the Chande Kroll Stop indicator with a Simple Moving Average (SMA) to create a robust method for identifying long entry and exit points. This detailed description will explain the components, rationale, and usage to ensure compliance with TradingView's guidelines and help traders understand the strategy's utility and application.
Objective
The primary goal of this strategy is to identify potential long trading opportunities in the SPX by leveraging volatility-adjusted stop levels and trend-following principles. It aims to capture upward price movements while managing risk through dynamically calculated stops.
Chande Kroll Stop Parameters:
Calculation Mode: Offers "Linear" and "Exponential" options for position size calculation. The default mode is "Exponential."
Risk Multiplier: An adjustable multiplier for risk management and position sizing, defaulting to 5.
ATR Period: Defines the period for calculating the Average True Range (ATR), with a default of 10.
ATR Multiplier: A multiplier applied to the ATR to set stop levels, defaulting to 3.
Stop Length: Period used to determine the highest high and lowest low for stop calculation, defaulting to 21.
SMA Length: Period for the Simple Moving Average, defaulting to 21.
Calculation Details:
ATR Calculation: ATR is calculated over the specified period to measure market volatility.
Chande Kroll Stop Calculation:
High Stop: The highest high over the stop length minus the ATR multiplied by the ATR multiplier.
Low Stop: The lowest low over the stop length plus the ATR multiplied by the ATR multiplier.
SMA Calculation: The 21-period SMA of the closing price is used as a trend filter.
Entry and Exit Conditions:
Long Entry: A long position is initiated when the closing price crosses over the low stop and is above the 21-period SMA. This condition ensures that the market is trending upward and that the entry is made in the direction of the prevailing trend.
Exit Long: The long position is exited when the closing price falls below the high stop, indicating potential downward movement and protecting against significant drawdowns.
Position Sizing:
The quantity of shares to trade is calculated based on the selected calculation mode (linear or exponential) and the risk multiplier. This ensures position size is adjusted dynamically based on current market conditions and user-defined risk tolerance.
Exponential Mode: Quantity is calculated using the formula: riskMultiplier / lowestClose * 1000 * strategy.equity / strategy.initial_capital.
Linear Mode: Quantity is calculated using the formula: riskMultiplier / lowestClose * 1000.
Execution:
When the long entry condition is met, the strategy triggers a buy signal, and a long position is entered with the calculated quantity. An alert is generated to notify the trader.
When the exit condition is met, the strategy closes the position and triggers a sell signal, accompanied by an alert.
Plotting:
Buy Signals: Indicated with an upward triangle below the bar.
Sell Signals: Indicated with a downward triangle above the bar.
Application
This strategy is particularly effective for trading the SPX on a 1-hour timeframe, capitalizing on price movements by adjusting stop levels dynamically based on market volatility and trend direction.
Default Setup
Initial Capital: $1,000
Risk Multiplier: 5
ATR Period: 10
ATR Multiplier: 3
Stop Length: 21
SMA Length: 21
Commission: 0.01
Slippage: 3 Ticks
Backtesting Results
Backtesting indicates that the "Chande Kroll Stop Strategy" performs optimally on the SPX when applied to the 1-hour timeframe. The strategy's dynamic adjustment of stop levels helps manage risk effectively while capturing significant upward price movements. Backtesting was conducted with a realistic initial capital of $1,000, and commissions and slippage were included to ensure the results are not misleading.
Risk Management
The strategy incorporates risk management through dynamically calculated stop levels based on the ATR and a user-defined risk multiplier. This approach ensures that position sizes are adjusted according to market volatility, helping to mitigate potential losses. Trades are sized to risk a sustainable amount of equity, adhering to the guideline of risking no more than 5-10% per trade.
Usage Notes
Customization: Users can adjust the ATR period, ATR multiplier, stop length, and SMA length to better suit their trading style and risk tolerance.
Alerts: The strategy includes alerts for buy and sell signals to keep traders informed of potential entry and exit points.
Pyramiding: Although possible, the strategy yields the best results without pyramiding.
Justification of Components
The Chande Kroll Stop indicator and the 21-period SMA are combined to provide a robust framework for identifying long trading opportunities in trending markets. Here is why they work well together:
Chande Kroll Stop Indicator: This indicator provides dynamic stop levels that adapt to market volatility, allowing traders to set logical stop-loss levels that account for current price movements. It is particularly useful in volatile markets where fixed stops can be easily hit by random price fluctuations. By using the ATR, the stop levels adjust based on recent market activity, ensuring they remain relevant in varying market conditions.
21-Period SMA: The 21-period SMA acts as a trend filter to ensure trades are taken in the direction of the prevailing market trend. By requiring the closing price to be above the SMA for long entries, the strategy aligns itself with the broader market trend, reducing the risk of entering trades against the overall market direction. This helps to avoid false signals and ensures that the trades are in line with the dominant market movement.
Combining these two components creates a balanced approach that captures trending price movements while protecting against significant drawdowns through adaptive stop levels. The Chande Kroll Stop ensures that the stops are placed at levels that reflect current volatility, while the SMA filter ensures that trades are only taken when the market is trending in the desired direction.
Concepts Underlying Calculations
ATR (Average True Range): Used to measure market volatility, which informs the stop levels.
SMA (Simple Moving Average): Used to filter trades, ensuring positions are taken in the direction of the trend.
Chande Kroll Stop: Combines high and low price levels with ATR to create dynamic stop levels that adapt to market conditions.
Risk Disclaimer
Trading involves substantial risk, and most day traders incur losses. The "Chande Kroll Stop Strategy" is provided for informational and educational purposes only. Past performance is not indicative of future results. Users are advised to adjust and personalize this trading strategy to better match their individual trading preferences and risk tolerance.

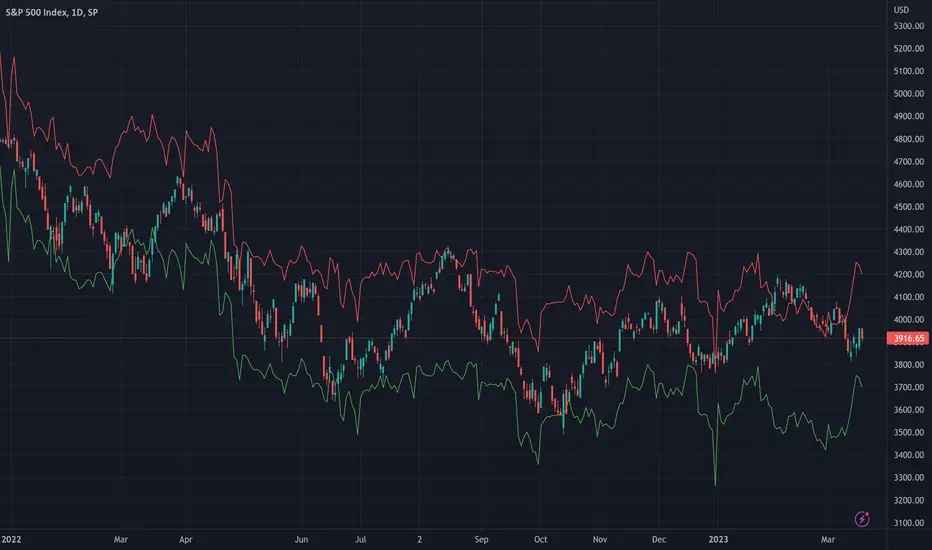
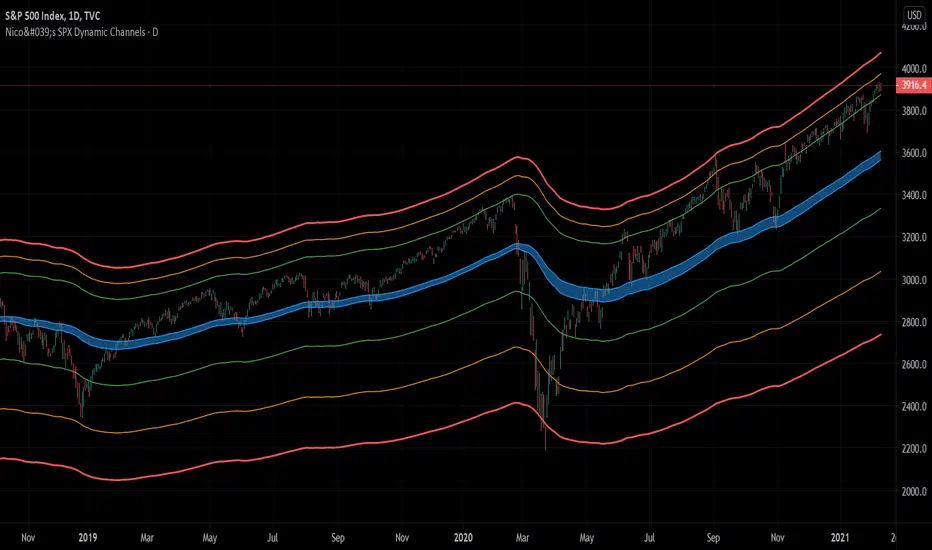
Nico's SPX Dynamic ChannelsTest of dynamic channels and some statistics made by hand.
This indicator was done specifically for the S&P500 index.
As you can see, below the 125 EMA there's a lot more volatility than in the upside. I've made some kind of a dynamic linear regression of the lows and the highs.
I've chosen the MA that best fits the SPX, and then calculated in Excel the percental mean and SDs of most important peaks and valleys that I've chosen in comparison to the 125 MA. This lead to the green, orange and red zones. BUT, I've calculated the peaks and valleys separately, as I assumed that a bear market and crashes have way more volatility than bull markets. That's why the difference between the upper and the lower channels.
The neutral blue zone is composed by an upper EMA of the highs and lower EMA of the lows. No MA in this script uses the close price as a source.
This MA makes sense because it represents a semester of trading, for this particular asset.
Backtest results
It's also interesting to try it here too, as it has a little bit more of data:
SPCFD:SPX
As it's not a trading system, I have no batting average nor ratios for this.
Still, the measures of the peaks and valleys are very accurate and repeat themselves over and over again. The results were:
3rd resistance: 12.88%
2nd resistance: 10.12%
1st resistance: 7.36%
1st support: -6.42%
2nd support: -14.8%
3rd support: -23.18%
All referred to the mean, which is the 125 EMA zone.
After the 1950's works like magic, but not before. You will see that it doesn't work in the great depression and it's crash.
How to use this indicator
Green = First grade support/resistance .
Orange = Second grade support/resistance . Caution.
Red = Third grade support/resistance . High chances of mean reversal.
Blue zone = This is the neutral zone, where the prices are not cheap nor expensive.
Often in a trending market, the price will have the blue zone as it's main support and when trending the price will stick to the green MA.
When the price touches the orange MA, the most probable is that it will return to the green MA.
If the price touches the red zone, there's a high chance that this is a big turning point and it will reverse to the mean (green or blue zone).
Imagine you've bought each time the price touched the red support, check that and you'll start liking this indicator. I think it is a great entry point for investors. The red resistance is good too, but of course it works for a short period of time.
I've backtested this indicator since the beginning of the dataset and it works like magic, but ONLY for the SPX index (spot price).
Leave a comment or some coins if you like it!!!
(I've posted it before like an analysis, not as a script, my bad)
SPX 0DTE Forecast Indicator by Alpha CrunchingSPX 0DTE Forecast Indicator
This indicator is designed specifically for the SPX 5-minute chart and plots a forward-looking price projection for the current trading day.
🔹 Forecast Model Overview:
The forecast is built by analyzing SPX price action over the past month. The trading day is broken into 5-minute intervals, and the average net price movement (delta) is calculated for each interval. These deltas are then reassembled and accumulated to generate a full-day projection for each day of the week.
🔹 Usage:
Before the market opens, users can paste that day’s forecast data into the indicator input. Once the session begins, the forecast curve will be visible alongside live price action.
📌 Note:
This indicator is only compatible with the SPX 5-minute chart.
Forecast data must be entered manually each day.
No trading signals or automation are included.

SPY SPX ES Price Converter [Pt]A must have tool for SPY SPX ES traders~!!!
Description
The SPY SPX ES Price Converter is a powerful and easy-to-use tool that allows traders to view corresponding price levels for linked instruments in real-time. This includes SPY, SPX, ES, and SPX500USD. Although these instruments often move in sync, differences in price movements, volume, and trading hours can create unique key levels and support/resistance areas for each. By mapping these levels on the same chart, traders can more easily spot trading opportunities and improve their chances of success.
Customizable features
- multiplier from the closest whole number price level
- line color
- line style
- label position / size
- # of levels to display
- toggle current price display table
Global Net Liquidity - SPX Fair ValueThis is similar to the SPX Fair Value Bands indicator.
It currently only displays the fair value.
The original SPX Fair Value formula only includes the Fed balance sheet data.
This indicator incorporates the following central bank assets:
Fed
Japan
China
UK
ECB
This is currently experimental. Feel free to explore using different formula constants.

MINI SPXThis is the XSP version of SPX, basically it's just the price of SPX divided by 10 and shown using labels.
Should only be used on SPX to watch the price of XSP since XSP doesn't have real-time data ATM.
Can be used on any time frames.
This script allows you to view the Daily (O, H, L, C) and Yesterday's (O, H, L, C) with a non intrusive price line.
Allows for extra customization of the price lines and labels.

Compare ticker against SPX - yoyo This script is built on a request of one of the best trader yoyo. The script compares the performance of a tickers against SPX.
The script gives user option to override default SPX ticker to a ticker of their choice using settings.
The script does a % change comparison against base stock which is SPX by default for same timeframes and you can see relativity of stock to the other.
It also does plot a line that shows any divergence.
STAR SPX/NQ/ES Auto Levels Convertergreat for traders using SPX GEX levels
auto convert NQ and ES levels
