Portfolio_Tracking_TRThis is a portfolio tracker that will track individual, overall and daily profit/loss for up. You can set the size of your buys and price of your buys for accurate, up to date profit and loss data right on your chart. It works on all markets and timeframes.
Next we get into setting up your , order size and price. Each ticker lets you set which stock you bought, then set how much you purchased and then what price you purchased them at.
FEATURES
Top Section
The portfolio tracker has 2 sections. The top section shows each ticker in your portfolio individually with the following data:
- Ticker Name
- Weight of that asset compared to your total portfolio in %
- Current value of that position in TL
- Profit or loss value from purchase price in %
- Todays change in value from yesterday’s close in %
Bottom Section
The bottom section of the tracker will give you info for your portfolio as a whole. It has the following data:
- Total cost of your entire portfolio in TL
- Current value of your entire portfolio in TL
- Current profit or loss of your entire portfolio in TL
- Current profit or loss of your entire portfolio in %
- Todays change of your entire portfolio value compared to yesterday’s close in %
This indicator was compiled from FriendOfTheTrend's indicator named Portfolio Tracker For Stocks & Crypto.
ابحث في النصوص البرمجية عن "track"

Prophit Ninja: Hidden ScrollStay ahead of the markets moves with "Prophit Ninja: Hidden Scroll".
Our legendary senseis have mastered the arts of wielding the Katana and Shuriken over many decades of focused practice and distilled their systems and techniques down to their most vital form- storing their knowledge in this ancient scroll for easy adoption by any ninja practiced enough to be able to decipher it.
═════════════════════════════════════════════════════════════════════════
█ INTERPRETATION
Each sub-indicator in this package can be used as a confirmation tool to check your bias and give you a more informed decision as they all take into account every reading shown and not shown being calculated across all Prophit Ninja packages. A sentiment rating below the candle shows bullish bias while a green color emphasizes bullish strength- a sentiment rating above the candle shows bearish bias while a red color emphasizes bearish strength- gold color signifies a strong turn in the market while grey/dark grey is a weak reading. A green trend sensei reading is bullish- while a red trend sensei reading is bearish. A green bull trade sensei label signifies a possible bullish trade set up, while a red bear label trade sensei signifies a possible bearish trade set up. Stat sensei gives you tick by tick multi-time frame readings to always keep you aware of the exact environment you're in. Lastly risk sensei will give you the most optimal least risk trade set-up based on user defined variables and give you tick by tick readings of your trade status. This can be used as a standalone decision-maker, or used in confluence with other indicator packages in our Prophit Ninja bundle to get higher precision.
═════════════════════════════════════════════════════════════════════════
█ OVERVIEW
1 — Sentiment Sensei: A toggle-able tick by tick rating system (0-100%) for each candle based on over 100 individual readings .
2 — Trend Sensei: A toggle-able background coloring that easily shows you the trend bias behind the moves.
3 — Trade Sensei: A toggle-able trade finder that finds confluent trade set-ups to give you the upper hand.
4 — Stat Sensei: A toggle-able multi-time frame candle progress tracker with a built in trend bias and price/volume/momentum change/ratio trackers.
5 — Risk Sensei: A toggle-able risk manager with two variations of auto profit target zones , three variations of trailing stop losses , a win/loss tracker , trade duration timer and all the information you need to stay updated with the status of your trade at a glance whether long or short.
═════════════════════════════════════════════════════════════════════════
█ EASY CUSTOMIZATION
i.imgur.com
With a fully customizable and easy-to-use input menu , this indicator gives you the ability to tailor your trading experience to your needs and see as much (or as little) information as you want to; presented in the manner you deem most viable with the following options in just a few clicks:
Indicator Package- This option allows you to switch between the four display modes available so in any moment you can completely change the metrics you’re reading in just two clicks. This allows you the ability to make decisions based on not only what you’re comfortable with; but also to find confirmation or disagreement with other systems instantly.
Color Theme- There are four color themes available which include original, colorful, monochrome and solid. These not only allow you a quick and easy way to change the colors to suit your style; they also make it so you can challenge your bias in an instant by viewing the data in a completely different way.
Dual Attack Modes- Whether you’re a scalper, day trader, swing trader, or investor; this option allows you to see the chart based on four different risk tolerance/time expectancy mentalities for the Katana and Shuriken separately in just two clicks. Investors can see what the scalpers are thinking and vice/versa to broaden their decision making and/or hone in when optimal.
Dual Sharpness Levels- This algorithm allows the user to display the data on five different smoothness levels for the Katana and Shuriken separately without suffering the inherent lag that accompanies most other indicators. Whether you like to see every tick of a choppy movement, or filter out the false signals into smooth readings, you can do so at any moment.
═════════════════════════════════════════════════════════════════════════
█ RISK SENSEI EXAMPLE
═════════════════════════════════════════════════════════════════════════
█ PRE-BUILT ALERTS
With Prophit Ninja: Hidden Scroll's built-in alerts you can enable alerts for any piece of the Hidden Scrollin just a few clicks. These alerts are way more specific and optimized than you can possibly achieve with the custom alert settings. Each checking for multiple possible activation triggers instead of one and populating the message field automatically so you can just click create.
═════════════════════════════════════════════════════════════════════════
As you can see; this ancient scroll has the ability to adapt to any reader or adversary and give those in control of its power the upper hand. Any mode of battle, any opponent, any circumstance- 'Prophit Ninja: Hidden Scroll' was polished by our finest artists to inform any reader and make sure they know when to attack, defend or simply allow the fight to play out by its easy-to-read coloring system. As long as you learn the techniques you'll have a much better chance of making the right decision than when you didn't.
This state-of-the-art tool is great for experienced traders, those who just started learning to trade, or anyone in between- truly made to suit the needs of any trader, in any moment, with any mindset (along with the other indicators in our Prophit Ninja bundle) you'll notice an immediate improvement in your market dexterity after learning it.
═════════════════════════════════════════════════════════════════════════
*everything displayed is part of the Prophit Ninja indicator bundle; this is an otherwise blank chart*

[blackcat] L5 Whale Jump Screener 12 AlertsLinkage Authorization:
When you obtain any one of the following technical indicators authorization, the other one will automatically obtain a free authorization for the same length of time:
1. L5 Whale Jump Screener 25 NoAlerts
2. L5 Whale Jump Screener 12 Alerts
Discount Authorization:
While you are authorized for any of the following technical indicators, this indicator will only need to pay 200TVC (not per month) but you obtain the authorization length as long as your longest one among all invited-only indicators .
1. L5 Whales Jump Out of Ocean X
2. L5 Zen Master
Level: 5
Background:
L5 Whale Jump Screener 12 Alerts is a screeener which is based on principle of L5 Whales Jump Out of Ocean X, but it has its own scheme to work as a screener with alerts, which can track 12 trading pairs at the same time. With this indicator, you can track target in your list with remote alerts from TV to your mobile or emails.
At beginning, I want to incorporate this function to "L5 Whale Jump Screener 25 NoAlerts". However, I found it rather difficult to make it happen. One reason is that adding alerts will further increase computing power of it so that TV will not be functional for overloaded indicators. The only way to make a screen plus alerts happen is to reduce the number of targets allowed in the screener until TV rules are in compliance. The other reason is that I found alerts were conflicting with screener function in TV system during my testing. Because if you put many trading pairs that are highly correlated into inputs of the screener indicator. Huge amount of alerts may be produced at the same time, and TV system has its own protection scheme. If too many alerts happened at the same time, it will block and stop the alert scheme immediately. Therefore, I build this one for anyone who need alert function. But, remember, make input tikerids as NOT correlated as possible to prevent TV to shut down your alert for this indicator.
Function:
By tracking multiple targets with alerts, you will own the capability to tracking multiple markets. This ability will let you know the specific situation of the unconnected market and the trading targets in time in the rotating transaction. The alert function will remind you of the current status of multiple markets via mobile phones and emails.
Inputs:
12 tickerids for your customization
Key Signal:
Long Whales / Banker Pump--> fuchsia color area with 0% transparency
Close Long Whales / Close Banker Pump--> red color area with 0% transparency
Short Whales / Banker Dump --> yellow color area with 0% transparency
Close Short Whales / Close Banker Dump --> green color area with 0% transparency
Long Waves Start--> fuchsia color area with 50% transparency
Short Waves Start --> yellow color area with 50% transparency
No Whale or Wave Signal --> gray color rea with 50% transparency
Pros and Cons:
ONLY suitable for discretionary trading, and does NOT support automatic trading system/bots with alerts.
Intuitive and effective, the output signal is more reliable after multi-indicator resonance
For who does not alert function but track more targets, you can choose anther indicator: L5 Whale Jump Screener 25 NoAlerts.
Why 12 Targets are Supported?
From the principle of TV principle, it should be possible to track up to 40 targets at the same time. However, TV has another condition that restricts server computing resources. When the two condition work at the same time, for the whale jump algorithm, the number of targets it can track at the same time will drop from 40 to about 26~27! In addition, this indicator needs to support the display function from the daily time frame to the 1min time frame. Therefore, the requirements for computing resources have further deteriorated. In the end, the maximum tracking number I obtained by compromise is 25 to ensure that this indicator can support 1min or second level normal display without report an error. Based on above fact, adding alerts will further increase computing power needed for this indicator. To prevent TV shutdown this indicator w/ alerts, only 12 tickerids are supported based on this algorithm. Also, due to quite different user scenarios between these two screeners, two versions are published for different group of traders with a linkage authorization schmeme.
Remarks:
My fourth L5 indicator published
Closed-source
Invite-only
Redeem Fee Life Lock Guarantee
Although I take the efforts to inform the script requesters that the best way to promote trading skills is to learn from the open source scripts I released by themself and to improve their PNIE script programming skills, there are still many people asking how to obtain or pay to use BLACKCAT L4/L5 private scripts. In fact, I do not encourage people to use Tradingview Coins ( TVC ) / Cryptocurrency to redeem the right to use BLACKCAT L4/L5 scripts. However, redeeming private script usage rights through TV Coins/ Cryptocurrency may be an effective way to force more people to learn PINE script programming seriously. And then I can concentrate on answering more valuable community questions instead of being overwhelmed by L4/L5 scripting permission reqeusts.
I would like to announce a ‘Redeem Fee Lock Guarantee’ program to further simplify the L4/L5 indicator/strategy utility offering and distinguish itself from the competition. ‘Redeem Fee lock guarantee’ is one of the major initiatives by BLACKCAT as a part of overall value packaging designed to guard BLACKCAT’s followers’ against cost-overruns and operational risks usually borne by them when it comes to PINE script innovation ecosystem. The TVCs redeemed for L4/L5 a follower signs up for with BLACKCAT is their guaranteed lifetime locked in TVC Quantity/ cryptocurrency, with no special conditions, exclusions and fine print whatsoever. Based on this scheme, I can constantly refine, expand, upgrade and improve PINE script publishing to ensure the very best experiences for my followers. The 'Redeem Fee Lock Guarantee' is a step in the direction of rewarding the valuable followers. NOTE: Every L4/L5 script redeeming service is ONLY limited to TVC or Cryptocurrency ("Win$ & Donate w/ This" Addresses displayed on script page) redeeming which the 1st signed up TVC Qty/ equivalent cryptocurrency is the lifetime offered TVC Qty/ equivalent crypto.
How to subscrible this indicator?
The script subscription period only has two options of one month or one year, and its price is floating. The latest price of the script subscription is proportional to the number of likes/agrees this script has already received. Therefore, the price of subscribing to this script shows an increasing trend, and the earliest subscribers can enjoy the price of lifetime lock to this script. As the number of likes / agrees of this script increases, the subscription fee for one month and one year will also increase linearly. Whatever, the first subscription price of the use will be locked for life.
Monthly subscription and annual subscription can be done either by tradingview coins ( TVC ) or by converting into equivalent cryptocurrency at the exchange rate (1TVC=0.01USD) for redeem.
TVC payment needs to pay TVC directly in the comments under this script. Every time I authorize a new user, I will update the latest number of subscribed users and latest price for next subscription under the script comment. If there are any conflicting scenario happened to the rules and my update. My updated price based on the rule will be the final price for next subscription. The following subscribers need to pay the corresponding amount of TVC or cryptocurrency in accordance with the latest number of users and price announced by me in accordance with the rules published.
TVC redemption is the method I strongly recommend, and I hope you can complete the redemption in the comment area of this script. This is like a blockchain structure, each comment is a block, each subscription is a chain, which is conducive to open and transparent publicity and traceability to avoid unnecessary disputes.
Monthly Subscription Charges
500TVC <50 Agrees (A)
50A<850TVC<100A
100A<1000TVC<150A
150A<1350TVC<200A
200A<1500TVC<250A
250A<1850TVC<300A
300A<2000TVC<350A
350A<2350TVC<400A
400A<2500TVC<450A
450A<2850TVC<500A
500A<3000TVC<550A
550A<3350TVC<600A
600A<3500TVC<650A
650A<3850TVC<700A
700A<4000TVC<750A
750A<4350TVC<800A
800A<4500TVC<850A
850A<4850TVC<900A
900A<5000TVC<950A
950A<5350TVC<1000A
1000A<5500TVC<1050A
And so on...
Annual Subscription Charges
5000TVC <50 Agrees (A)
50A<8500TVC<100A
100A<10000TVC<150A
150A<13500TVC<200A
200A<15000TVC<250A
250A<18500TVC<300A
300A<20000TVC<300A
350A<23500TVC<400A
400A<25000TVC<450A
500A<28500TVC<550A
500A<30000TVC<550A
550A<33500TVC<600A
600A<35000TVC<650A
650A<38500TVC<700A
700A<40000TVC<750A
750A<43500TVC<800A
800A<45000TVC<850A
850A<48500TVC<900A
900A<50000TVC<950A
950A<53500TVC<1000A
1000A<55000TVC<1050A
And so on...

ORB FX REPLAY - FINAL SAFEHere is the description in English, written to sound professional and meet all the requirements for publishing on TradingView:
Script Description:
Title: ORB Strategy Backtest Pro - Ultra Compatibility
Description: This is an Opening Range Breakout (ORB) strategy specifically designed for professional backtesting. It is optimized to run smoothly on external platforms like FX Replay and TradingView's replay mode.
Key Features:
Custom Session: Automatically calculates the High and Low of a specific time window (default: 10:00 - 10:15 Bucharest/GMT+2).
Impulse Confirmation: Features a "Min Impulse" filter to ensure entries happen on strong momentum, avoiding "fake-outs" near the range boundaries.
Hard Target Management: Designed for "Set & Forget" backtesting. Once a trade is triggered, the script tracks it until it hits either the Stop Loss (SL) or the final Take Profit 3 (TP3).
Visual Projections: Draws clear, real-time lines for Entry, SL, and TP3 on the chart for easy visual tracking.
Automated Statistics: Includes a dynamic label system that tracks Total Trades, Win Count, and Loss Count based on the TP3/SL logic.
Optimized Code: Built using Pine Script v5 with a focus on stability and compatibility, avoiding complex tables that often cause errors on external engines.

SmartManiacSmartManiac — Smart Money Liquidity & Sentiment Indicator
Overview
SmartManiac is a comprehensive Smart Money Concepts (SMC) indicator that combines liquidity structure analysis with volume delta sentiment detection. It automatically maps key liquidity levels, identifies Fair Value Gaps (FVGs) across multiple timeframes, and detects potential reversal points using a multi-factor scoring system based on volume delta, liquidations, and price action.
Features
Liquidity Structure Mapping
Previous Day/Week/Month High & Low (PDH/PDL, PWH/PWL, PMH/PML) — automatically detected and drawn with priority-based labeling
Buy-Side & Sell-Side Liquidity (BSL/SSL) — swing highs and lows that act as liquidity targets
Session High/Low — Asia, London, and New York session levels with customizable times
Smart level merging — nearby levels are consolidated using ATR-based tolerance to reduce clutter
Swept level tracking — lines change to dashed/dotted when price sweeps through them
Fair Value Gap (FVG) Zones
Multi-timeframe FVG detection: 5m, 15m, 1H, 4H, Daily, Weekly
Auto-filtering based on chart timeframe — prevents lower TF clutter on higher TF charts
Status tracking: Untouched → Touched → Half-filled → Fully filled
Sweep FVGs — special zones created when FVG forms immediately after a liquidity sweep
Sweep Imbalances
Detects FVGs that form right after liquidity sweeps
Shows pending zones in gray, changes to green (bullish setup) or red (bearish setup) when price returns to the zone
Helps identify potential reversal entries after stop hunts
Volume Delta & Sentiment Analysis
Aggregated volume from multiple exchanges for accurate delta calculation
Z-score based extreme detection for buying/selling pressure
Cumulative Volume Delta (CVD) tracking
Peak FOMO / Depression Signals
4-factor percentile scoring system:
Factor 1: Delta Z-score before reversal (buying/selling pressure buildup)
Factor 2: Volume spike + price reversal bar
Factor 3: Delta reversal confirmation
Factor 4: Liquidations spike (requires external data source)
Signals show as 🔥 (FOMO top) or 💎 (Depression bottom)
Size varies by strength (tiny = moderate, small = strong)
Requires prior price move + reversal bar confirmation to reduce false signals
Sweep Visualization Boxes
Visual representation of liquidations and delta at sweep points
Box length normalized by √(line_length) for fair comparison
Helps assess sweep "quality" — stronger sweeps may lead to stronger reversals
Sweep Confirmation Markers
After a sweep, watches for 3 confirmation factors within 5 bars:
Opposite candle color
Opposite-side liquidations
Opposite-side delta
Shows - marker when all 3 confirm
Risk State Background
Optional background coloring for Risk-Off (selling + long liqs) and Risk-On (buying + short liqs) states
Helps identify broader market sentiment regime
Debug Inspector
Moveable vertical line to inspect any bar's factor values
Useful for understanding why signals triggered or didn't trigger
How to Use
Liquidity Levels — Watch for price approaching PDH/PDL/PWH/PWL/PMH/PML and BSL/SSL levels. These are likely targets for stop hunts.
Sweep + FVG — After a sweep (level turns dashed), look for an FVG to form in the opposite direction. Gray sweep FVG turning green/red indicates potential entry zone.
Peak Signals — 🔥 appears at potential tops after strong rallies with extreme buying that reverses. 💎 appears at potential bottoms after drops with extreme selling that reverses. Hover over labels to see factor breakdown.
Confirmation Dots — Green - below price = bullish sweep confirmed. Red - above price = bearish sweep confirmed.
Settings
The indicator offers extensive customization:
Toggle each feature on/off independently
Customize colors and transparency for all elements
Adjust sensitivity thresholds for signals
Configure session times for your timezone
Set liquidations data source from external indicator
External Data
For Factor 4 (Liquidations), connect an external liquidations indicator:
Add a liquidations indicator to your chart (e.g., TradingView's native Liquidations indicator)
In SmartManiac settings, select the Long and Short liquidation plots as sources
Note: TradingView's native indicator has inverted labels — swap if needed
Notes
Best used on liquid markets with volume data (BTC, ETH, major forex pairs)
Higher timeframes (1H, 4H) tend to produce more reliable signals
Combine with your own analysis — no indicator is 100% accurate
Liquidations data significantly improves signal quality but is optional
Credits
Developed by @cybermediaboy, 2025. Methodology partially based on CryptoVolium's Smart Money approach.

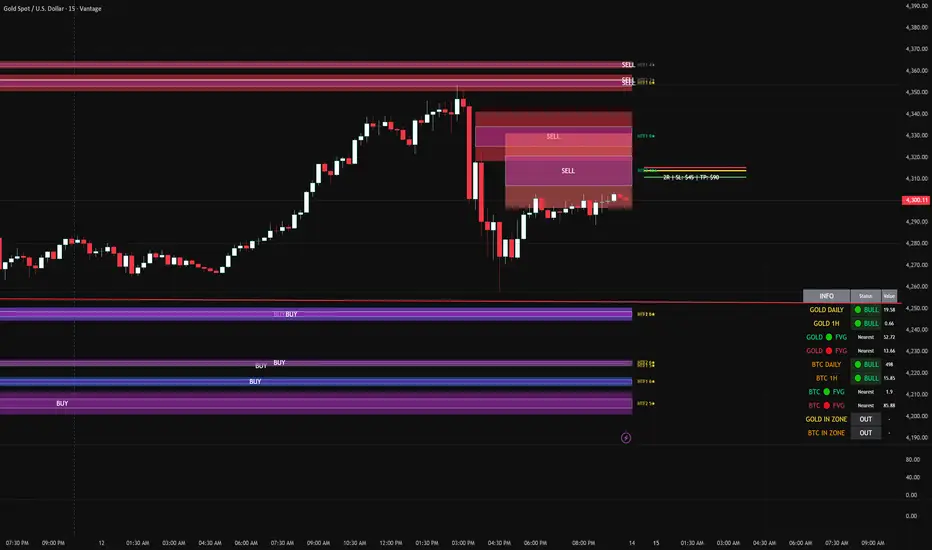
FVG DUAL HTF ALERTS FINAL DG FVG Dual HTF - Advanced Fair Value Gap Detector with Confluence & Strength Analysis
Professional-grade Fair Value Gap (FVG) detection system designed for precision trading on Gold and other instruments.
🎯 Key Features
Dual Higher Timeframe Analysis
HTF1 & HTF2 Detection: Simultaneously monitors two higher timeframes (default: 15min & 60min) for Fair Value Gaps
Multi-timeframe Confluence: Automatically detects when FVGs align across multiple timeframes for high-probability setups
Customizable Timeframes: Choose from 5min, 15min, 60min, 4H, or Daily for each HTF
Intelligent Strength Scoring System (0-11 Scale)
Our proprietary algorithm rates each FVG based on:
Gap size relative to ATR
Volume analysis vs. average
Current timeframe confluence (★ symbol indicates FVG exists on your chart timeframe)
Session timing (London & New York priority)
HTF confluence bonus
Color-Coded Ratings:
🟢 Lime (8-11): Premium strength - highest probability setups
🟡 Yellow (5-7): Good strength - solid opportunities
⚪ Gray (0-4): Weak strength - proceed with caution
Sweet Spot Entry Zones
Inner Box Technology: Highlights the optimal 10% entry zone within each FVG
BUY/SELL Labels: Clear visual cues for directional bias
Automatic Entry/Stop/Target Lines: Shows precise risk-reward setups on the 3 nearest FVGs
Position Sizing Calculator: Displays dollar values based on your lot size
Advanced Fill Methods
Choose how FVGs are invalidated:
Wick Sweep: Most conservative - requires price to sweep through the gap
Any Touch: Price touches the FVG boundary
Midpoint Reached: 50% fill required
Body Beyond: Strictest - candle body must close through the gap
Comprehensive Market Intelligence Table
Real-time monitoring of:
Gold Daily & Hourly Bias (with pip movement)
BTC Daily & Hourly Bias (optional)
Distance to nearest Bull/Bear FVGs
IN ZONE Indicator: 🔥 Alerts when price enters premium sweet spots
Shows strength rating and HTF source
Color-coded: Premium / Good / Weak / Out
Professional Alert System
HTF1 & HTF2 Zone Entry Alerts
Sweet Spot Entry Alerts (BUY/SELL)
High-Strength FVG Alerts (8+ rating)
Combined "ANY HTF" alerts for maximum flexibility
📊 Default Configuration
Optimized for Gold (XAU/USD) on 3-minute charts
Session Focus: London (8am-12pm GMT) & New York (1:30pm-4pm GMT)
Risk Management: Built-in R:R calculator with customizable stops and targets
🎨 Customization Options
Multiple color schemes for bull/bear zones
Adjustable inner box percentage
Confluence highlighting (bright colors when HTF1 & HTF2 align)
Show/hide individual components
BTC correlation tracking (optional)
⚙️ Technical Specifications
Maximum Display: Up to 50 FVGs per type (HTF1 Bull/Bear, HTF2 Bull/Bear)
Fill Tracking: Monitors touched vs. untouched zones
Lookback Period: Configurable (default: 100 bars for current TF confluence)
Body Close Requirement: Optional strict mode for cleaner signals
📈 Best Used For
Gold (XAU/USD) day trading
Institutional order flow analysis
High-probability reversal setups
Multi-timeframe confirmation strategies
Risk-reward optimization
🔒 Access & Support
This is a private indicator. Contact the owner for details about access and usage.
Disclaimer: This indicator is a tool for technical analysis. Past performance does not guarantee future results. Always use proper risk management and trade responsibly.
Short Version (if space is limited):
FVG Dual HTF - Professional Fair Value Gap System
Advanced FVG detector with dual higher timeframe analysis, intelligent strength scoring (0-11), and multi-timeframe confluence detection. Features sweet spot entry zones, automatic R:R lines, real-time IN ZONE alerts, and comprehensive market intelligence table.
Highlights:
🎯 Dual HTF monitoring (15m/60m default)
⭐ Strength scoring with current TF confluence (★)
📊 Color-coded ratings: Lime (8+) / Yellow (5-7) / Gray (<5)
🎨 Sweet spot inner boxes with BUY/SELL signals
🔔 Professional alert system
💰 Built-in position sizing calculator
📈 Gold Daily/Hourly + BTC bias tracking
Optimized for Gold and BTC. Multiple fill methods, customizable colors, and extensive settings.
Contact owner for access details.
LHAMA MTF Structure & Fibs [LTS]Overview
LHAMA MTF Structure & Fibs is a multi-purpose market structure toolkit that combines current-timeframe structure, higher-timeframe structure, Imbalance/FVG-based order blocks, and automatic Fibonacci retracements into a single chart overlay.
Current-Timeframe Structure
The indicator first maps current-timeframe market structure using swing highs and lows based on a user-defined pivot length (“Time-Horizon”):
Labels swing points as HH , HL , LH , and LL .
Draws BOS (Break of Structure) when price breaks beyond a prior swing.
Optionally identifies CHoCH (Change of Character) when a break occurs against the previous direction.
Lets you choose whether BOS/CHoCH confirmation uses closes or wicks .
Provides options to show/hide swing labels, choose line style (solid/dashed/dotted), and configure bullish/bearish colors.
Higher-Timeframe (HTF) Structure
On top of the local structure, the script builds a higher-timeframe structure map and projects it onto your active chart:
Aggregates price into HTF “bars” (e.g., 4h structure on a 5m chart).
Detects HTF pivots with their own pivot length setting.
Draws HTF BOS/CHoCH lines and labels back on the lower timeframe.
Lets you choose wick vs close confirmation for HTF breaks.
Optional “ pending ” HTF levels: lines extended from the latest HTF swing highs/lows that remain “waiting” until price breaks them.
This is designed to make it easier to see how intraday price is moving relative to the dominant higher-timeframe trend.
Order Blocks (Imbalance/FVG-Based)
The indicator detects simple bullish and bearish order blocks based on fair value gaps and prior sweeps:
Identifies bullish/bearish FVGs together with a sweep of a previous low/high.
Creates colored boxes anchored to an “anchor” candle and extends them forward.
Marks boxes as “broken” when price trades inside or through the opposite side.
Broken blocks can have reduced emphasis (more transparent, dashed border) and can optionally be deleted.
Show Nearest Only mode highlights only the closest active bullish and bearish blocks to reduce chart clutter.
Periodic cleanup removes very old boxes to maintain chart responsiveness.
Automatic Fibonacci Levels
The script can draw up to five customizable Fibonacci retracement levels using the HTF structure logic:
Measures swings using HTF pivots and extremes.
Historical mode : measures between two confirmed pivots in one direction.
Live mode : starts from the last confirmed pivot and tracks the evolving extreme; if price reverses through that pivot, measurement can flip to track the new leg.
Each Fib level has its own on/off toggle, ratio value, and color.
Draws a main swing line plus retracement lines projected slightly into the future.
Key Inputs & Customization
Market Structure (Current TF)
Pivot length (“Time-Horizon”).
BOS confirmation: candle close or wicks.
BOS/CHoCH line style and width.
Swing labels on/off and global label size.
Bullish/bearish colors.
Market Structure (HTF)
HTF timeframe selection.
Separate pivot length for HTF swings.
Close vs wick confirmation for HTF breaks.
HTF swing labels and CHoCH labels on/off.
Pending HTF levels: style, color, and visibility.
Order Block Settings
Bullish/bearish box colors and border width.
Maximum number of boxes to display.
Optional deletion of broken blocks.
“Show Nearest Only” filter to highlight the closest active zones.
Max bars to backscan for the anchor candle.
Cleanup frequency for removing very old boxes.
Fibonacci Settings
Show/hide auto Fibs.
Historical vs Live tracking mode.
Five user-defined ratios with individual toggles and colors.

Dix$ons Tackle BoxDixsons Tackle Box — Multi-Tool Trend & Levels Suite (MA/EMA + VWAP + BB + Adaptive Trend Channels + Auto Fibs)
---
**Dixsons Tackle Box** is an all-in-one overlay for traders who want a clean chart with *stacked edge* instead of stacked indicators.
It combines:
* A **5-slot MA/EMA pack** with live slope % labels and MTF smoothing
* A **full VWAP engine** with event-based anchors, trend angle coloring, and VWAP bands
* **Bollinger Bands** with volatility-aware coloring and optional gradient background
* A **Short-Term & Long-Term Adaptive Trend Channel (ATC)** with automatic period detection, log-regression channels, and performance tables
* A **Dixson Auto Fibonacci suite**: ATR-based “rail” Fibs + Lookback Fibs off HH/LL, both driving a shared, fully customizable Fib bank
Everything is controlled logically by feature groups under the **“Tackle Box”** section, so you can quickly turn modules on/off and tune the tool to your style (scalp, intraday, swing, or position).
> **Important:** This is an analysis/visualization tool only. Nothing here is financial advice or an automatic trading system. Always test and manage risk yourself.
---
## 1. MA/EMA Pack — 5 Smart Averages with Slope %
**Group:** `Tackle Box` + per-slot groups `MA/EMA 1` … `MA/EMA 5`
**Main toggle:** `Enable MA's`
**Per-slot master row:** `_maRow1` … `_maRow5`
### What it does
This module gives you **five independent MA/EMA slots**, each with:
* Its own **type** (MA or EMA)
* **Length**, **color**, **line width**, and **plot style** (`Solid`, `Step`, or `Circles`)
* **Timeframe per slot** (MTF)
* Rich **label controls** (slope %, length/type text, timeframe text, etc.)
* **Label size** per slot (`tiny → huge`)
On top of that, each average has a **live slope % readout**, normalized by instrument tick size, so you can compare trend steepness across assets.
### Key features
* **Master slot row (1–5):**
In the `Tackle Box` group you have `_maRow1`–`_maRow5` toggles. These gate each slot globally, so you can quickly show/hide specific MAs without digging into each slot.
* **MTF Smoothed Mode:**
* `MTF Smoothed Mode` (on by default) makes higher-timeframe MAs **update only when the HTF bar closes (and on the last bar)**.
* That reduces the stair-stepping noise you often get when pulling HTF data onto an LTF chart, while still giving you accurate levels and a smooth, tradeable line.
* **Per-slot label text controls:**
Each MA group has toggles to control exactly what the label shows:
* `Show Label` – show/hide label entirely
* `Slope` – append slope % to the label
* `Len+Type` – show e.g. `50EMA` or `200MA`
* `TF` – show HTF name if the slot is on an MTF
* `'slope' text` – optionally include the word `slope` in the label
* **Slope % (angle) logic:**
Slope for each MA uses a normalized **“angle %” in **, based on the 1-bar change vs `syminfo.mintick`.
* Big positive values = strong uptrend
* Big negative values = strong downtrend
* Near zero = flat/neutral
This makes it easy to build rules like:
* “Only trade long if the **50EMA slope** is above +20% and price is above VWAP”
* “Take profit if slope on my faster MA collapses back toward 0.”
### Typical use
* Slot 1–2: **fast intraday EMAs** (e.g., 9 / 20 EMA)
* Slot 3–4: **structural EMAs/MAs** (e.g., 50 / 200)
* Slot 5: a **dedicated MTF trend filter** (e.g., 5-minute or 1-hour EMA on a 1-minute chart)
---
## 2. VWAP Engine + Bands — Anchor-Aware, Angle-Aware VWAP
**Group:** `Enable VWAP` + `------ VWAP Settings ------`, `Bands Settings`, `Color Settings`
### Core VWAP
* **Anchors:**
`Anchor Period` lets you choose where each VWAP reset starts:
* `Session` (day session VWAP, perfect for intraday)
* `Week`, `Month`, `Quarter`, `Year`, `Decade`, `Century`
* Corporate events: `Earnings`, `Dividends`, `Splits`
This lets you build VWAP logic around:
* **Intraday mean reversion** (Session VWAP + bands)
* **Swing anchor VWAPs** (Weekly/Monthly)
* **Event-based anchors** (earnings/dividend/split reaction)
* **Hide on DWM:**
`Hide VWAP on 1D or Above` lets you keep intraday VWAP from cluttering higher-TF charts.
* **Angle/Trend Detection:**
The VWAP engine computes a **regression slope** over each anchor segment and converts it to an **angle %**:
* `Angle Lookback (bars)` controls how many bars are used
* `Angle Trend Threshold (%)` sets the threshold where a slope is considered “trending”
With `Color VWAP by Trend` enabled:
* Uptrend > threshold → VWAP turns **trend up color** (e.g., lime)
* Downtrend < −threshold → VWAP turns **trend down color** (e.g., red)
* Inside threshold → VWAP uses a neutral color
You can also set separate **line widths** for neutral vs trend state and transparency to give a “Hull-style” visual feel.
* **VWAP Labels:**
You get a single, de-duplicated VWAP label on the last bar with:
* Optional **name** (`VWAP`)
* Optional **price** (`$xxx.xx`)
* Optional **angle %** and optional `"slope"` word
* Global **label size** for VWAP + bands
### VWAP Bands
* **Calc modes:**
`Bands Calculation Mode`:
* `Standard Deviation` – classic VWAP ± n * σ
* `Percentage` – bands as a fixed % of VWAP
* **Bands 1-3:**
Each band has:
* Visibility toggle, independent multiplier (`×`)
* Separate **upper/lower colors** per band
* Optional **fill** between upper/lower for each band
* Label toggles:
* `Show All Labels`
* `Show Band #X Label`
* `Band Labels: Show Names` (VWAP+1, VWAP-1, etc.)
* `Band Labels: Show Prices`
This lets you configure anything from a minimalist “just VWAP + 1 band” view to a full 3-band ladder.
### VWAP Highlight Fill
* **Premium/discount shading**:
Optional fill that shades:
* Region **above VWAP** when price is above (e.g., greenish)
* Region **below VWAP** when price is below (e.g., reddish)
This makes it extremely easy to see when price is trading at **premium vs discount** relative to the current anchor VWAP.
### Typical use
* Intraday scalpers: Session VWAP + 1–2 bands + highlight fill
* Swing traders: Weekly/Monthly VWAP + only the main line and label
* Event traders: Earnings-anchored VWAP, tracking post-earnings drift
---
## 3. Bollinger Bands — Volatility-Aware BB with Gradient Fill
**Group:** `Enable Bollinger Bands` + `------ Bollinger Band settings ------`
### What it adds
A clean Bollinger Band overlay designed to play nicely with the VWAP/MA stack:
* `Bollinger Bands Length` (default 20)
* `Bollinger Bands Multiplier` (default 2.0)
* `BB Basis Color` & **line width**
* Upper/lower bands colored based on **width change**:
* Expanding volatility → `BB Expanding Color`
* Contracting volatility → `BB Contracting Color`
You can also toggle:
* `Show Center Line MA Label` – prints something like `20ma` on the last bar.
* `Enable Gradient Background Fill` – draws a gradient between price and the bands:
* `Gradient Fill Up Color` for below-price fill
* `Gradient Fill Down Color` for above-price fill
### Why it’s unique here
Instead of just static bands, this implementation **flags volatility regimes** (expansion vs contraction) via color and optional gradient. That pairs nicely with ATR Fibs and VWAP:
* Use **BB contraction (squeeze)** + flat VWAP angle to anticipate breakouts.
* Use BB + VWAP bands to filter which “touches” are genuinely overextended.
---
## 4. Dixson Adaptive Trend Channel (ATC) — Short-Term & Long-Term Log Channels
**Master toggle:** `Enable Adaptive Trend Channel`
**Groups:** `------ Dixson ATC Settings ------`, `Short-Term Channel Settings`, `Long-Term Channel Settings`, `Short-Term Midline Settings`, `Long-Term Midline Settings`, `Channel Trend Background Fill Settings`, `Short-Term Table Settings`, `Long-Term Table Settings`
### Under the hood
ATC is a **log-scale regression channel engine** that automatically:
1. Scans a set of candidate periods.
* **Short-term:** 20 → 200 bars
* **Long-term:** 300 → 1200 bars
2. For each period, it computes:
* Log-price regression slope & intercept
* Standard deviation of residuals
* A Pearson-style R value (trend “strength”)
3. Picks the period with the **highest correlation (|R|)** and uses that as the **detected trend length**.
This yields a **data-driven channel** that adapts to whatever trend the market is actually respecting.
> For long-term stats, annualized return only makes sense on **daily/weekly** charts. On intraday charts, treat the “Annual Return” purely as informational.
### Short-Term Channel
Controls in `Short-Term Channel Settings` + `Short-Term Midline Settings`:
* `Show Short-Term Channel` – on/off
* `Deviation Multiplier (Short-Term)` – how wide the channel is (in standard deviations)
* **Upper/Lower colors**, line width, style (Solid/Dotted/Dashed), transparency
* `Line Extension Style` – Extend Right / Extend Both / Extend None / Extend Left
Optional **Short-Term Midline**:
* Toggle + color, style, width, transparency
* Tracks the regression line itself (center of the channel)
Background fill:
* `Enable ST Background Fill` with separate **ST Uptrend** / **ST Downtrend** colors
* Trend direction is inferred from regression slope sign
### Long-Term Channel
Mirrors the ST controls with its own group:
* `Show Long-Term Channel`
* `Deviation Multiplier (Long-Term)`
* Upper/Lower channel colors, thickness, style, transparency
* `Line Extension Style`
* Optional Long-Term midline + colors/styles
* Optional **background fill** with separate colors for up vs down
You can run **both channels at once**, giving a panel of:
* **Macro trend structure** (Long-Term ATC)
* **Current swing trend** (Short-Term ATC)
* MAs, VWAP, and Auto Fibs on top for entries/exits
### Trend Info Tables
Each channel has its own table options:
* `Show Detected Period` (bars used)
* `Show Trend Strength` – either:
* Descriptive text: “Extremely Weak” → “Ultra Strong”, or
* Raw Pearson R value if `Show Pearson R` is enabled
* `Show Annualized Return` (when timeframe is daily/weekly)
* Table position (`Top Left`, `Bottom Right`, etc.)
* Text size (`Small`, `Normal`, `Large`)
These tables quantify:
* Over what lookback the trend is being measured
* How “clean” that trend is
* What the approximate annualized performance of that trend has been
---
## 5. Dixson Auto Fibonacci Suite — ATR Fibs + Lookback Fibs + Shared Fib Bank
**Master toggle:** `Enable Auto Fibonacci`
**Groups:** `Dixson Auto Fibonacci`, `ATR Auto Fib`, `Previous ATR Fib`, `Lookback Auto Fib`, `Lookback Anchor Overrides`, `Fibonacci Levels`
You get **two separate engines** (ATR-based and Lookback-based) that both draw from the **same customizable Fib bank**, with optional log scaling.
---
### 5.1 Global Auto Fib Settings
* `Logarithmic Scale`
* When ON, Fib levels are interpolated in log-space (better for assets that move in percentages).
* When OFF, interpolation is linear in price.
This applies to **both** the ATR and Lookback engines.
---
### 5.2 ATR Auto Fib (Rail-Based, Supertrend-Driven)
**Groups:** `ATR Auto Fib`, `Previous ATR Fib`
The ATR engine builds **“rails”** that hug price without letting candles touch them, then projects Fib levels between these anchors.
#### How it works
1. Uses built-in `ta.supertrend` with:
* `ATR Period`
* `ATR Multiplier`
2. Builds dynamic **upper and lower rails** around price:
* Uses ATR to define a **proximity gap** (`Proximity (×ATR)`) so rails stay **just outside the wicks** (no-touch behavior).
* Smooths raw highs/lows slightly (RMA) to avoid spiky rails.
* Ensures the upper rail is always ≥ high+gap and lower rail ≤ low−gap.
3. The **direction** (uptrend/downtrend) is inferred from the Supertrend direction:
* On trend flips, the script:
* Captures the prior rail pair as a **“previous segment”**
* Starts a new rail segment in the new direction
4. From these rails, the script draws **directional Fib “ladders”**:
* For the **current ATR Fib**:
* The Fib is drawn from one anchor to the other depending on the trend sign.
* Rays are projected `Ray Length` bars to the right of `Current Offset`.
* For the **previous ATR Fib**:
* The last completed segment’s start/end rails are used as anchors
* Rays are projected using `Prev Fib Offset` and `Prev Fib Length`
#### Current ATR Fib controls
* `Enable ATR Fib` – toggles current ATR Fib bank
* `ATR Period`, `ATR Multiplier` – control the “engine” behind the rails and ST logic
* `Current Offset`, `Ray Length` – where and how far rays are drawn
* `Show Level Text`, `Show Price`, `Display % not ratio` – label style
* `Label Size (Current ATR Fib)` – for all current ATR Fib labels
Visual extras:
* `Plot Hi/Low Anchor Lines` – shows upper/lower rails
* `Plot ATR Trailing Stop` – shows clamped Supertrend as a continuous line
#### Previous ATR Fib controls
* `Enable Prev ATR Fib` – toggles previous segment ladders
* Independent `Prev Fib Offset`, `Prev Fib Length`
* Separate label controls:
* `Show Level Text (Prev)`
* `Show Price (Prev)`
* `Display % not ratio (Prev)`
* `Label Size (Previous ATR Fib)`
Use the **current ATR Fib** as your active trading “ladder” and the **previous ATR Fib** to track recently broken structure and potential retest zones.
---
### 5.3 Lookback Auto Fib — HH/LL-Driven Fib Bank, MTF + Manual Overrides
**Group:** `Lookback Auto Fib` + `Lookback Anchor Overrides`
This engine draws Fibs between **highest high** and **lowest low** within a given lookback window on a chosen timeframe.
#### How it works
1. Select higher timeframe:
* `Lookback Timeframe` (empty = chart timeframe)
2. Choose your range:
* `Lookback Bars` – number of bars on the selected TF to scan for extremes
3. Optionally allow look-ahead:
* `Look-ahead Bars (repainting)`
* `0` = no look-ahead (no forward info, no repainting)
* `>0` = uses `barmerge.lookahead_on` for forward-looking extremes (can repaint)
4. For that range, the script finds:
* Highest high + its bar offset
* Lowest low + its bar offset
5. Trend direction is determined by **which extreme is more recent**:
* Recent high → **down** direction (high → low)
* Recent low → **up** direction (low → high)
6. Manual direction overrides:
* `Force Uptrend` / `Force Downtrend` – override the auto decision
7. Manual anchor overrides:
* `Manual Anchor High (LB)`
* `Manual Anchor Low (LB)`
If both are set, those become the anchors and direction is deduced from which is higher.
8. The engine then draws a **directional Fib ladder**:
* Anchors between high/low based on direction
* Rays extend `Lookback Fib Length` bars from `Lookback Fib Offset`
#### Label controls
* `Show Level Text`, `Show Price`, `Display % not ratio`
* `Label Size (Lookback Fib)`
* Labels are prefixed with `LB` to distinguish them from ATR Fibs.
This engine is ideal for:
* **Swing structure mapping:** Drawing Fibs across the last major swing on the HTF.
* **Confluence:** Aligning Lookback Fibs with ATR Fibs, ATC channel boundaries, and VWAP bands.
---
### 5.4 Shared Fibonacci Levels — Fully Custom Fib Bank for Both Engines
**Group:** `Fibonacci Levels`
The ATR and Lookback engines **both** use the same Fib bank:
* **Ratios provided by default:**
* 0.000
* 0.146
* 0.236
* 0.382
* 0.500
* 0.618
* 0.650
* 0.707
* 0.786
* 0.886
* 1.000
* 1.130
* 1.272
* 1.618
* 2.000
Each ratio has its own:
* `Enable Level X.XXX`
* `Level X.XXX` (the actual ratio – fully editable)
* `Thickness X.XXX` (line width)
* `Style X.XXX` (Solid / Dashed / Dotted)
* `Color X.XXX` (line + label color)
Adjusting a level here **instantly updates both** ATR and Lookback ladders. This makes it very easy to:
* Run “standard” Fib sets for classic retracements
* Or define your **own Fib presets** (e.g., 0.25 / 0.5 / 0.75, or custom extension clusters)
---
## How to Use & Suggested Workflows
**Scalpers / 0DTE / Intraday:**
* Enable:
* MA/EMA pack (fast EMAs + one MTF slot)
* VWAP (Session anchor) + 1–2 VWAP bands + highlight fill
* ATR Auto Fib (current + previous)
* Optionally hide:
* Lookback Fibs
* Long-Term ATC (unless you want HTF bias on your intraday chart)
Use slope labels, VWAP angle %, and ATR Fib ladders to structure trades around pullbacks, mean reversion, and breakouts.
**Swing / Position traders:**
* Turn on:
* Long-Term ATC (with table)
* Short-Term ATC for swing structure
* Lookback Auto Fib on a higher timeframe (e.g., D on 4H chart)
* Keep VWAP anchored to Week or Month, and MA slots for key reference MAs.
Use ATC channels for **trend structure**, Lookback Fibs for **swing levels**, and long VWAPs for **value zones**.
---
## Final Notes & Disclaimer
* Works on **all symbols** and **all timeframes**, but some stats (like “Annualized Return”) are only meaningful on **daily/weekly** data.
* Some options (like Look-ahead mode for Lookback Fibs) can **repaint** on purpose. These are clearly labeled — use them only if you understand and want forward-looking behavior.
* This script does **not** place trades. It is a visual / analytical tool only.
* Nothing in this indicator or description is financial advice. Always do your own research, forward-test, and manage risk appropriately.
If you have **invite-only access** to **Dixsons Tackle Box**, you’re getting the full Dixson overlay stack in one place — designed to be the central “hub” for your chart, not just another line on it.

RT-Machine Learning Reversion BandsMachine Learning Reversion Bands is a support and resistance tool designed to highlight where trends have historically reverted and where price is pushing into unusually extreme territory. It plots two sets of bands around price so traders can see both standard reversion zones and more extreme, machine learning levels that adapt and learn from the chart over time.
Introduction
The Machine Learning Reversion Bands tool utilizes an algorithm that learns from the chart’s full visible history. Instead of manually scanning through years of candles, the script studies the data and builds machine learning bands that respond to how the asset has actually behaved over time.
This version retains the original red and green Reversion Bands and adds a second set of dynamic Machine Learning Bands that adapt to volatility. This gives the trader four levels to reference: Red and Green Reversion Bands for more traditional support and resistance reversion zones.
Cyan and Orange Machine Learning Bands that adapt as new extremes form on the chart. The red and green bands are tuned for more typical reversion behavior, while the cyan and orange bands are focused on those moves where price stretches beyond its usual range. This can help frame potential entries, exits, and risk around both normal and more extreme conditions.
Support Versus Resistance
Machine Learning Reversion Bands tracks four main levels of support and resistance:
Green and Red Bands - Standard Reversion Bands
These bands mark more common reversion points for many assets. They highlight areas where trends have historically run into exhaustion and reverted back toward the mean. When price approaches these zones, it is often interacting with regions where prior swings have slowed, paused, or reversed.
Cyan and Orange Bands - Machine Learning Reversion Bands
The cyan and orange band algorithm studies the asset by looking back at every candle that is available on the chart (as far as the user can scroll left). If there is a decade of data, the algorithm will use that full decade to learn how the asset has behaved in the past and then project where these cyan and orange bands should be overlaid.
In short, these ML bands give traders a view of where the tool estimates the more extreme extensions of a trend may be, based on historical behavior. In many cases, price will only touch the cyan and orange bands when it is moving into unusually strong or weak levels relative to its own past. Each time trends reach these orange or cyan levels, the tool updates from that price action so that its future projections continue to reflect what has already been seen.
A historical example of the cyan bands adapting to extreme bullish behavior on a DOGE chart.
A historical example of the cyan bands projecting resistance levels in an extremely bullish trend.
A historical example of the orange bands adapting to an EOS chart.
A second historical example of the orange bands adapting to a Ford chart.
Example Charts
The following examples show how price has interacted with the bands in specific historical periods. They are intended as illustrations of behavior, not as performance guarantees:
Tron - H4 - TRXUSDT - December 2024
Nvidia - H4 - NVDA - March 2020 Tesla - H4 - TSLA - April 2022 These historical example charts can be used to visually review how price has interacted with the bands in the past. They are illustrations of behavior, not performance statistics.
Settings and Tuning
Reversion Alert Markers are used to visualize when price is interacting with the bands and to help traders monitor potential reversion events. When enabled, these markers plot whenever price meets the internal conditions for a reversion touch inside one of the bands.
These markers can be toggled on and off in the settings of the tool. The markers can also be set to custom text/emojis per the trader's preferences:
The Bands can also be adjusted manually to fine tune the chart specifically to the asset that the trader is buying/selling: Smoothness Adjuster - Adjusts how sensitive the Bands are to price action.
Top Bands Height Adjuster - Adjusts the vertical height of the Upper Bands.
Bottom Bands Height Adjuster - Adjusts the vertical height of the Lower Bands. The Bands themselves can also be adjusted visually to suit each trader's preference. The borders of the Reversion Bands as well as the shading of the Reversion Bands themselves can be adjusted to be brighter or darker by adjusting these two settings:
Band Transparency Adjuster - Adjusts the opacity of the Reversion Bands.
Border Transparency Adjuster - Adjusts the opacity/brightness of the Borders that are drawn around the Bands. Example of the Reversion Bands and the Borders being set to be extremely bright: Example of the Reversion Bands and Borders set to be more transparent: The colors of the Bands and Borders can also be adjusted to meet the preferences of the trader. Below you can see each Band color being adjusted: Candle Filtering is an advanced tuning option that traders can use to enable the Reversion Alert Markers to only trigger during extreme price action movements that are tracked using the RT-Main Indicator.
Below is an example of Reversion Alert Markers operating in conjunction with the Colored Candles of the RT-Main Indicator running the default settings. By default, every candle color will trigger an Alert Marker when inside the Reversion Bands:
With Candle Filtering options enabled, the trader can set their chart to only display Alert Markers for White and Pink Candles that print from the RT-Main Indicator inside the Reversion Bands: For traders that utilize custom tunes on the RT-Main Indicator, the Reversion Bands Tool also has settings that can be used to bring the Pink/White Candle Filtering in synch with custom Candle Settings of the RT-Main Indicator:
Alert Automation
When setting up alerts for this tool, traders generally follow these parameters: 1st Condition - Select the RT-Machine Learning Reversion Bands Indicator.
2nd Condition - Select the desired alert condition that you want to monitor:
Entering Green Band | Cyan Band | Red Band | Orange Band.
Interval - Select Same as Chart.
Trigger - Select Once Per Bar Close.
This approach allows the tool to serve as a visual and alert-based context layer for potential reversion areas, while entries, exits, and order execution remain under the trader's control.
How Traders Commonly Use The Bands
Some common ways traders incorporate Machine Learning Reversion Bands into their workflow include:
Using the Green and Red Bands as reference points for more "typical" mean reversion areas within an ongoing trend.
Watching the Cyan and Orange Bands for rare extensions that may mark areas of extreme strength or weakness relative to the asset's historical behavior.
Combining Band touches with other tools such as RT-Main Indicator, pivots, or volume context to build confluence around potential trade locations.
Reviewing past behavior in Replay mode to see how different assets have reacted to Band touches during various market regimes.
The tool is designed to act as a support and resistance map that adapts to each asset's history, rather than a rigid rule set.
What Makes This Tool Different
While many indicators draw static channels or volatility bands, Machine Learning Reversion Bands are designed to:
Retain the familiar behavior of the classic Red and Green Reversion Bands while adding a second Machine Learning layer.
Learn from all available chart history to estimate where more extreme extensions have historically occurred in the past.
Provide four distinct Band levels so traders can distinguish between normal reversion zones and more unusual extremes.
Offer optional markers and alert integration so reversion interactions can be tracked without watching every candle.
Important Note
Machine Learning Reversion Bands are intended to provide additional context around support, resistance, and potential mean reversion zones. They are not a standalone signal generator and should always be used together with your own analysis, testing, and risk management. Historical interactions with the Bands, including any back-test style examples, do not guarantee future results.
🐋 Tight lines and happy trading!

Smart Range Breakout System (Zeiierman)█ Overview
Smart Range Breakout System (Zeiierman) is a full breakout–trend–risk framework engineered around volatility compression, adaptive range detection, and a volatility-adaptive structural mapping layer that continuously reshapes itself as price migrates away from compression zones. Rather than reacting to simple line breaks, the system identifies statistically quiet regimes, models the expansion phase as momentum re-enters the market, and then deploys a unified architecture of trend projection, dynamic trailing stops, and risk–reward structuring that evolves in real time with the unfolding move.
This tool is designed for traders who want a self-contained breakout workflow: first detect valid ranges, then trade the expansion, then manage the trend and exits via automatically generated levels and alerts.
⚪ Why This One Is Unique
The core engine combines a custom price-contraction model with volatility-responsive boundary levels to detect when the market is transitioning between quiet and active phases. From this model, the script generates a smoothed synthetic average that acts as the reference point for identifying compression zones and validating breakout conditions. Using this foundation, the system builds a complete visual trade map: breakout boxes that mark consolidation, breakout markers that signal expansion, a trend cloud that tracks directional bias, adaptive trailing stops that follow price movement, and optional risk-reward levels that automatically adjust to each new breakout.
Unlike conventional breakout indicators that rely on a single high/low lookback, this system uses:
A price contraction engine that re-weights candle structure through a momentum-like transform, generating a stabilized price that better captures compression and release.
An adaptive low-volatility counter that waits for statistically quiet behavior before declaring a range.
█ Main Features
⚪ Breakout Signals With Dynamic Risk-Reward Levels
The system identifies meaningful breakouts emerging from compressed price zones and immediately maps a complete trade structure around each signal.
Each breakout generates:
Directional breakout markers to confirm expansion
Entry, Stop, TP1, and TP2 levels that are automatically projected
A dynamic trailing stop is added to lock in profits as the price moves
Risk and reward zones visualized through adaptive fills
Labels that update in real time as targets are reached or invalidated
This creates a clear, self-contained decision map that helps traders evaluate opportunities, manage risk, and track the progression of each breakout without manual calculations.
⚪ Trend Cloud
A continuously updating Trend Cloud highlights the active directional regime and offers immediate visual trend identification through its color-coded bias. It shows whether a breakout aligns with the prevailing direction, provides a smoother and more stable representation of the trend than raw price alone, and creates an intuitive backdrop for distinguishing trend-following opportunities from countertrend setups. By filtering out noise and emphasizing directional stability, the cloud helps improve timing, signal quality, and overall alignment with the dominant market structure.
█ How to Use
⚪ Breakout Trading from Range Boxes
1. Identify Compression Zones
Look for periods where the Range Breakout Box appears: this signals a statistically quiet regime where price has compressed around a bounded range.
The box top and bottom approximate the upper and lower bounds of the market’s recent equilibrium.
2. Trade the Expansion
Bullish Breakout:
Triggered when the synthetic price crosses above the box top.
A green breakout marker appears below the price (triangle up).
This signals that price is breaking out of the compression zone with enough momentum to establish a meaningful structural move to the upside.
Bearish Breakout:
Triggered when the price crosses below the box bottom.
A red breakout marker appears above the price (triangle down).
Signals a breakdown out of the range to the downside.
⚪ Trend Following with the Trend Cloud
The Trend Cloud is a volatility-responsive band that adjusts to the system’s internal trend. In bullish conditions, it shifts to the up-color beneath price, and in bearish conditions, it flips to the down-color above price, giving a clear visual read of market direction.
The cloud effectively separates impulsive trend legs from noise, so you can align breakout trades only with the dominant directional regime.
Long Setups
Favor long setups (Break Up) when the price is traveling above or inside a bullish cloud.
Short Steups
Favor short setups (Break Down) when the price is below or inside a bearish cloud.
Ignore counter-trend breakouts that form directly against a strong, stable cloud unless you are intentionally trading mean reversion.
⚪ Breakout Management and Risk-Reward
Once a breakout occurs, the system instantly activates a directional trailing stop that follows the trend. For long setups, the stop stays below the price and moves upward as momentum builds. For short setups, it stays above the price and moves downward as the trend strengthens. If price hits the trailing stop, an X-cross appears on the chart to mark the exit, and the stop is reset for the next signal. You can adjust the sensitivity to make the stop tighter or more relaxed, depending on your preference.
When Risk-Reward Levels are enabled, the script also builds a complete trade structure around the breakout. It places an entry line at the breakout close, and projects two target levels forward. The area between entry and stop is shaded as risk, while the area toward the targets is shaded as reward. Labels update automatically as targets are reached, turning into a clear confirmation mark when a level is hit and signaling with an icon if the stop is touched.
Together, the trailing stop and risk-reward ladder create a clear, real-time map of each breakout’s progression, helping you manage risk, monitor targets, and follow the move with structure and confidence.
█ How It Works
⚪ Compression Detection & Range Formation
The system identifies quiet market phases where price contracts into narrow zones and stabilizes around a synthetic equilibrium level. These zones form the foundation for valid breakout opportunities.
Calculation: Persistence-based boundary tracking with volatility-normalized change detection and equilibrium anchoring to identify statistically constrained price regimes.
⚪ Breakout Engine
Breakouts occur only when the internal average breaks out of a validated compression zone, confirming that the market is transitioning from containment to expansion.
Calculation: Boundary-crossing logic on dispersion-expanded structures with directional state shifts encoded through threshold-gated transitions.
⚪ Trend State
A dynamic trend state guides directional bias, while the Trend Cloud visually expresses this bias directly on the chart, shifting beneath or above the price depending on the active regime.
Calculation: Dual-regime state modeling using filtered directional vectors, volatility-responsive offsets, and continuity enforcement to avoid noise-driven flips.
-----------------
Disclaimer
The content provided in my scripts, indicators, ideas, algorithms, and systems is for educational and informational purposes only. It does not constitute financial advice, investment recommendations, or a solicitation to buy or sell any financial instruments. I will not accept liability for any loss or damage, including without limitation any loss of profit, which may arise directly or indirectly from the use of or reliance on such information.
All investments involve risk, and the past performance of a security, industry, sector, market, financial product, trading strategy, backtest, or individual's trading does not guarantee future results or returns. Investors are fully responsible for any investment decisions they make. Such decisions should be based solely on an evaluation of their financial circumstances, investment objectives, risk tolerance, and liquidity needs.

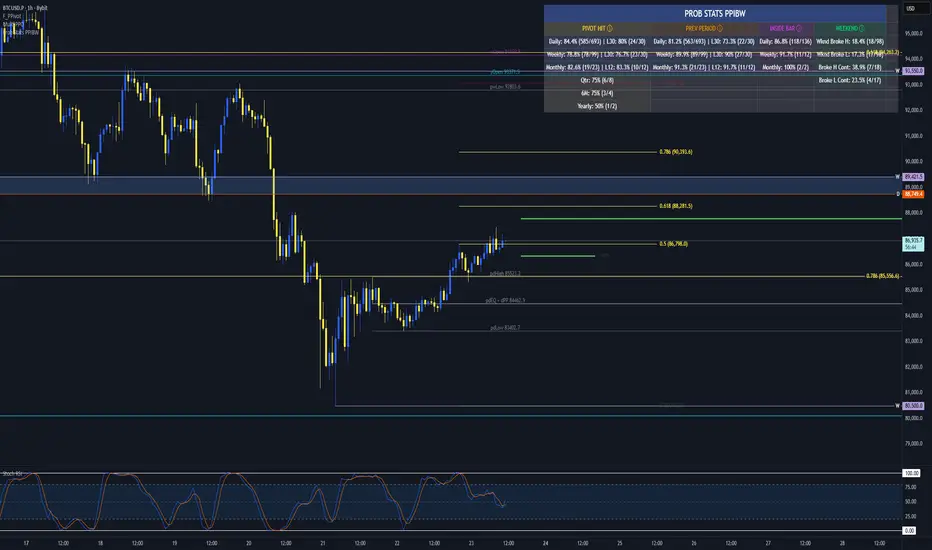
Prob Stats PPIBW Prob Stats PPIBW - Data-Driven Trading Decisions
Transform historical price patterns into actionable probabilities. This indicator analyzes thousands of periods to show you the real odds behind pivot hits, range
expansions, inside bars, and weekend breakouts.
What It Tracks
Pivot Hit Rates (D/W/M/Q/6M/Y)
What percentage of pivot points get touched during their period? Includes recent period comparison to spot regime changes.
Example: "Daily: 82.3% (450/547) | L30: 76.7% (23/30)"
Previous Period Levels (D/W/M)
How often does current period break previous period's high or low? Only counts actual range expansion, not equilibrium crossings. Helps gauge breakout probability.
Inside Bar Analysis (D/W/M)
When price consolidates inside previous period's range, what are the odds of a breakout? Only appears when currently in an inside bar.
Weekend Breakdown
When Sat/Sun breaks Mon-Fri range, does the following week continue? Critical for crypto traders and weekend gap analysis.
Key Features
- Recent Period Comparison: See if recent behavior differs from historical averages
- Self-Documenting: Hover over any header for instant explanations
- Color-Coded Sections: Yellow (Pivots), Orange (Prev Period), Pink (Inside Bar), Green (Weekend)
- Blue Background: Recent stats highlighted for easy identification
- Dynamic Layout: Adapts based on market conditions
- Real-Time Updates: Includes current period for live probability tracking
How To Use
1. Add to any chart (best on Daily+ for maximum historical data)
2. Hover over column headers to understand each statistic
3. Compare historical vs recent probabilities
4. Use probabilities to inform position sizing and expectations
Example: Weekly pivot shows 78% historical hit rate but only 60% in last 30 weeks. Recent regime change suggests lower probability of test.
Technical Details
- Pine Script v6
- Rolling window arrays track last 30/30/12 periods for D/W/M
- Previous Period excludes EQ crossings for accurate stats
- Works on all timeframes, optimized for Daily+
- Configurable table position
Perfect For
Traders seeking data-driven confirmation, those wanting to quantify probability vs guessing, regime change detection, and crypto traders analyzing weekend patterns.
Note: Past performance doesn't guarantee future results. Use these statistics as one input in your overall trading strategy.
Liquidity Void Zone Detector [PhenLabs]📊 Liquidity Void Zone Detector
Version: PineScript™v6
📌 Description
The Liquidity Void Zone Detector is a sophisticated technical indicator designed to identify and visualize areas where price moved with abnormally low volume or rapid momentum, creating "voids" in market liquidity. These zones represent areas where insufficient trading activity occurred during price movement, often acting as magnets for future price action as the market seeks to fill these gaps.
Built on PineScript v6, this indicator employs a dual-detection methodology that analyzes both volume depletion patterns and price movement intensity relative to ATR. The revolutionary 3D visualization system uses three-layer polyline rendering with adaptive transparency and vertical offsets, creating genuine depth perception where low liquidity zones visually recede and high liquidity zones protrude forward. This makes critical market structure immediately apparent without cluttering your chart.
🚀 Points of Innovation
Dual detection algorithm combining volume threshold analysis and ATR-normalized price movement sensitivity for comprehensive void identification
Three-layer 3D visualization system with progressive transparency gradients (85%, 78%, 70%) and calculated vertical offsets for authentic depth perception
Intelligent state machine logic that tracks consecutive void bars and only renders zones meeting minimum qualification requirements
Dynamic strength scoring system (0-100 scale) that combines inverted volume ratios with movement intensity for accurate void characterization
Adaptive ATR-based spacing calculation that automatically adjusts 3D layering depth to match instrument volatility
Efficient memory management system supporting up to 100 simultaneous void visualizations with automatic array-based cleanup
🔧 Core Components
Volume Analysis Engine: Calculates rolling volume averages and compares current bar volume against dynamic thresholds to detect abnormally thin trading conditions
Price Movement Analyzer: Normalizes bar range against ATR to identify rapid price movements that indicate liquidity exhaustion regardless of instrument or timeframe
Void Tracking State Machine: Maintains persistent tracking of void start bars, price boundaries, consecutive bar counts, and cumulative strength across multiple bars
3D Polyline Renderer: Generates three-layer rectangular polylines with precise timestamp-to-bar index conversion and progressive offset calculations
Strength Calculation System: Combines volume component (inverted ratio capped at 100) with movement component (ATR intensity × 30) for comprehensive void scoring
🔥 Key Features
Automatic Void Detection: Continuously scans price action for low volume conditions or rapid movements, triggering void tracking when thresholds are exceeded
Real-Time Visualization: Creates 3D rectangular zones spanning from void initiation to termination, with color-coded depth indicating liquidity type
Adjustable Sensitivity: Configure volume threshold multiplier (0.1-2.0x), price movement sensitivity (0.5-5.0x), and minimum qualifying bars (1-10) for customized detection
Dual Color Coding: Separate visual treatment for low liquidity voids (receding red) and high liquidity zones (protruding green) based on 50-point strength threshold
Optional Compact Labels: Toggle LV (Low Volume) or HV (High Volume) circular labels at void centers for quick identification without visual clutter
Lookback Period Control: Adjust analysis window from 5 to 100 bars to match your trading timeframe and market volatility characteristics
Memory-Efficient Design: Automatically manages polyline and label arrays, deleting oldest elements when user-defined maximum is reached
Data Window Integration: Plots void detection binary, current strength score, and average volume for detailed analysis in TradingView's data window
🎨 Visualization
Three-Layer Depth System: Each void is rendered as three stacked polylines with progressive transparency (85%, 78%, 70%) and calculated vertical offsets creating authentic 3D appearance
Directional Depth Perception: Low liquidity zones recede with back layer most transparent; high liquidity zones protrude with front layer most transparent for instant visual differentiation
Adaptive Offset Spacing: Vertical separation between layers calculated as ATR(14) × 0.001, ensuring consistent 3D effect across different instruments and volatility regimes
Color Customization: Fully configurable base colors for both low liquidity zones (default: red with 80 transparency) and high liquidity zones (default: green with 80 transparency)
Minimal Chart Clutter: Closed polylines with matching line and fill colors create clean rectangular zones without unnecessary borders or visual noise
Background Highlight: Subtle yellow background (96% transparency) marks bars where void conditions are actively detected in real-time
Compact Labeling: Optional tiny circular labels with 60% transparent backgrounds positioned at void center points for quick reference
📖 Usage Guidelines
Detection Settings
Lookback Period: Default: 10 | Range: 5-100 | Number of bars analyzed for volume averaging and void detection. Lower values increase sensitivity to recent changes; higher values smooth detection across longer timeframes. Adjust based on your trading timeframe: short-term traders use 5-15, swing traders use 20-50, position traders use 50-100.
Volume Threshold: Default: 1.0 | Range: 0.1-2.0 (step 0.1) | Multiplier applied to average volume. Bars with volume below (average × threshold) trigger void conditions. Lower values detect only extreme volume depletion; higher values capture more moderate low-volume situations. Start with 1.0 and decrease to 0.5-0.7 for stricter detection.
Price Movement Sensitivity: Default: 1.5 | Range: 0.5-5.0 (step 0.1) | Multiplier for ATR-normalized price movement detection. Values above this threshold indicate rapid price changes suggesting liquidity voids. Increase to 2.0-3.0 for volatile instruments; decrease to 0.8-1.2 for ranging or low-volatility conditions.
Minimum Void Bars: Default: 10 | Range: 1-10 | Minimum consecutive bars exhibiting void conditions required before visualization is created. Filters out brief anomalies and ensures only sustained voids are displayed. Use 1-3 for scalping, 5-10 for intraday trading, 10+ for swing trading to match your time horizon.
Visual Settings
Low Liquidity Color: Default: Red (80% transparent) | Base color for zones where volume depletion or rapid movement indicates thin liquidity. These zones recede visually (back layer most transparent). Choose colors that contrast with your chart theme for optimal visibility.
High Liquidity Color: Default: Green (80% transparent) | Base color for zones with relatively higher liquidity compared to void threshold. These zones protrude visually (front layer most transparent). Ensure clear differentiation from low liquidity color.
Show Void Labels: Default: True | Toggle display of compact LV/HV labels at void centers. Disable for cleaner charts when trading; enable for analysis and review to quickly identify void types across your chart.
Max Visible Voids: Default: 50 | Range: 10-100 | Maximum number of void visualizations kept on chart. Each void uses 3 polylines, so setting of 50 maintains 150 total polylines. Higher values preserve more history but may impact performance on lower-end systems.
✅ Best Use Cases
Gap Fill Trading: Identify unfilled liquidity voids that price frequently returns to, providing high-probability retest and reversal opportunities when price approaches these zones
Breakout Validation: Distinguish genuine breakouts through established liquidity from false breaks into void zones that lack sustainable volume support
Support/Resistance Confluence: Layer void detection over key horizontal levels to validate structural integrity—levels within high liquidity zones are stronger than those in voids
Trend Continuation: Monitor for new void formation in trend direction as potential continuation zones where price may accelerate due to reduced resistance
Range Trading: Identify void zones within consolidation ranges that price tends to traverse quickly, helping to avoid getting caught in rapid moves through thin areas
Entry Timing: Wait for price to reach void boundaries rather than entering mid-void, as voids tend to be traversed quickly with limited profit-taking opportunities
⚠️ Limitations
Historical Pattern Indicator: Identifies past liquidity voids but cannot predict whether price will return to fill them or when filling might occur
No Volume on Forex: Indicator uses tick volume for forex pairs, which approximates but doesn't represent true trading volume, potentially affecting detection accuracy
Lagging Confirmation: Requires minimum consecutive bars (default 10) before void is visualized, meaning detection occurs after void formation begins
Trending Market Behavior: Strong trends driven by fundamental catalysts may create voids that remain unfilled for extended periods or permanently
Timeframe Dependency: Detection sensitivity varies significantly across timeframes; settings optimized for one timeframe may not perform well on others
No Directional Bias: Indicator identifies liquidity characteristics but provides no predictive signal for price direction after void detection
Performance Considerations: Higher max visible void settings combined with small minimum void bars can generate numerous visualizations impacting chart rendering speed
💡 What Makes This Unique
Industry-First 3D Visualization: Unlike flat volume or liquidity indicators, the three-layer rendering with directional depth perception provides instant visual hierarchy of liquidity quality
Dual-Mode Detection: Combines both volume-based and movement-based detection methodologies, capturing voids that single-approach indicators miss
Intelligent Qualification System: State machine logic prevents premature visualization by requiring sustained void conditions, reducing false signals and chart clutter
ATR-Normalized Analysis: All detection thresholds adapt to instrument volatility, ensuring consistent performance across stocks, forex, crypto, and futures without constant recalibration
Transparency-Based Depth: Uses progressive transparency gradients rather than colors or patterns to create depth, maintaining visual clarity while conveying information hierarchy
Comprehensive Strength Metrics: 0-100 void strength calculation considers both the degree of volume depletion and the magnitude of price movement for nuanced zone characterization
🔬 How It Works
Phase 1: Real-Time Detection
On each bar close, the indicator calculates average volume over the lookback period and compares current bar volume against the volume threshold multiplier
Simultaneously measures current bar's high-low range and normalizes it against ATR, comparing the result to price movement sensitivity parameter
If either volume falls below threshold OR movement exceeds sensitivity threshold, the bar is flagged as exhibiting void characteristics
Phase 2: Void Tracking & Qualification
When void conditions first appear, state machine initializes tracking variables: start bar index, initial top/bottom prices, consecutive bar counter, and cumulative strength accumulator
Each subsequent bar with void conditions extends the tracking, updating price boundaries to envelope all bars and accumulating strength scores
When void conditions cease, system checks if consecutive bar count meets minimum threshold; if yes, proceeds to visualization; if no, discards the tracking and resets
Phase 3: 3D Visualization Construction
Calculates average void strength by dividing cumulative strength by number of bars, then determines if void is low liquidity (>50 strength) or high liquidity (≤50 strength)
Generates three polyline layers spanning from start bar to end bar and from top price to bottom price, each with calculated vertical offset based on ATR
Applies progressive transparency (85%, 78%, 70%) with layer ordering creating recession effect for low liquidity zones and protrusion effect for high liquidity zones
Creates optional center label and pushes all visual elements into arrays for memory management
Phase 4: Memory Management & Display
Continuously monitors polyline array size (each void creates 3 polylines); when total exceeds max visible voids × 3, deletes oldest polylines via array.shift()
Similarly manages label array, removing oldest labels when count exceeds maximum to prevent memory accumulation over extended chart history
Plots diagnostic data to TradingView’s data window (void detection binary, current strength, average volume) for detailed analysis without cluttering main chart
💡 Note:
This indicator is designed to enhance your market structure analysis by revealing liquidity characteristics that aren’t visible through standard price and volume displays. For best results, combine void detection with your existing support/resistance analysis, trend identification, and risk management framework. Liquidity voids are descriptive of past market behavior and should inform positioning decisions rather than serve as standalone entry/exit signals. Experiment with detection parameters across different timeframes to find settings that align with your trading style and instrument characteristics.

Global M2 Money Supply Growth (GDP-Weighted)📊 Global M2 Money Supply Growth (GDP-Weighted)
This indicator tracks the weighted aggregate M2 money supply growth across the world's four largest economies: United States, China, Eurozone, and Japan. These economies represent approximately 69.3 trillion USD in combined GDP and account for the majority of global liquidity, making this a comprehensive macro indicator for analyzing worldwide monetary conditions.
════════════════════════════════════════════
🔧 KEY FEATURES:
📈 GDP-Weighted Aggregation
Each economy is weighted proportionally by its nominal GDP using 2025 IMF World Economic Outlook data:
• United States: 44.2% (30.62 trillion USD)
• China: 28.0% (19.40 trillion USD)
• Eurozone: 21.6% (15.0 trillion USD)
• Japan: 6.2% (4.28 trillion USD)
The weights are fully adjustable through the indicator settings, allowing you to update them annually as new IMF forecasts are released (typically April and October).
⏱️ Multiple Time Period Options
Choose between three calculation methods to analyze different timeframes:
• YoY (Year-over-Year): 12-month growth rate for identifying long-term liquidity trends and cycles
• MoM (Month-over-Month): 1-month growth rate for detecting short-term monetary policy shifts
• QoQ (Quarter-over-Quarter): 3-month growth rate for medium-term trend analysis
🔄 Advanced Offset Function
Shift the entire indicator forward by 0-365 days to test lead/lag relationships between global liquidity and asset prices. Research suggests a 56-70 day lag between M2 changes and Bitcoin price movements, but you can experiment with different offsets for various assets (equities, gold, commodities, etc.).
🌍 Individual Country Breakdown
Real-time display of each economy's M2 growth rate with:
• Current percentage change (YoY/MoM/QoQ)
• GDP weight contribution
• Color-coded values (green = monetary expansion, red = contraction)
📊 Smart Overlay Capability
Displays directly on your main price chart with an independent left-side scale, allowing you to visually correlate global liquidity trends with any asset's price action without cluttering the chart.
🔧 Customizable GDP Weights
All GDP values can be adjusted through the indicator settings without editing code, making annual updates simple and accessible for all users.
════════════════════════════════════════════
📡 DATA SOURCES:
All M2 money supply data is sourced from ECONOMICS (Trading Economics) for consistency and reliability:
• ECONOMICS:USM2 (United States)
• ECONOMICS:CNM2 (China)
• ECONOMICS:EUM2 (Eurozone)
• ECONOMICS:JPM2 (Japan)
All values are normalized to USD using current daily exchange rates (USDCNY, EURUSD, USDJPY) before GDP-weighted aggregation, ensuring accurate cross-country comparisons.
══════════════════════════════════════════════
💡 USE CASES & APPLICATIONS:
🔹 Liquidity Cycle Analysis
Track global monetary expansion/contraction cycles to identify when central banks are coordinating loose or tight monetary policies.
🔹 Market Timing & Risk Assessment
High M2 growth (>10%) historically correlates with risk-on environments and rising asset prices across crypto, equities, and commodities. Negative M2 growth signals monetary tightening and potential market corrections.
🔹 Bitcoin & Crypto Correlation
Compare with Bitcoin price using the offset feature to identify the optimal lag period. Many traders use 60-70 day offsets to predict crypto market movements based on liquidity changes.
🔹 Macro Portfolio Allocation
Use as a regime filter to adjust portfolio exposure: increase risk assets during liquidity expansion, reduce during contraction.
🔹 Central Bank Policy Divergence
Monitor individual country metrics to identify when major central banks are pursuing divergent policies (e.g., Fed tightening while China eases).
🔹 Inflation & Economic Forecasting
Rapid M2 growth often leads inflation by 12-18 months, making this a leading indicator for future inflation trends.
🔹 Recession Early Warning
Negative M2 growth is extremely rare and has preceded major recessions, making this a valuable risk management tool.
════════════════════════════════════════════
📊 INTERPRETATION GUIDE:
🟢 +10% or Higher
Aggressive monetary expansion, typically during crises (2001, 2008, 2020). The COVID-19 period saw M2 growth reach 20-27%, which preceded significant inflation and asset price surges. Strong bullish signal for risk assets.
🟢 +6% to +10%
Above-average liquidity growth. Central banks are providing stimulus beyond normal levels. Generally favorable for equities, crypto, and commodities.
🟡 +3% to +6%
Normal/healthy growth rate, roughly in line with GDP growth plus 2% inflation targets. Neutral environment with moderate support for risk assets.
🟠 0% to +3%
Slowing liquidity, potential tightening phase beginning. Central banks may be raising rates or reducing balance sheets. Caution warranted for high-beta assets.
🔴 Negative Growth
Monetary contraction - extremely rare. Only occurred during aggressive Fed tightening in 2022-2023. Strong warning signal for risk assets, often precedes recessions or major market corrections.
════════════════════════════════════════════
🎯 OPTIMAL USAGE:
📅 Recommended Timeframes:
• Daily or Weekly charts for macro analysis
• Monthly charts for very long-term trends
💹 Compatible Asset Classes:
• Cryptocurrencies (especially Bitcoin, Ethereum)
• Equity indices (S&P 500, NASDAQ, global markets)
• Commodities (Gold, Silver, Oil)
• Forex majors (DXY correlation analysis)
⚙️ Suggested Settings:
• Default: YoY calculation with 0 offset for current liquidity conditions
• Bitcoin traders: YoY with 60-70 day offset for predictive analysis
• Short-term traders: MoM with 0 offset for recent policy changes
• Quarterly rebalancers: QoQ with 0 offset for medium-term trends
════════════════════════════════════════════
📋 VISUAL DISPLAY:
The indicator plots a blue line showing the selected growth metric (YoY/MoM/QoQ), with a dashed reference line at 0% to clearly identify expansion vs. contraction regimes.
A comprehensive table in the top-right corner displays:
• Current global M2 growth rate (large, prominent display)
• Individual country breakdowns with their GDP weights
• Color-coded growth rates (green for positive, red for negative)
════════════════════════════════════════════
🔄 MAINTENANCE & UPDATES:
GDP weights should be updated annually (ideally in April or October) when the IMF releases new World Economic Outlook forecasts. Simply adjust the four GDP input parameters in the indicator settings - no code editing required.
The relative GDP proportions between the Big 4 economies change very gradually (typically <1-2% per year), so even if you update weights once every 1-2 years, the impact on the indicator's accuracy is minimal.
════════════════════════════════════════════
💭 TRADING PHILOSOPHY:
This indicator embodies the principle that "liquidity drives markets." By tracking the combined M2 money supply of the world's largest economies, weighted by their economic size, you gain insight into the fundamental liquidity conditions that underpin all asset prices.
Unlike single-country M2 indicators, this GDP-weighted approach captures the true global picture, accounting for the fact that US monetary policy has 2x the impact of Japanese policy due to economic size differences.
Perfect for macro-focused traders, long-term investors, and anyone seeking to understand the "tide that lifts all boats" in financial markets.
════════════════════════════════════════════
Created for traders and investors who incorporate global liquidity trends into their decision-making process. Best used alongside other technical and fundamental analysis tools for comprehensive market assessment.
⚠️ Disclaimer: M2 money supply is a lagging macroeconomic indicator. Past correlations do not guarantee future results. Always use proper risk management and combine with other analysis methods.

Price Drop CounterThe Price Drop Counter is a very basic statistical indicator.
See it as an analytical tool that tracks how many times an asset's price has dropped by a specified percentage from its recent peak within a defined date range.
The indicator monitors the highest price reached and counts each occurrence when the price falls by your chosen threshold, then resets its peak tracking point after each drop is registered.
Uses
Volatility Assessment: Measure how frequently significant price corrections occur during specific periods
Market Behavior Analysis: Compare drop frequency across different timeframes or market conditions
Risk Evaluation: Identify assets or periods with higher downside volatility
Historical Pattern Recognition: Study how often major pullbacks happened during bull or bear markets
Backtesting Support: Analyze how your strategy would perform based on the frequency of drawdowns
How to use it
Add the indicator to your TradingView chart
Configure the Percent Drop (%) to define your threshold (default: 10%). The indicator will count each time price falls by this percentage from the most recent high
IMPORTANT Set your Start Date and End Date to analyze a specific period of interest
The blue step-line plot shows the cumulative count of drops within your date range
Adjust the percentage threshold based on your analysis needs - use smaller values (2-5%) for more frequent signals or larger values (15-20%) for major corrections only
The counter resets its high-water mark after each qualifying drop, allowing it to track multiple sequential drops within the same period.

macd sma20
### MACD_sma20 – Multi-Timeframe MACD Pullback & SMA20 Dashboard
This script is a complete trading toolkit built around a **MACD pullback strategy** combined with **multi-timeframe SMA20 filters**, volume analysis, and a compact information panel.
It is designed for traders who like to:
* Trade **MACD pullbacks above the moving average**
* Track **key SMA20 levels across multiple timeframes** (Daily, 3-Day, Weekly, Monthly)
* Quickly see whether **current price is above or below those reference levels**
* Use **clean visual signals** for entries and exits, instead of staring at raw indicator values
---
### Core Features
#### 1. MACD Pullback Long Signal (Green Triangle Up)
The script detects a **bullish MACD pullback** pattern:
* MACD line is still **above** the signal line
* Both MACD line and histogram **pull back** for several bars
* Then MACD turns back up again, with price trading **above the local SMA20**
When this “pullback and re-acceleration” is confirmed, a **green triangle below the bar** is plotted as a **long entry signal**.
There is also an optional filter:
* **Weekly SMA20 filter**:
If enabled, long signals are only triggered when **current price is above the Weekly SMA20**, helping you stay on the right side of the higher-timeframe trend.
---
#### 2. Bearish Pullback Confirmation Signal (Red Triangle Down)
On the short side, the script detects a **bearish pullback confirmation** based on:
* A recent **high-volume bearish candle** (large down bar with volume above a multiple of the 20-period volume average)
* At least a minimum number of **negative MACD histogram bars**
* MACD line moving closer to the signal line (loss of momentum)
* Price recovering back up near the **top of that high-volume bearish candle**, then starting to fall again while MACD stays positive
When all conditions align, the script prints a **red triangle above the bar**, indicating a **bearish pullback confirmation** – often a good area to take profits on longs or consider short/hedge setups.
---
#### 3. Signal History Tracking
For both long and short signals, the script internally tracks the **most recent three signals**:
* Timestamp of the signal
* Price at the signal
* Short-term percentage change into the signal
This is mainly for internal use and future expansion, but already gives you a structured signal history if you want to extend or connect the logic later.
---
### Multi-Timeframe SMA20 Dashboard (Bottom-Right Panel)
One of the most useful parts of this script is the **compact dashboard table** in the **bottom-right corner** of the chart. It updates in real time and shows:
1. **Current Price**
2. **Daily SMA20** – value + whether price is above/below
3. **3-Day SMA20** – value + whether price is above/below
4. **Weekly SMA20** – value + whether price is above/below
5. **Monthly SMA20** – value + whether price is above/below
6. **RSI** (current timeframe)
For each timeframe’s SMA20:
* If **price ≥ SMA20**, the status cell is **green** with a ✓
* If **price < SMA20**, the status cell is **red** with a ✗
This gives you, at a glance:
* Is the market in a **short-term uptrend or downtrend** (Daily SMA20)?
* Is the **swing / position trend** healthy (3D & Weekly SMA20)?
* Is the broader **macro structure** supportive (Monthly SMA20)?
You don’t need to manually switch timeframes or add multiple moving averages – the script does all of that for you automatically using `request.security`.
---
### Alerts
The script comes with two built-in alert conditions:
* **MACD回踩转多信号 (MACD pullback bullish signal)**
* **空头回抽确认信号 (Bearish pullback confirmation signal)**
You can attach TradingView alerts to these conditions to get notified whenever a new long or bearish-confirmation setup appears, even when you’re not watching the chart.
---
### How to Use It in Your Trading
1. **Choose your main trading timeframe**
* For intraday swing: 15m / 1h / 4h
* For swing / position: 4h / Daily
2. **Watch the bottom-right SMA20 panel**
* If most higher-timeframe SMA20 rows are **green**, you are trading **with the larger trend**.
* If they are **mixed or mostly red**, you’re either counter-trend or in a choppy transition zone.
3. **Use the green MACD pullback signals**
* Prefer long setups when:
* The **Weekly and Monthly SMA20 rows are green**, and
* The signal appears **above the Daily SMA20**
* This stacks multiple edges: trend + pullback + momentum re-acceleration.
4. **Use the red bearish confirmation signals for risk management**
* Take partial profits on longs when a red signal appears near resistance.
* Consider hedge/short opportunities if higher-timeframe SMA20 rows are already red or turning red.
5. **Use RSI as a context indicator**
* Combine with overbought/oversold zones or your own RSI thresholds for additional confirmation.
---
### Why This Script Is Useful
* **Trend awareness across timeframes**:
You always know where current price sits relative to the Daily / 3-Day / Weekly / Monthly SMA20 – without switching charts.
* **Clear, rule-based signals**:
The MACD logic is explicit and systematic, focused on **pullbacks within trends** rather than random crossovers.
* **Volume-aware bearish logic**:
High-volume bearish candles often mark important supply zones. The script builds this idea directly into the short-side confirmation logic.
* **Visual and intuitive**:
Green/Red triangles + Green/Red table cells make it easy to interpret even if you are not a heavy indicator user.
* **Flexible**:
All key parameters (MACD lengths, SMA length, volume threshold, lookback period, RSI length, weekly filter) are customizable, so you can adapt it to different markets (crypto, stocks, FX) and timeframes.
---
In short, this script is a **multi-timeframe MACD pullback system with an integrated SMA20 dashboard**, suitable for swing traders and position traders who want a structured, visually clean way to align entries with trend and momentum while keeping an eye on higher-timeframe levels.

Multi-Symbol EMA Crossover Scanner with Multi-Timeframe AnalysisDescription
What This Indicator Does:
This indicator is a comprehensive market scanner that monitors up to 10 symbols simultaneously across 4 different timeframes (15-minute, 1-hour, 4-hour, and daily) to detect exponential moving average (EMA) crossovers in real-time. Instead of manually checking multiple charts and timeframes for EMA crossover signals, this scanner automatically does the work for you and presents all detected signals in a clean, organized table that updates continuously throughout the trading session.
Key Features:
Multi-Symbol Monitoring: Scan up to 10 different symbols at once (stocks, forex, crypto, or any TradingView symbol)
Multi-Timeframe Analysis: Simultaneously tracks 4 timeframes (15m, 1H, 4H, 1D) with toggle options to enable/disable each
Comprehensive EMA Pairs: Detects crossovers between all major EMA combinations: 20×50, 20×100, 20×200, 50×100, 50×200, and 100×200
Real-Time Signal Feed: Displays the most recent signals in a sorted table (newest first) with timestamp, direction, price, and EMA pair information
Session Filter: Built-in time filter (default 10:00-18:00) to focus on specific trading hours and avoid pre-market/after-hours noise
Pagination System: Navigate through signals using a page selector when you have more signals than fit in one view
Signal Statistics: Footer displays total signals, bullish/bearish breakdown, and page navigation hints
Customizable Display: Choose table position (4 corners), signals per page (5-20), and maximum signal history (10-100)
How It Works:
The scanner uses the request.security() function to fetch EMA data from multiple symbols and timeframes simultaneously. For each symbol-timeframe combination, it calculates four exponential moving averages (20, 50, 100, and 200 periods) and monitors for crossovers:
Bullish Crossovers (▲ Green):
Faster EMA crosses above slower EMA
Indicates potential upward momentum
Common entry signals for long positions
Bearish Crossovers (▼ Red):
Faster EMA crosses below slower EMA
Indicates potential downward momentum
Common entry signals for short positions or exits
The scanner prioritizes crossovers involving faster EMAs (20×50) over slower ones (100×200), as faster crossovers typically generate more frequent signals. Each detected crossover is stored with its timestamp, allowing the scanner to sort signals chronologically and remove duplicates within the same timeframe.
Signal Table Columns:
Sym: Symbol name (abbreviated, e.g., "ASELS" instead of "BIST:ASELS")
TF: Timeframe where the crossover occurred (15m, 1h, 4h, 1D)
⏰: Exact time of the crossover (HH:MM format in Istanbul timezone)
↕: Direction indicator (▲ bullish green / ▼ bearish red)
₺: Price level where the crossover occurred (average of the two EMAs)
MA: Which EMA pair crossed (e.g., "20×50", "50×200")
How to Use:
For Day Traders:
Enable 15m and 1h timeframes
Monitor symbols from your watchlist
Use crossovers as entry timing signals in the direction of the larger trend
Adjust the time filter to match your trading session (e.g., market open to 2 hours before close)
For Swing Traders:
Enable 4h and 1D timeframes
Focus on 50×200 and 100×200 crossovers (golden/death crosses)
Look for multiple timeframe confluence (same symbol showing bullish crossovers on both 4h and 1D)
Use as a pre-market scanner to identify potential setups for the day
For Multi-Market Traders:
Mix symbols from different markets (stocks, forex, crypto)
Use the scanner to identify which markets are showing the most momentum
Track relative strength by comparing crossover frequency across symbols
Identify rotation opportunities when one asset shows bullish signals while another shows bearish
Setup Recommendations:
Default BIST (Turkish Stock Market) Setup:
The code comes pre-configured with 10 popular BIST stocks:
ASELS, EKGYO, THYAO, AKBNK, PGSUS, ASTOR, OTKAR, ALARK, ISCTR, BIMAS
For US Stocks:
Replace with symbols like: NASDAQ:AAPL, NASDAQ:TSLA, NASDAQ:NVDA, NYSE:JPM, etc.
For Forex:
Use pairs like: FX:EURUSD, FX:GBPUSD, FX:USDJPY, OANDA:XAUUSD, etc.
For Crypto:
Use exchanges like: BINANCE:BTCUSDT, COINBASE:ETHUSD, BINANCE:SOLUSDT, etc.
Settings Guide:
Symbol List (10 inputs):
Enter any valid TradingView symbol in "EXCHANGE:TICKER" format
Use symbols you actively trade or monitor
Mix different asset classes if desired
Timeframe Toggles:
15 Minutes: High-frequency signals, best for day trading
1 Hour: Balanced frequency, good for intraday swing trades
4 Hours: Lower frequency, quality swing trade signals
1 Day: Low frequency, major trend changes only
Time Filter:
Start Hour (10): Beginning of your trading session
End Hour (18): End of your trading session
Prevents signals during low-liquidity periods
Adjust to match your market's active hours
Display Settings:
Table Position: Choose corner placement (doesn't interfere with other indicators)
Max Signals (40): Total historical signals to keep in memory
Signals Per Page (10): How many rows to show at once
Page Number: Navigate through signal history (auto-adjusts to available pages)
What Makes This Original:
Multi-symbol scanners exist on TradingView, but this indicator's originality comes from:
Comprehensive EMA Pair Coverage: Most scanners focus on 1-2 EMA pairs, this monitors 6 different combinations simultaneously
Unified Multi-Timeframe View: Presents signals from 4 timeframes in a single, chronologically sorted feed rather than separate panels
Session-Aware Filtering: Built-in time filter prevents signal overload from 24-hour markets
Smart Pagination: Handles large signal volumes gracefully with page navigation instead of scrolling
Signal Deduplication: Prevents the same crossover from appearing multiple times if it persists across several bars
Price-at-Cross Recording: Captures the exact price where the crossover occurred, not just that it happened
Real-Time Statistics: Live tracking of bullish vs bearish signal distribution
Trading Strategy Examples:
Trend Confirmation Strategy:
Find a symbol showing bullish crossover on 1D (major trend change)
Wait for pullback
Enter when 1h shows bullish crossover (confirmation)
Exit when 1h shows bearish crossover
Multi-Timeframe Confluence:
Look for symbols appearing multiple times with same direction
Example: ASELS shows ▲ on both 4h and 1D = strong bullish signal
Avoid symbols showing conflicting signals (▲ on 1h but ▼ on 4h)
Rotation Scanner:
Monitor 10+ symbols from the same sector
Identify which are turning bullish (▲) first
Enter leaders, avoid laggards
Rotate out when crossovers turn bearish (▼)
Important Considerations:
Not a Complete System: EMA crossovers should be confirmed with price action, volume, and support/resistance analysis
Whipsaw Risk: During consolidation, EMAs can cross back and forth frequently (especially on 15m timeframe)
Lag: EMAs are lagging indicators; crossovers occur after the move has already begun
False Signals: More common during sideways markets; work best in trending environments
Symbol Limits: TradingView has limits on request.security() calls; this scanner uses 40 calls (10 symbols × 4 timeframes)
Performance: On lower-end devices, scanning 10 symbols across 4 timeframes may cause slight delays in chart updates
Best Practices:
Start with 5 symbols and 2 timeframes, then expand as you get comfortable
Use in conjunction with a main chart for price context
Don't trade every signal—filter for high-quality setups
Backtest your favorite EMA pairs on your symbols to understand their reliability
Adjust the time filter to exclude lunch hours if your market has low midday volume
Check the footer statistics—if you're getting 50+ signals per day, tighten your time filter or reduce symbols
Technical Notes:
Uses lookahead=barmerge.lookahead_off to prevent future data leakage
Signals are stored in arrays and sorted by timestamp (newest first)
Automatic daily reset clears old signals to prevent memory buildup
Table dynamically resizes based on signal count
All times displayed in Europe/Istanbul timezone (configurable in code)
