Intermarket Swing Projection [LuxAlgo]The Intermarket Swing Projection allows traders to plot price movement swings from any user-selected asset directly onto the chart in the form of zigzags and/or horizontal support and resistance levels.
This tool rescale the external asset price on the user chart, enabling traders to make direct comparisons.
It answers the question of how different the price behavior is between two assets, accounting for each asset's volatility.
🔶 USAGE
This tool is based on swing detection of two different assets: the chart and a user-selected asset. It allows traders to compare two assets on an equal footing while accounting for volatility and price behavior.
Traders can customize the detection by selecting a custom ticker, timeframe, the number of swings and length for swing detection. This makes the tool a Swiss army knife for asset comparison.
As we can see in the image below, the Show Last, Pivot Length, and Spread parameters are key to defining the final output of the tool.
"Show Last" defines how many pivots are displayed. "Pivot Length" is used for pivot detection; a larger value will detect larger market structures. "Spread" defines how far apart the horizontal levels will be from their original location in terms of volatility.
🔹 Comparing different assets
This image shows the Nasdaq 100 futures contract compared to four other futures contracts: S&P 500, gold, bitcoin, and euro/U.S. dollar.
Plotting all of these assets in Nasdaq 100 terms makes it easy to compare and analyze price behaviors and identify key levels.
In the top left chart, we have NQ vs. ES. It's no surprise that they are practically an exact match; a large portion of the S&P 500 is technology.
In the top right chart, NQ vs. GC, we see totally different behaviors. We can clearly see the summer consolidation in gold and the resumption of the uptrend, which took gold above 29,200 NQ points, up from 21,200.
In the bottom right chart, we see bitcoin making new highs, way above the Nasdaq in May, July, and October. However, the last high was way below the Nasdaq prices on October 27—the first lower high in a while. Sellers are pushing down.
Finally, the bottom left chart is NQ vs. 6E. We can see large volatility in the uptrend since February, with NQ unable to catch up until now. The last swing low was almost a match, and 6E is in a range.
As we can see, this tool allows us to perform intermarket analysis properly by accounting for each asset's volatility and price behavior. Then, we plot them on the same scale on equal terms, which makes performing this kind of analysis easy.
As we can see in the chart above, the assets are the same as in the previous image, but the timeframe is 1H with different settings.
Note the horizontal levels acting as support and resistance, as well as how NQ prices react to the zones marked with white circles. These levels are derived from custom assets selected by the user.
🔹 Displaying Elements
Zig-zag allows traders to clearly see the path that the selected asset's price took, as well as its turning points.
Horizontal levels are displayed from those turning points to the present and can be used as support or resistance. Traders can adjust the spread parameter in the settings panel to expand or contract those levels' volatility.
There are two color modes for the levels: average and pivots. In the first mode, green is used for levels below the average and red for levels above the average. The second uses green for swing lows and red for swing highs.
The backpaint feature is enabled by default and allows the swings to be displayed in the correct location. With this feature disabled, the swings will be displayed in the current location when a new swing is detected.
🔶 DETAILS
On a more technical note, the rescaling is formed by calculating three main elements from all the swings detected on the custom and chart assets:
The chart asset's average of all swing points
The chart asset's standard deviation of all swing points
The custom asset's z-score for each swing point
Then, the re-scaled swing point is calculated as the average plus the z-score multiplied by the standard deviation. This makes it possible to plot AAPL swings on an NQ chart, for example.
Thanks to re-scaling, we can directly compare the price behavior of two assets with different price ranges and volatility on the same chart.
🔶 SETTINGS
🔹 Trendlines
Ticker: Select the custom ticker.
Timeframe: Select a custom timeframe.
Show Last: Select how many swing points to display.
Pivot Length: Select the size for swing point detection.
Spread: Volatility multiplier for horizontal levels. Larger values mean the levels are farther apart.
Backpaint: Enable or disable the backpaint feature. When enabled, the drawings will be displayed where they were detected. When disabled, the drawings will be displayed at the moment of detection.
🔹 Style
Show ZigZag: Enable or disable the ZigZag display and choose a line style.
Show Levels: Enable or disable the levels display and choose a line style.
Color Mode: Choose between Average Mode, which colors all levels below the average bullish and all levels above bearish, and Pivot Mode, which colors swing highs bearish and swing lows bullish.
Bullish: Select a bullish color.
Bearish: Select a bearish color.
ZigZag: Select the ZigZag color.
ابحث في النصوص البرمجية عن "trendline"

Trend Vector Pro v2.0Trend Vector Pro v2.0
👨💻 Developed by: Mohammed Bedaiwi
💡 Strategy Overview & Coherence
Trend Vector Pro (TVPro) is a momentum-based trend & reversal strategy that uses a custom smoothed oscillator, an optional ADX filter, and classic Pivot Points to create a single, coherent trading framework.
Instead of stacking random indicators, TVPro is built around these integrated components:
A custom momentum engine (signal generation)
An optional ADX filter (trend quality control)
Daily Pivot Points (context, targets & S/R)
Swing-based “Golden Bar” trailing stops (trade management)
Optional extended bar detection (overextension alerts)
All parts are designed to work together and are documented below to address originality & usefulness requirements.
🔍 Core Components & Justification
1. Custom Momentum Engine (Main Signal Source)
TVPro’s engine is a custom oscillator derived from the bar midpoint ( hl2 ), similar in spirit to the Awesome Oscillator but adapted and fully integrated into the strategy. It measures velocity and acceleration of price, letting the script distinguish between strong impulses, weakening trends, and pure noise.
2. ADX Filter (Trend Strength Validation – Optional)
Uses Average Directional Index (ADX) as a gatekeeper.
Why this matters: This prevents the strategy from firing signals in choppy, non-trending environments (when ADX is below the threshold) and keeps trades focused on periods of clear directional strength.
3. Classic Pivot Points (Context & Targets)
Calculates Daily Pivot Points ( PP, R1-R3, S1-S3 ) via request.security() using prior session data.
Why this matters: Momentum gives the signal, ADX validates the environment, and Pivots add external structure for risk and target planning. This is a designed interaction, not a random mashup.
🧭 Trend State Logic (5-State Bar Coloring)
The strategy uses the momentum's value + slope to define five states, turning the chart into a visual momentum map:
🟢 STRONG BULL (Bright Green): Momentum accelerating UP. → Strong upside impulse.
🌲 WEAK BULL (Dark Green): Momentum decelerating DOWN (while positive). → Pullback/pause zone.
🔴 STRONG BEAR (Bright Red): Momentum accelerating DOWN. → Strong downside impulse.
🍷 WEAK BEAR (Dark Red): Momentum decelerating UP (while negative). → Rally/short-covering zone.
🔵 NEUTRAL / CHOP (Cyan): Momentum is near zero (based on noise threshold). → Consolidation / low volatility.
🎯 Signal Logic Modes
TVPro provides two selectable entry styles, controlled by input:
Reversals Only (Cleaner Mode – Default): Targets trend flips. Entry triggers when the current state is Bullish (or Bearish) and the previous state was not. This reduces noise and over-trading.
All Strong Pulses (Aggressive Mode): Targets acceleration phases. Entry triggers when the bar turns to STRONG BULL or STRONG BEAR after any other state. This mode produces more trades.
📌 Risk Management Tools
🟡 Golden Bars – Trailing Stops: Yellow “Trail” Arrows mark confirmed Swing Highs/Lows. These are used as logical trailing stop levels based on market structure.
Extended Bars: Detects when price closes outside a 2-standard-deviation channel, flagging overextension where a pullback is more likely.
Pivot Points: Used as external targets for Take Profit and structural stop placement.
⚙️ Strategy Defaults (Crucial for Publication Compliance)
To keep backtest results realistic and in line with House Rules, TVPro is published with the following fixed default settings:
Order Size: 5% of equity per trade ( default_qty_value = 5 )
Commission: 0.04% per order ( commission_value = 0.04 )
Slippage: 2 ticks ( slippage = 2 )
Initial Capital: 10,000
📘 How to Trade with Trend Vector Pro
Entry: Take Long when a Long signal appears and confirm the bar is Green (Bull state). Short for Red (Bear state).
Stop Loss: Place the initial SL near the latest swing High/Low, or near a relevant Pivot level.
Trade Management: Follow Golden (Trail) Arrows to trail your stop behind structure.
Exits: Exit when: the trailing stop is hit, Price reaches a major Pivot level, or an opposite signal prints.
🛑 Disclaimer
This script is for educational purposes only and does not constitute financial advice. Past performance does not guarantee future results. Always forward-test and use proper risk management before applying any strategy to live trading.

Advanced Breakout System v2.0Advanced Breakout System v2.0
Developed by: Mohammed Bedaiwi
This script hunts for high-probability breakouts by combining price consolidation zones, volume spikes vs. average volume, smart money flow (OBV), and a Momentum Override for explosive moves that skip consolidation. Additionally, it automatically identifies and plots Support and Resistance levels with price labels to help you visualize market structure.
The system follows a "Watch & Confirm" logic: it first prints a WATCH setup, then a BUY only if price confirms strength.
💡 JUSTIFICATION OF CONCEPTS (MASHUP & ORIGINALITY)
This script is an original mashup combining several analytical concepts to address common breakout failures:
Volatility Compression Engine: Uses built-in functions like ta.highest() and ta.lowest() to mathematically define the setup phase where price volatility is compressed below a user-defined threshold.
Volume Spike Confirmation: The breakout must be confirmed by a volume increase greater than a moving average of volume, signaling strong market interest.
Smart Volume Filter (OBV): This is the key component. By checking if ta.obv is above its own Moving Average, we confirm that accumulation has been occurring during the consolidation period, suggesting institutional positioning before the price break.
Multi-Exit Risk System: Employs dynamic exits (EMA cross, volume dump, bearish pattern) instead of static stop-losses to manage risk adaptively based on real-time market action.
Market Structure Visualization: The script also includes a Support & Resistance engine to plot key swing pivots and price labels for visual context.
✅ STRATEGY RESULTS & POLICY COMPLIANCE
To ensure non-misleading and transparent backtesting results, this strategy is published with the following fully compliant properties:
Dataset Compliance: The backtest is performed on the CMTL Daily (1D) chart across a long history, generating 201 total trades. This significantly exceeds the minimum requirement of 100 trades, providing a robust test dataset.
Risk Control: The strategy uses a conservative order size set to 2% of equity (default_qty_value=2), strictly adhering to the sustainable risk recommendation of 5-10% of equity per trade.
Transaction Costs: Realistic trading conditions are modeled using 0.07% commission and 3 ticks slippage to prevent the overestimation of profitability.
⚙️ VISUAL GUIDE & SIGNAL LOGIC
Key Color Legend (Visual Guide):
WATCH – Setup (Yellow Arrow Down): Potential breakout setup detected.
BUY – Confirmation (Green Arrow Up): Confirmed breakout, triggered when price trades above the high of the WATCH candle.
SELL – Break (Orange Arrow): Short-term trend weakness, triggered when price closes below the Fast EMA (9).
SELL – Dump (Dark Red Arrow): Distribution / volume dump, triggered by a bearish candle with abnormally high volume.
SELL – Pattern (Purple Arrow): Bearish price-action pattern (such as a bearish engulfing).
Support & Resistance Lines (Red/Green): Small horizontal lines plotted at key swing points with exact price labels.
⌨️ INPUTS (DEFAULT SETTINGS)
Entry settings: Consolidation Lookback (default 20) = bars used to detect consolidation. Consolidation Range % (default 12%) = max allowed range size. Volume Spike Multiplier (default 1.2) = factor above average volume to count as a spike. Force Signal on Big Moves (default ON) = forces a WATCH signal on high-momentum moves.
Exit settings: Enable Fast Exit (EMA 9) toggles the SELL – Break signal. Dump Volume Multiplier defines what counts as “dump” volume.
Support & Resistance: Adjustable Pivot Left/Right bars control the sensitivity of the support and resistance lines.
⚠️ Disclaimer Trading involves significant risk of loss. This script is for educational and informational purposes only and is not financial advice or a recommendation to buy or sell any asset. BUY and SELL signals are rule-based and derived from historical behavior and do not guarantee future performance. Always use your own analysis and risk management. This is an open-source strategy; users are encouraged to test it across different symbols and timeframes.

Trading Session IL7 Session-Based Intraday Momentum IndicatorOverview
This indicator is designed to support discretionary traders by highlighting intraday momentum phases based on price behavior and trading session context.
It is intended as a confirmation tool and not as a standalone trading system or automated strategy.
Core Concept
The script combines multiple market observations, including:
- Directional price behavior within the current timeframe
- Structural consistency in recent price movement
- Session-based filtering to focus on periods with higher activity and liquidity
Signals are only displayed when internal conditions align, helping traders avoid low-quality setups during sideways or low-momentum market phases.
How to Use
This indicator should be used to confirm existing trade ideas rather than generate trades on its own.
It can help traders:
- Identify periods where momentum is more likely to continue
- Filter out trades during unfavorable market conditions
- Align intraday execution with higher-timeframe bias
Best results are achieved when used alongside key price levels, higher-timeframe structure and proper risk management.
Limitations
This indicator does not predict future price movements.
Signals may change during active candles.
Market conditions may reduce effectiveness during extremely low volatility periods.
Language Notice
The indicator’s user interface labels are displayed in German.
This English description is provided first to comply with TradingView community script publishing rules.

LVN Smart Liquidity📊 LVN SMART LIQUIDITY
═════════════════════════════════════════════════════════════
─────────────────────────────────────────────────────────────
🎯 OVERVIEW
LVN Smart Liquidity is an advanced Market Profile-based indicator that automatically identifies Low Volume Nodes (LVN) across multiple timeframes. Unlike traditional volume-based indicators, this tool uses TPO (Time Price Opportunity) calculations to detect price levels where minimal trading activity occurred, revealing potential breakout zones and rapid price movement areas.
These LVN zones often behave similarly to Fair Value Gaps (FVG) in Smart Money Concepts, representing "thin air" areas where price tends to move quickly with minimal resistance. The indicator provides dynamic zone management with an immunity period system to prevent premature zone closure.
─────────────────────────────────────────────────────────────
🔬 HOW IT WORKS
MARKET PROFILE TPO METHODOLOGY:
The indicator analyzes each higher timeframe period by:
1. Dividing the price range into 20 equal levels
2. Counting how many bars touched each level (TPO count)
3. Identifying levels with TPO counts below the threshold (default 30% of maximum)
4. Creating horizontal zones that extend until price touches them
MULTI-TIMEFRAME ANALYSIS:
• Supports up to 5 independent timeframes simultaneously
• Each timeframe generates its own LVN zones with unique colors
• Auto-timeframe mode adapts to your chart period
• Zones project from historical sessions onto current price action
SMART ZONE MANAGEMENT:
• Immunity Period: New zones are protected for N bars after creation (default 20)
• This prevents zones from disappearing immediately when price is already within them
• Zones extend right until price touches them, then stop extending
• Historical zones remain visible for reference (optional)
─────────────────────────────────────────────────────────────
💡 WHY LVN ZONES MATTER
Low Volume Nodes represent price levels where:
✓ Price spent minimal time (rejection zones)
✓ Few market participants were active
✓ Inefficient price discovery occurred
✓ Similar to Fair Value Gaps in ICT/SMC methodology
TRADING APPLICATIONS:
• Breakout Acceleration: Price moves rapidly through LVN zones
• Profit Targets: Place targets beyond LVN zones where momentum slows
• Stop Loss Placement: Avoid placing stops inside LVN zones (price likely to continue)
• Confluence with FVG: LVN zones often align with Fair Value Gaps
• Retest Opportunities: When price revisits LVN, expect quick moves
─────────────────────────────────────────────────────────────
⚙️ KEY FEATURES
TIMEFRAME FLEXIBILITY:
• 5 independent timeframe slots with enable/disable toggles
• Auto-mode intelligently selects higher timeframes
• Preset options: 5m, 15m, 30m, 1H, 2H, 4H, D, W, 2W, M, 3M, 6M, 12M
VISUAL CUSTOMIZATION:
• Individual color settings for each timeframe
• Adjustable box transparency and border width
• Toggle timeframe labels and period dates on/off
• Four text size options: tiny, small, normal, large
ADVANCED CONTROLS:
• LVN Threshold: 0-50% (default 30%) - lower = fewer, stronger zones
• Immunity Period: 0-50 bars (default 20) - prevents premature closure
• Show/Hide old boxes for clean chart appearance
• Maximum 500 boxes supported per timeframe
PROFESSIONAL DISPLAY:
• Zones show timeframe label (5m, 1H, D, etc.)
• Optional period dates (dd.MM-dd.MM format)
• Boxes extend right dynamically until price touch
• Clean visual hierarchy with bordered zones
─────────────────────────────────────────────────────────────
📈 HOW TO USE
SETUP:
1. Add indicator to chart
2. Enable desired timeframes (TF1, TF2, etc.)
3. Adjust LVN threshold based on your trading style:
• 20-25% = Very selective (only thinnest zones)
• 30-35% = Balanced (recommended for most markets)
• 40-50% = More zones (higher sensitivity)
INTERPRETATION:
• RED/DARK ZONES = Low trading activity occurred here
• Price tends to move THROUGH these zones quickly
• Similar behavior to Fair Value Gaps (FVG) in Smart Money theory
• Expect acceleration when price enters LVN zones
TRADING STRATEGIES:
1. BREAKOUT TRADING:
- Wait for price to approach LVN zone
- Enter when price breaks into the zone
- Expect rapid movement through the zone
- Target next support/resistance beyond LVN
2. CONFLUENCE ANALYSIS:
- Combine with other SMC concepts (Order Blocks, FVG, Liquidity)
- LVN + FVG overlap = high-probability acceleration zone
- Use higher timeframe LVN as directional bias
3. MULTI-TIMEFRAME:
- Daily LVN = major breakout zones
- 4H LVN = intraday momentum areas
- 15m LVN = scalping opportunities
─────────────────────────────────────────────────────────────
⚠️ IMPORTANT NOTES
WHAT THIS INDICATOR IS:
✓ Market Profile TPO-based LVN detector
✓ Multi-timeframe zone identification tool
✓ Visual representation of low trading activity areas
✓ Complementary to Smart Money Concepts (SMC/ICT)
WHAT THIS INDICATOR IS NOT:
✗ Not a standalone trading system
✗ Not a guaranteed profit generator
✗ Not financial advice
✗ Requires confirmation from price action and other tools
LIMITATIONS:
• Works best on liquid markets with reliable data
• Lower timeframes may produce excessive zones
• Requires understanding of Market Profile concepts
• Performance depends on proper threshold calibration
BEST PRACTICES:
• Start with 1-2 timeframes, add more as needed
• Use higher timeframes for swing trading
• Combine with support/resistance, trendlines, order blocks
• Backtest on your specific instrument before live trading
• Adjust immunity period based on market volatility
─────────────────────────────────────────────────────────────
🔧 SETTINGS GUIDE
TIMEFRAME GROUPS (1-5):
Each group contains:
• Enable toggle - Turn timeframe on/off
• Timeframe selector - Choose period or Auto
• Box color - Zone fill color
• Border color - Zone outline color
GENERAL SETTINGS:
• LVN Threshold (%) - Percentage of max TPO to qualify as LVN
• Show Old LVN Boxes - Keep historical zones visible
• Box Border Width - Visual thickness (1-4)
• Immunity Period - Protection bars for new zones
• Show Timeframe - Display TF label in boxes
• Show Period - Display date range in boxes
• Text Size - Label size adjustment
─────────────────────────────────────────────────────────────
📊 ORIGINALITY & UNIQUENESS
This indicator is original because:
1. TPO-BASED CALCULATION: Uses Market Profile Time-Price-Opportunity methodology instead of traditional volume analysis, making it work on all markets including those without real volume data (Forex, some indices).
2. IMMUNITY SYSTEM: Unique protection mechanism prevents zones from disappearing immediately when price is already within zone boundaries at creation time.
3. TRUE MULTI-TIMEFRAME: Independent calculation for each timeframe with separate zone management, not simple higher timeframe projection.
4. SMART ZONE LIFECYCLE: Zones dynamically extend until price touch, then become static historical references.
5. FVG-LIKE BEHAVIOR: Bridges traditional Market Profile analysis with modern Smart Money Concepts by identifying zones that behave similarly to Fair Value Gaps.
Unlike existing LVN indicators that rely on volume data, this tool uses time-based analysis, making it universal across all market types and compatible with brokers that don't provide accurate volume information.
─────────────────────────────────────────────────────────────
📚 TECHNICAL BACKGROUND
MARKET PROFILE THEORY:
Developed by J. Peter Steidlmayer in the 1980s, Market Profile analyzes market behavior by examining price and time relationships. Low Volume Nodes in traditional profile represent areas where market participants showed minimal interest.
TPO (TIME PRICE OPPORTUNITY):
Instead of counting volume, TPO counts how many time periods (bars) touched each price level. This approach:
• Works on all markets regardless of volume data quality
• Reflects actual time-based market acceptance/rejection
• Reveals psychological price levels through time distribution
CONNECTION TO SMART MONEY CONCEPTS:
Fair Value Gaps (FVG) in ICT methodology represent similar inefficiencies:
• Areas where price moved too quickly
• Imbalances in buying/selling pressure
• Zones that price may revisit or accelerate through
• LVN zones often overlap with FVG locations
─────────────────────────────────────────────────────────────
🎓 RECOMMENDED RESOURCES
To maximize this indicator's effectiveness, study:
• Market Profile fundamentals (TPO, POC, Value Area)
• Smart Money Concepts (FVG, Order Blocks, Liquidity)
• Multi-timeframe analysis techniques
• Volume Profile comparison (understand the difference)
COMPANION INDICATOR:
Consider using "HVN Smart Liquidity" (opposite concept) to identify both high and low volume zones for complete Market Profile analysis.
─────────────────────────────────────────────────────────────
💬 SUPPORT & FEEDBACK
Questions or suggestions? Feel free to comment below or send a private message.
If you find this indicator useful, please boost and share with other traders!
⚠️ DISCLAIMER: This indicator is for educational purposes only. Trading involves risk. Always do your own research and use proper risk management.

Dan Zanger Master Trading System [Premium]
Dan Zanger Master Trading System
Overview
This indicator implements the legendary trading methodology of Dan Zanger, who famously turned $10,775 into over $42 million using pattern recognition and volume analysis. The system combines professional-grade pattern detection, volume analysis, and risk management into a comprehensive trading solution.
----------------------------------------------------------------------------------
Core Features
1. Zanger Volume Ratio (ZVR)
The cornerstone of Zanger's methodology—volume confirms everything.
- Dynamic volume classification: Extreme (≥2x), High (≥1.65x), Moderate (≥1.25x), Low
- Bar coloring by volume intensity for instant visual feedback
- Volume dry-up detection: Identifies when volume contracts to <50% of average—Zanger's key signal that precedes explosive breakouts
2. Pattern Detection Engine
Automatically detects Zanger's favorite chart patterns:
🚩 Bull Flag - 15%+ pole with orderly 20-50% retracement, downward-sloping flag, declining volume
☕ Cup & Handle - U-shaped recovery (12-35% depth), handle in upper half, no undercut of cup low
△ Ascending Triangle - Flat resistance with higher lows, converging range, multiple resistance touches
▽ Descending Triangle - Flat support with lower highs (bearish warning)
◇ Symmetrical Triangle - Converging trendlines with contracting volume
▬ Flat Base - Tight consolidation (<15% range), price near highs, volume drying up
═ Channel - Up/Down/Horizontal channels with parallel bounds
3. Trend Analysis
Four Moving Averages: 10/20/50/200-period (selectable: SMA, EMA, WMA, VWMA)
Trend Score (0-100): Quantifies trend strength based on MA positioning and direction
Golden Cross/Death Cross detection with visual markers
4. Zanger-Style Breakout Detection
Breakouts require ALL of these conditions:
- ✅ Price exceeds resistance with conviction
- ✅ Volume confirms (≥1.5x average)
- ✅ Strong close (upper 25% of bar range)
- ✅ Above rising 50-day MA
- ✅ Preceded by volume dry-up (ideal)
5. "Never Chase" Protection
Zanger's #1 rule implemented: Warns you when price is >5% above breakout level. This prevents costly chasing entries.
6. Risk Management System
Built-in position management following Zanger's rules:
Stop Loss: Default 7% (Zanger uses 5-7%)
Profit Target 1: 15% (take partial profits)
Profit Target 2: 30% (let winners run)
Trailing Stop: Activates after PT1, trails at 10% from highs
Visual stop loss and profit target lines on chart
------------------------------------------------------------------------------------
Dashboard
Real-time information panel showing:
Current ZVR value and classification
Volume dry-up status
Trend score and bias
MA positioning
Active pattern detection
Current signal status
Position P&L and stop levels
---------------------------------------------------------------------------------
Alert System
15+ configurable alerts including:
Pattern breakouts (Bull Flag, Cup & Handle, Triangles, Flat Base)
Extreme volume detection
Volume dry-up alerts
Stop loss/trailing stop triggers
Profit target notifications
Chasing warnings
--------------------------------------------------------------------------------
Settings
Fully customizable parameters:
ZVR thresholds and lookback
MA types and lengths
Pattern detection toggles
Breakout sensitivity
Stop loss and profit target percentages
Visual styling and colors
---------------------------------------------------------------------------------
Zanger's Key Principles Implemented
Volume is King – Every breakout requires volume confirmation
Never Chase – Built-in warning when >5% above breakout
Cut Losses Quickly – 5-7% stop losses
Let Winners Run – Trailing stops after first target
Trade with the Trend – Only buy above rising 50-day MA
Volume Dry-Up – Best breakouts follow volume contraction
Strong Closes – Look for closes in upper 25% of bar
----------------------------------------------------------------------------------
Best Practices
Use on daily charts for swing trading (Zanger's primary timeframe)
Works on stocks with adequate volume (avoid illiquid names)
Combine with market analysis (Zanger trades strong markets)
Wait for pullbacks when chasing warning appears
Honor your stops – capital preservation is priority
-----------------------------------------------------------------------------------
Disclaimer
This indicator is for educational purposes. Past performance does not guarantee future results. Always do your own research and use proper risk management.

Alpha Signal AI ProAlpha Signal AI Pro
Short description:
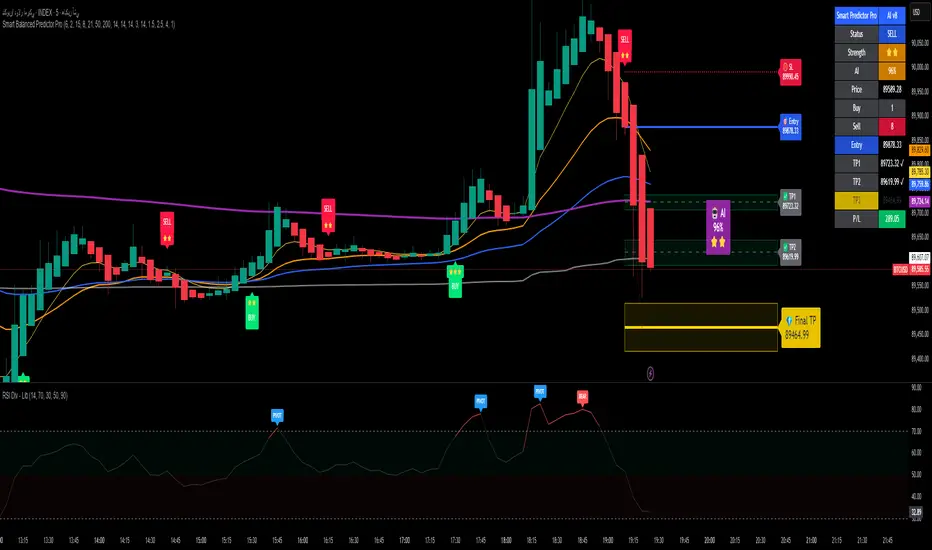
A smart, ensemble-style indicator that blends trend, momentum, volume, volatility, and candle patterns into a score & star system that produces Buy/Sell signals confirmed by MACD crosses. After a signal, it projects smart targets (TP1/TP2/TP3) and a stop-loss derived from ATR, with forward drawings and a control panel for trade management.
Inputs
Minimum Score (min_score): default 6.0 — higher = fewer but stronger signals.
Minimum Stars (min_stars): default 2 — extra filter for strength.
Future Bars (future_bars): default 15 — how far targets/SL are drawn ahead.
Use AI Targets (use_ai_targets): toggle the AI multiplier for TP/SL.
How it works
Computes buy_score/sell_score from: EMA8/21/50/200, RSI & its MA, MACD & Histogram, Stochastic, ADX/DMI, VWAP, Volume, 15m MTF tilt, ROC/Momentum, Heikin Ashi, and candle patterns (engulfing/hammer/shooting star).
Converts scores into Stars (⭐⭐ to ⭐⭐⭐⭐⭐) via tiered thresholds.
Signals fire only when: Score ≥ minimum + Stars ≥ minimum + MACD cross (up = Buy, down = Sell).
On a signal, one active trade is managed until TP3 or SL is reached.
Targets & Stop (AI-driven)
Targets and SL are ATR-based, then adjusted by an AI multiplier derived from: ATR%, momentum (ROC), relative volume, trend strength (ADX), and star rating.
Approximate formulas:
TP1 ≈ 1.5×ATR × AI
TP2 ≈ 2.5×ATR × AI
TP3 ≈ 4.0×ATR × AI
SL ≈ 1.0×ATR ÷ AI
What you’ll see on chart
“Buy/Sell” markers with small Star labels, an Entry line (blue), SL (red dotted), TP1/TP2 (green), TP3 (gold) with shaded target boxes and a guide line towards the final target.
A central AI badge showing the multiplier % and star rating.
A top-right Panel showing status, strength, AI%, price, scores, and during trades: entry, TP1/TP2/TP3, and live P/L.
Alerts
Two ready-made conditions: Buy and Sell when the respective signal triggers.
Add alert: Right click → Add alert → choose the indicator → select condition.
Best practices
Match timeframe to instrument:
Scalping 5–15m: min_score 8, min_stars 3–4.
Swing H1–H4: min_score 7, min_stars 3.
Daily/Equities: min_score 6–7, min_stars 2–3.
Prefer trades with EMA200 and 15m MTF trend alignment.
De-risk around major news.
Use fixed risk per trade (e.g., 1%).
Important notes
Prefer bar close confirmation to avoid mid-bar MACD flips.
Single trade at a time via the in_trade state.
15m MTF uses request.security with lookahead_off; evaluate at close for consistency.
FAQ
Use it standalone? You can, but it’s stronger when combined with S/R zones/trendlines and solid risk management.
Why do targets vary? The AI multiplier adapts TP/SL to current market conditions.
Disclaimer
This is an analytical/educational tool, not financial advice. Always backtest and use appropriate risk management.
Developer note
Built in Pine Script v6, uses var for trade state, clears drawings on the last bar to keep the chart tidy, and raises drawing limits to avoid runtime errors.
Easy Crypto Signal FREEAs you can see, the indicator is doing well, we'll see what happens next, I invite you to the discussion

MinsenAMRS 2.0MinsenAMRS 2.0 - Minsen Advanced Momentum Reversal System
Get an Early Warning as Momentum Weakens
Many classic indicators share a common pain point—they tell you a trend "has already happened." When you see a MACD golden cross or death cross, the price has often already moved a significant distance. Entering at that point often means chasing the move or dealing with a widened stop-loss, making trading passive.
MinsenAMRS 2.0 starts from a completely different premise. It doesn't wait for a trend to be fully formed for confirmation. Instead, it issues an alert in the early stages of trend momentum exhaustion, giving you ample time to observe, analyze, and make decisions at an optimal timing. It's like observing a car at high speed—MinsenAMRS's alert doesn't occur when it has already turned around, but at the moment it eases off the throttle and begins to decelerate.
How Does the System Identify Alert Zones?
MinsenAMRS signals are not based on a single, fixed threshold. They are generated by analyzing the historical distribution characteristics of market momentum and its current dynamic structure.
It continuously assesses the current momentum state relative to its position within the entire historical data, understanding what is normal and what is extreme. On this basis, the system dynamically identifies structural changes in momentum, such as decay and divergence. This means the alert logic adapts to different market volatility environments, with the goal of objectively capturing the early signs of a shift in the internal force driving price movement.
Core: The Alert Marker System
The following explains the meaning of all alert markers on the chart:
🟢 Bullish Direction Alerts
* Green Upward Arrow: Bullish Reversal Alert
The system identifies a significant bottom momentum exhaustion structure, suggesting a downtrend may face reversal.
* Green Small Triangle: Bullish Divergence Alert
Indicates a preliminary bottom divergence signal between price and momentum, requiring close attention.
🔴 Bearish Direction Alerts
* Red Downward Arrow: Bearish Reversal Alert
The system identifies a significant top momentum exhaustion structure, suggesting an uptrend may face reversal.
* Red Small Triangle: Bearish Divergence Alert
Indicates a preliminary top divergence signal between price and momentum, requiring close attention.
🔄 Trend Continuation Alerts
* Blue Diamond: Bullish Continuation Alert
Within an overall uptrend, suggests a short-term pullback is possible, but the primary upward direction is expected to remain intact.
* Orange Diamond: Bearish Continuation Alert
Within an overall downtrend, suggests a short-term rally is possible, but the primary downward direction is expected to remain intact.
Important Note: Alert markers represent zones identified by the system as "requiring focused observation." They are the starting point of the decision-making process, not direct trading instructions.
Information Panel
Displays the current state in real-time:
* Alert Status: Whether there is a current alert signal. (Note: The info table may show preliminary alerts based on the latest price before a candle closes on the current timeframe. It is recommended to wait for candle closure and base decisions on the final signal. This indicator is designed for early warning, so there's no need to worry about missing an entry by waiting for one candle.)
* Price Momentum: Accelerating rise/fall, or stable state.
* Composite Momentum: Extremely Strong, Strong, Neutral, Weak, Extremely Weak.
* Volume Status: Exceptionally High, Moderately High, Low, Normal.
* MACD Bias: Bullish Strengthening/Weakening, Bearish Strengthening/Weakening.
Auxiliary Reference: Synchronized MACD Display
For ease of analysis, the indicator simultaneously displays the traditional MACD and its histogram:
* Line: MACD Fast Line.
* Histogram: MACD Histogram colored according to its numerical state.
Please Note: These are auxiliary references. The core value of the system lies in the Alert Markers above.
How to Use: From Alert to Decision
When an alert marker appears, it signals that "the inertia of market momentum may be encountering resistance here, please observe closely," not "reverse your position immediately."
The correct response process is:
1. Increase Focus: Mark this zone as a key observation area on your chart.
2. Seek Confluent Confirmation: Observe if other technical structures (support/resistance, chart patterns, trendlines) align in this price zone.
3. Wait for Price Confirmation: Patiently wait for the market itself to validate the alert's effectiveness through price action (e.g., key level breaks, specific reversal candle patterns).
4. Formulate a Trading Plan: Only after receiving price action confirmation should you develop a trading plan with clear entry and stop-loss levels.
The core value of this system is to help you pre-identify "potential opportunity zones," saving significant time spent blindly scanning charts and focusing your attention on the most critical junctures of market change.
Usage Framework
It is recommended to adopt a multi-timeframe analysis workflow:
1. On the higher timeframe you use for primary analysis and strategy, watch for MinsenAMRS alert signals. This helps you locate potential areas requiring macro-strategic adjustment.
2. Once an alert appears, switch to a lower operational timeframe chart. On this micro scale, look for specific entry timings and risk management points based on more refined price action and structure.
3. Combine the higher timeframe's potential reversal alert with the lower timeframe's precise tactical signals to build a decision-making loop.
A Straightforward Strategy
After an alert signal appears, wait for the completion of one subsequent candle. Then, observe if the MACD histogram has turned to a confirming color (e.g., after a bullish signal, the histogram turns green). Additionally, confirm aligned directionality by observing the price action on two adjacent timeframes you commonly use before deciding to enter.
About Signal Characteristics
* No Repainting: Signals are finalized and plotted once at candle close. Historical signals do not change.
* Multi-Timeframe Applicable: The core analytical method is applicable across different timeframes.
A Frank Note on Applicability
No tool is universal. Understanding its optimal application scenarios is part of using it correctly:
* In Clear Trend Markets: It can effectively depict the evolution of trend momentum strength, helping you identify the accelerating phase, correction phases, and potential warning zones of terminal exhaustion within the main trend.
* During Ranging or Early Trend Reversal Phases: Its value is highest here, helping you focus on genuine potential turning points rather than ordinary fluctuations within a range.
* In Extreme, One-Sided Markets: Momentum may repeatedly touch extreme zones, and the system will continuously signal a state of "risk accumulation." In such cases, alert signals need to be interpreted in the context of the larger trend background—are they signaling a trend continuation or a genuine prelude to a reversal?
Finally: Sensing the Shift in Power Before the Change
Markets fluctuate on the tides of collective sentiment. The greatest danger lies in being swept away by the current, losing oneself in euphoria or fear. True advantage comes from observation—observing when the tide's force reaches its extreme, observing when the internal momentum driving the trend begins to subtly change.
MinsenAMRS 2.0 aims to be that reliable observation instrument in your hands. It does not predict the direction of the tide but strives to alert you to the subtle signs of a shift in its power, helping you direct your attention to where it matters most at critical moments.
May you remain calm and respond with composure amidst the rhythm of the markets.
Disclaimer & Risk Notice
1. Investment Risk Notice: Trading in financial markets carries risks. Past performance does not guarantee future results. MinsenAMRS 2.0 is solely a technical analysis tool and does not constitute any investment advice or trading signal.
2. Tool Nature Statement: This indicator is designed to assist your trading decisions but cannot replace your own analysis and judgment. Final trading decisions should be made by you, and you bear the corresponding responsibility.
3. Technical Limitations: No technical indicator can predict the market with 100% accuracy. Even the most sophisticated analytical system cannot avoid the impact of unexpected market events.
4. Learning and Adaptation: It is recommended to thoroughly test the indicator on a demo account first, familiarize yourself with its signal characteristics and response patterns, and find the usage method that suits you best.
//====中文版====
MinsenAMRS 2.0 - 明心动能反转预警
在动能衰减的初期,获得预警
许多经典指标都有一个共同的痛点——它们告诉你趋势“已经发生”。当你看到MACD金叉或死叉时,价格往往已经运行了一段距离。这时候入场,要么追高,要么止损空间被放大,交易变得被动。
MinsenAMRS 2.0 的出发点完全不同。它不等待趋势完全成型才确认,而是在趋势动能开始衰竭的初期就发出预警,让你有足够的时间观察、分析,并在最佳时机做出决策。这就像观察一辆高速行驶的汽车——MinsenAMRS的预警不发生在它已经掉头的时候,而是在它松油门、开始减速的那个时刻。
系统如何识别预警区域?
MinsenAMRS的信号并非基于单一、固定的阈值,而是通过分析市场动能的历史分布特征和当前动态结构来实现的。
它会持续评估当前动能状态在整个历史数据中的位置,理解什么是常态、什么是极端。在此基础上,系统动态识别动能运行中的衰减、背离等结构变化。这意味着预警逻辑能适应不同的市场波动环境,其目标是客观捕捉推动价格运动的内在力量发生转变的早期迹象。
核心:预警标记系统
以下是图表上所有预警标记的含义说明:
🟢 看涨方向预警
* 绿色向上箭头:看涨反转预警
系统识别出显著的底部动能衰竭结构,提示下跌趋势可能面临反转。
* 绿色小三角:看涨背离预警
提示价格与动能之间出现初步的底部背离迹象,需密切关注。
🔴 看跌方向预警
* 红色向下箭头:看跌反转预警
系统识别出显著的顶部动能衰竭结构,提示上涨趋势可能面临反转。
* 红色小三角:看跌背离预警
提示价格与动能之间出现初步的顶部背离迹象,需密切关注。
🔄 趋势延续预警
* 蓝色菱形:看涨中继预警
在整体上涨趋势中,提示短期可能出现回调,但主要上升方向预计保持不变。
* 橙色菱形:看跌中继预警
在整体下跌趋势中,提示短期可能出现反弹,但主要下降方向预计保持不变。
重要提示:预警标记是系统识别出的“需要重点观察的区域”,它们是决策流程的起点,而非直接交易的指令。
信息面板
实时显示当前状态:
* 预警状态:当前有无预警信号(信息表格预警:在当前级别K线没有走完时,信息表格会根据最新价格提前预警,建议等待K线闭合后,根据最终信号决策,本指标具有提前预警的特性,不必担心1根K线就入场晚了。)
* 价格动能:加速上涨/下跌,还是平稳状态
* 综合动能:极强、强势、中性、弱势、极弱
* 成交量状态:异常放量、温和放量、缩量、正常
* MACD多空:多头增强/减弱、空头增强/减弱
辅助参考:MACD同步显示
为便于分析,指标同步显示了传统MACD及其柱状图:
* 曲线:MACD快线
* 量柱:根据数值状态着色的MACD柱状图
请注意:这些是辅助参考,系统的核心价值在于上方的预警标记。预警信号的生成独立于MACD的传统金叉死叉逻辑。
如何使用:从预警到决策
当预警标记出现时,它意味着“市场动能的惯性在这里可能遇到阻碍,请重点观察”,而不是“立即反向操作”。
正确的应对流程是:
1. 提高关注度:将此区域标记为你图表上的关键观察区。
2. 寻求共振确认:观察该价格区域是否存在其他技术结构与之共振。
3. 等待价格确认:耐心等待市场自身通过K线行为来验证预警的有效性。
4. 制定交易计划:仅在得到价格行为确认后,才制定包含明确入场点和止损位的交易计划。
本系统的核心价值在于帮你提前锁定“潜在的机会区域”,节省大量盲目扫描图表的时间,并将你的注意力聚焦在市场最关键的变化节点上。
使用框架
建议采用大小级别联动的分析流程:
1. 在你主要分析和决策的大级别图表上,关注MinsenAMRS发出的预警信号。这帮你定位到可能需要宏观策略调整的潜在区域。
2. 当预警出现后,切换到更小的操作级别图表。在这个微观尺度上,依据更精细的价格行为和结构来寻找具体的入场时机与风控点位。
3. 将大级别的潜在转折预警与小级别的精确战术信号相结合,构建决策闭环。
一个粗暴的策略
出现预警信号后,等待走完1根K线之后,MACD量柱转变为同色(例如:出现看涨信号后,MACD量柱变绿),联动观察相邻的大小两个常用级别,确认走势同向,再决策入场。
关于信号特性
* 无未来函数:信号在K线收盘时一次性确定,历史信号不会改变
* 多级别适用:核心分析方法适用于不同的时间框架
坦诚的适用性说明
没有工具是万能的。清晰了解其最佳应用场景,本身就是正确使用的一部分:
* 在明确的趋势行情中:它能有效描绘趋势动能的强度演变,帮助你识别主趋势的加速段、调整段以及可能进入末端衰竭的预警区。
* 在震荡或趋势转换初期:此时它的价值最高,能帮助你关注真正的潜在转折点,而非震荡区间内的普通波动。
* 在极端单边行情中:动能可能反复触及极端区域,系统会持续提示“风险积聚”的状态。这时,预警信号需要你结合更大的趋势背景来理解其含义——是趋势中继,还是真正的转折前兆。
最后:在变化前感知力量的消长
市场在群体情绪的潮汐中波动。最危险的莫过于被潮水裹挟,在狂热或恐惧中迷失自我。真正的优势来自于观察——观察潮汐的力道何时达到极致,观察推动趋势的内在动能何时开始悄然变化。
MinsenAMRS 2.0 的目标,就是成为你手中那个可靠的观察仪。它不预测潮水的方向,但致力于提醒你潮汐力量转换的微妙征兆,帮助你在关键时刻,将注意力投向最该关注的地方。
愿你在市场的律动中,保持冷静,从容应对。
免责声明与风险提示
1. 投资风险提示
金融市场交易存在风险,过往表现不代表未来结果。MinsenAMRS 2.0 仅为技术分析工具,不构成任何投资建议或交易信号。
2. 工具性质说明
本指标旨在辅助您进行交易决策,但不能替代您自己的分析和判断。最终的交易决策应由您自己做出,并承担相应责任。
3. 技术局限性
没有任何技术指标能够100%准确预测市场。即使是最完善的分析系统,也无法避免市场突发性事件带来的影响。
4. 学习与适应
建议在使用前先用模拟账户进行充分测试,熟悉系统的信号特征和响应方式,找到适合自己的使用方法。

Keltner Hull Suite [QuantAlgo]🟢 Overview
The Keltner Hull Suite combines Hull Moving Average positioning with double-smoothed True Range banding to identify trend regimes and filter market noise. The indicator establishes upper and lower volatility bounds around the Hull MA, with the trend line conditionally updating only when price violates these boundaries. This mechanism distinguishes between genuine directional shifts and temporary price fluctuations, providing traders and investors with a systematic framework for trend identification that adapts to changing volatility conditions across multiple timeframes and asset classes.
🟢 How It Works
The calculation foundation begins with the Hull Moving Average, a weighted moving average designed to minimize lag while maintaining smoothness:
hullMA = ta.hma(priceSource, hullPeriod)
The indicator then calculates true range and applies dual exponential smoothing to create a volatility measure that responds more quickly to volatility changes than traditional ATR implementations while maintaining stability through the double-smoothing process:
tr = ta.tr(true)
smoothTR = ta.ema(tr, keltnerPeriod)
doubleSmooth = ta.ema(smoothTR, keltnerPeriod)
deviation = doubleSmooth * keltnerMultiplier
Dynamic support and resistance boundaries are constructed by applying the multiplier-scaled volatility deviation to the Hull MA, creating upper and lower bounds that expand during volatile periods and contract during consolidation:
upperBound = hullMA + deviation
lowerBound = hullMA - deviation
The trend line employs a conditional update mechanism that prevents premature trend reversals. The system maintains the current trend line until price action violates the respective boundary, at which point the trend line snaps to the violated bound:
if upperBound < trendLine
trendLine := upperBound
if lowerBound > trendLine
trendLine := lowerBound
Directional bias determination compares the current trend line value against its previous value, establishing bullish conditions when rising and bearish conditions when falling. Signal generation occurs on state transitions, triggering alerts when the trend state shifts from neutral or opposite direction:
trendUp = trendLine > trendLine
trendDown = trendLine < trendLine
longSignal = trendState == 1 and trendState != 1
shortSignal = trendState == -1 and trendState != -1
The visualization layer creates a trend band by plotting both the current trend line and a two-bar shifted version, with the area between them filled to create a visual channel that reinforces directional conviction.
🟢 How to Use This Indicator
▶ Long and Short Signals: The indicator generates long/buy signals when the trend state transitions to bullish (trend line begins rising) and short/sell signals when transitioning to bearish (trend line begins falling). These state changes represent structural shifts in momentum where price has broken through the adaptive volatility bands, confirming directional commitment.
▶ Trend Band Dynamics: The spacing between the main trend line and its shifted counterpart creates a visual band whose width reflects trend strength and momentum consistency. Expanding bands indicate accelerating directional movement and strong trend persistence, while contracting or flattening bands suggest decelerating momentum, potential trend exhaustion, or impending consolidation. Monitoring band width provides early warning of regime transitions from trending to range-bound conditions.
▶ Preconfigured Presets: Three optimized parameter sets accommodate different trading styles and timeframes. Default (14, 20, 2.0) provides balanced trend identification suitable for daily charts and swing trading, Fast Response (10, 14, 1.5) delivers aggressive signal generation optimized for intraday scalping and momentum trading on 1-15 minute timeframes, while Smooth Trend (18, 30, 2.5) offers conservative trend confirmation ideal for position trading on 4-hour to daily charts with enhanced noise filtration.
▶ Built-in Alerts: Three alert conditions enable automated monitoring - Bullish Trend Signal triggers on long setup confirmation, Bearish Trend Signal activates on short setup confirmation, and Trend Change alerts on any directional transition. These notifications allow you to respond to regime shifts without continuous chart monitoring.
▶ Color Customization: Five visual themes (Classic, Aqua, Cosmic, Ember, Neon, plus Custom) accommodate different chart backgrounds and display preferences, ensuring optimal contrast and visual clarity across trading environments.

Zig Zag & Trendlines with Dynamic Threshold ATRPercentage Zig Zag with Dynamic Threshold
This Pine Script indicator is an advanced Zig Zag tool that identifies and tracks price pivots based on a percentage move required for reversal, offering a clear visual representation of volatility-adjusted trends.
Core Functionality (The Reversal Threshold):
Unlike standard Zig Zag indicators that use a fixed price difference, this indicator calculates the required reversal size (%X) dynamically using the Average True Range (ATR).
It calculates the ATR as a percentage of the current price (ATR%).
The final threshold is this ATR% multiplied by a user-defined factor (default 3x).
This means the reversal threshold is wider during volatile periods and narrower during quiet periods, adapting automatically to market conditions. Users can optionally revert to a fixed percentage if desired.
Trend Extension Lines:
The indicator draws two unique, dynamic trend lines connecting the last two significant Highs and the last two significant Lows. Crucially, these lines do not wait for the entire Zig Zag leg to confirm:
If the price is actively forming a new up-leg, the High Extension Line connects the last confirmed High to the current extreme high of the active move.
The Low Extension Line functions similarly for the downtrend.
This feature allows the user to visualize dynamic support and resistance levels based on the current, active trend structure defined by the percentage threshold.

APEX TREND: Macro & Hard Stop SystemAPEX TREND: Macro & Hard Stop System
The APEX TREND System is a composite trend-following strategy engineered to solve the "Whipsaw" problem inherent in standard breakout systems. It orchestrates four distinct technical theories—Macro Trend Filtering, Volatility Squeeze, Momentum, and Volatility Stop-Loss—into a single, hierarchical decision-making engine.
This script is not merely a collection of indicators; it is a rules-based trading system designed for Swing Traders (Day/Week timeframes) who aim to capture major trend extensions while strictly managing downside risk through a "Hard Stop" mechanism.
🧠 Underlying Concepts & Originality
Many trend indicators fail because they treat all price movements equally. The APEX TREND differentiates itself by applying an "Institutional Filter" logic derived from classic Dow Theory and Modern Volatility Analysis.
1. The Macro Hard Stop (The 200 EMA Logic)
Origin: Based on the institutional mandate that “Nothing good happens below the 200-day moving average.”
Function: Unlike standard super trends that flip constantly in sideways markets, this system integrates a 200-period Exponential Moving Average (EMA) as a non-negotiable "Hard Stop."
Synergy: This acts as the primary gatekeeper. Even if the volatility engine signals a "Buy," the system suppresses the signal if the price is below the Macro Baseline, effectively filtering out counter-trend traps.
2. The Volatility Engine (Squeeze Theory)
Origin: Derived from John Carter’s TTM Squeeze concept.
Function: The script identifies periods where Bollinger Bands (Standard Deviation) contract inside Keltner Channels (ATR). This indicates a period of potential energy build-up.
Synergy: The system only triggers an entry when this energy is released (Breakout) AND coincides with Linear Regression Momentum, ensuring the breakout is genuine.
3. Anti-Chop Filter (ADX Integration)
Origin: J. Welles Wilder’s Directional Movement Theory.
Function: A common failure point for trend systems is low-volatility chop. This script utilizes the Average Directional Index (ADX).
Synergy: If the ADX is below the threshold (Default: 20), the market is deemed "Choppy." The script visually represents this by painting candles GRAY, signaling a "No-Trade Zone" regardless of price action.
4. The "Run Trend" Stop Loss (Factor 4.0 ATR)
Origin: Adapted from the Turtle Trading rules regarding volatility-based stops.
Function: Standard Trailing Stops (usually Factor 3.0) are too tight for crypto or volatile equities on daily timeframes.
Optimization: This system employs a wider ATR Multiplier of 4.0. This allows the asset to fluctuate naturally within a trend without triggering a premature exit, maximizing the "Run Trend" potential.
🛠 How It Works (The Algorithm)
The script processes data in a specific order to generate a signal:
Check Macro Trend: Is Price > EMA 200? (If No, Longs are disabled).
Check Volatility: Is ADX > 20? (If No, all signals are disabled).
Check Volume: Is Current Volume > 1.2x Average Volume? (Confirmation of institutional participation).
Trigger: Has a Volatility Breakout occurred in the direction of the Macro Trend?
Execution: If ALL above are true -> Generate Signal.
🎯 Strategy Guide
1. Long Setup (Bullish)
Signal: Look for the Green "APEX LONG" Label.
Condition: The price must be ABOVE the White Line (EMA 200).
Execution: Enter at the close of the signal candle.
Stop Loss: Initial stop at the Green Trailing Line.
2. Short Setup (Bearish)
Signal: Look for the Red "APEX SHORT" Label.
Condition: The price must be BELOW the White Line (EMA 200).
Execution: Enter at the close of the signal candle.
Stop Loss: Initial stop at the Red Trailing Line.
3. Exit Rules (Crucial)
This system employs a Dual-Exit Mechanism:
Soft Exit (Profit Taking): Close the position if the price crosses the Trailing Stop Line (Green/Red line). This locks in profits during a trend reversal.
Hard Exit (Emergency): Close the position IMMEDIATELY if the price crosses the White EMA 200 Line against your trade. This prevents holding a position during a major market regime change.
⚙️ Settings
Momentum Engine: Adjust Bollinger Band/Keltner Channel lengths to tune breakout sensitivity.
Apex Filters: Toggle the EMA 200 or ADX filters on/off to adapt to different asset classes.
Risk Management: The ATR Multiplier (Default 4.0) controls the width of the trailing stop. Lower values = Tighter stops (Scalping); Higher values = Looser stops (Swing).
Disclaimer: This script is designed for trend-following on higher timeframes (4H, 1D, 1W). Please backtest on your specific asset before live trading.

DarkPool's RSi DarkPool's RSi is an enhanced momentum oscillator designed to automatically detect structural discrepancies between price action and the Relative Strength Index. While retaining the standard RSI visualization, this script overlays advanced divergence recognition logic to identify potential trend reversals.
The tool identifies pivot points in real-time and compares recent peaks and valleys against historical data. When the momentum of the RSI contradicts the direction of price action, the indicator highlights these events using dynamic trendlines, shape markers, and background coloring. A built-in dashboard table provides an immediate status check of active divergence signals.
Key Features
Automated Divergence Detection: Automatically spots both Regular Bullish and Regular Bearish divergences based on pivot lookback settings.
Dynamic Visuals: Draws physical lines connecting RSI peaks or troughs to visualize the divergence angle, alongside triangle markers indicating the signal direction.
Active Status Dashboard: A data table located on the chart monitors the current state of the market, flagging signals as "Active" when detected.
Standard RSI Overlay: Includes standard Overbought (70) and Oversold (30) reference lines for traditional momentum trading.
How to Use
1. Reading the Standard RSI The black line represents the Relative Strength Index.
Overbought (Above 70): Suggests the asset may be overvalued and due for a pullback.
Oversold (Below 30): Suggests the asset may be undervalued and due for a bounce.
Midline (50): Acts as a trend filter; values above 50 indicate bullish momentum, while values below 50 indicate bearish momentum.
2. Trading Divergences The primary function of this tool is to identify reversal setups.
Bullish Divergence (Green Triangle/Line): Occurs when Price makes a Lower Low, but the RSI makes a Higher Low. This indicates that selling momentum is exhausting and a price increase may follow.
Bearish Divergence (Red Triangle/Line): Occurs when Price makes a Higher High, but the RSI makes a Lower High. This indicates that buying momentum is fading and a price decrease may follow.
3. Visual Aids
Lines: The script draws solid lines directly on the RSI pane connecting the relevant pivot points to confirm the divergence slope.
Background Color: When a divergence is detected, the background of the indicator pane will highlight briefly (Green for Bullish, Red for Bearish) to draw attention to the new signal.
4. The Dashboard A small table in the bottom right corner tracks the status of the signals.
Status: ACTIVE: A divergence has been detected within the last 10 bars.
Status: None: No recent divergence patterns have been identified.
Disclaimer This indicator is provided for educational and informational purposes only. It does not constitute financial advice, investment recommendations, or a guarantee of future results. Trading cryptocurrencies and financial markets involves a high level of risk. Always perform your own due diligence before making any trading decisions.

Long-Term Strategy: 1-Year Breakout + 6-Month ExitDescripción (Description): (Copia y pega todo lo que está dentro del recuadro de abajo)
Description
This is a long-term trend-following strategy designed to capture major market moves while filtering out short-term noise. It is based on the classic principle of "buying strength" (Breakouts) and allowing profits to run, while cutting losses when the medium-term trend reverses.
How it Works (Logic)
1. Entry Condition (Long Only): The strategy looks for a significant display of strength. It enters a Long position only when two conditions are met simultaneously:
Price Breakout: The closing price exceeds the highest high of the last 252 trading days (approximately 1 year). This ensures we are entering during a strong momentum phase.
Trend Filter: The SuperTrend indicator (Settings: ATR 10, Factor 3.0) must be bullish. This acts as a confirmation filter to avoid false breakouts in choppy markets.
2. Exit Condition: The strategy uses a trailing stop based on price action, not a fixed percentage.
It closes the position when the price closes below the lowest low of the last 126 trading days (approximately 6 months).
This wide exit allows the trade to "breathe" during normal market corrections without exiting the position prematurely.
Settings & Risk Management
Capital Usage: The script is configured to use 10% of equity per trade to reflect realistic risk management (compounding).
Commissions: Included at 0.1% to simulate real trading costs.
Slippage: Included (3 ticks) to account for market execution variability.
Best Use: This strategy is intended for higher timeframes (Daily or Weekly) on trending assets like Indices, Crypto, or Commodities.

QuantMotions - TPR Sentinel LineTPR Sentinel Line is an advanced adaptive Support/Resistance system that combines multi-layered trend analysis with a directional Time-Price Ratio (TPR) engine. The indicator dynamically builds a stabilized support or resistance line that adjusts to market volatility, trend strength, ATR expansion and contraction, and real-time slope changes.
This creates a high-precision, self-adjusting trend barrier that acts as support in uptrends, resistance in downtrends, and a neutral anchor during sideways phases.
Key Features
✔ Adaptive Trend Base
- A composite trend model blending:
- Kijun-style midpoint
- Donchian midline
- SMA & EMA smoothing
This creates a stable baseline that reacts smoothly but reliably to structural trend shifts.
✔ Directional TPR Calculation
The indicator measures slope across short, medium, and long trend windows, normalizes it with ATR, and determines:
- Trend direction
- Trend strength
- Momentum quality
✔ Dynamic Support/Resistance Line
Depending on trend direction:
- In uptrends → the line becomes adaptive support
- In downtrends → the line becomes adaptive resistance
- In neutral phases → the line centers around the smoothed trend base
A built-in lag factor prevents unrealistic jumps and keeps the level stable.
✔ Automatic Support/Resistance Zones
The indicator expands the main line into upper and lower zones based on ATR and trend strength, creating a dynamic volatility envelope around the trend structure.
✔ Signals & Alerts
- Support bounce
- Resistance rejection
- Breakouts above/below the dynamic line
These events help identify high-probability continuation or reversal moments.
✔ Information Panel
A real-time status table displays:
- Trend direction
- Trend strength
- Current S/R level
🎯 Ideal For
- Precision entries on pullbacks
- Detecting trend shifts earlier
- Identifying strong or weak trend phases
- Adaptive take-profit and stop-loss zones
- Filtering false breakouts
💡 Summary
TPR Sentinel Line gives you a living, breathing support/resistance structure that evolves with the market.
Instead of relying on static levels, you get a continuously adapting trend barrier that reflects real strength, real volatility, and real momentum.
A powerful tool for traders who want structure, clarity, and trend confidence.

SUMA Fib Channels with JMA Ribbon TrendlinesI made this indicator because I was tired of drawing the lines everyday and adding fib lines, so I wanted to automated my daily process so I can be more productive,
-The Green Yellow and red line on the right side of the indicator are the Fib Regression
- The Green top of the line/sell the premium, wait for the price to fully stop and retest this area before you sell (double top or M pattern)
- Yellow is the 0.618 Possibly reversal and in most cases a highly likely area for price to comeback to this point.
- The Red/Buy price is at discount, Wait for the price to fully stop and retest this area before buying (double bottom or W pattern)
The channels lines are easy to read and self explanatory
- Price Above green lines or channel = bullish (always wait for retest and to break above resistance line (lines above price))
- Price Below red lines or channel = Bearish (always wait for retest and to break below support line (lines below price))

Market Energy & Direction DashboardMarket Energy & Direction Dashboard - Daytrading
Overview
A comprehensive real-time market internals dashboard that combines NYSE TICK, NYSE Advance-Decline (ADD) momentum, VIX direction, and relative volume into a single visual traffic light system with intelligent signal synthesis. Designed for active daytraders who need instant confirmation of market direction and energy based on momentum alignment across all major internals.
What It Does
This indicator synthesizes multiple market internals using directional momentum analysis rather than static thresholds to provide clear, actionable signals:
• Traffic Light System: Single glance confirmation of market state
o Bright Green: Maximum bullish - all internals aligned (TICK + ADD rising + VIX falling + volume)
o Bright Red: Maximum bearish - all internals aligned (TICK + ADD falling + VIX rising + volume)
o Yellow: Exhaustion warning - TICK at extremes, potential reversal imminent
o Moderate Colors: Partial alignment - some confirmation but not complete
o Gray: Choppy, neutral, or conflicting signals
• Real-Time Dashboard displays:
o Current TICK value with exhaustion warnings
o Current ADD with directional momentum indicator (↑ rising = breadth improving, ↓ falling = breadth deteriorating, ± compression)
o VIX level with directional indicator (↓ declining = bullish, ↑ rising = bearish, ± compression = neutral)
o Relative volume (current vs 20-period average)
o Composite status message synthesizing all data into clear directional summary
Key Features
✓ Momentum-based analysis - all indicators show direction/change, not just levels ✓ Intelligent signal hierarchy from "Maximum" to "Moderate" based on internal alignment ✓ ADD directional momentum - catches breadth shifts early, works in all market conditions ✓ VIX directional analysis - shows if fear is increasing, decreasing, or stagnant ✓ Color-coded traffic light for instant decision making ✓ Detects TICK/ADD divergences (conflicting signals = caution) ✓ Exhaustion warnings at extreme TICK levels (±1000+) ✓ Composite status messages - "Maximum Bull", "Strong Bull", "Moderate Bull", etc. ✓ Customizable thresholds for all parameters ✓ Moveable dashboard (9 position options) ✓ Built-in alerts for all signal strengths, exhaustion, and divergences
How To Use
Setup:
1. Add indicator to your main trading chart (SPY, ES, NQ, etc.)
2. Default settings work well for most traders, but you can customize:
o TICK Extreme Level (default 1000)
o ADD Compression Threshold (default 100 - detects when breadth is stagnant)
o VIX Elevated Level (default 20)
o VIX Compression Threshold (default 2% - detects low volatility)
o Volume Threshold (default 1.5x average)
3. Position dashboard wherever convenient on your chart
Reading The Signals:
Signal Hierarchy (Strongest to Weakest):
MAXIMUM SIGNALS ⭐ (Brightest colors - All 4 internals aligned)
• "✓ MAXIMUM BULL": TICK bullish + ADD rising (↑) + VIX falling (↓) + Volume elevated
o This is the holy grail setup - all momentum aligned, highest conviction longs
• "✓ MAXIMUM BEAR": TICK bearish + ADD falling (↓) + VIX rising (↑) + Volume elevated
o Perfect storm bearish - all momentum aligned, highest conviction shorts
STRONG SIGNALS (Bright colors - Core internals aligned)
• "✓ STRONG BULL": TICK bullish + ADD rising (↑)
o Strong confirmation even without VIX/volume - breadth supporting the move
• "✓ STRONG BEAR": TICK bearish + ADD falling (↓)
o Strong confirmation - both momentum and breadth deteriorating
MODERATE SIGNALS (Faded colors - Partial confirmation)
• "MODERATE BULL": TICK bullish but ADD not confirming direction
o Proceed with caution - momentum present but breadth questionable
• "MODERATE BEAR": TICK bearish but ADD not confirming direction
o Proceed with caution - selling but breadth not fully participating
WARNING SIGNALS
• "⚠ EXHAUSTION" (Yellow): TICK at ±1000+ extremes
o Potential reversal zone - prepare to fade or take profits
o Often marks blow-off tops or capitulation bottoms
NEUTRAL/AVOID
• "CHOPPY/NEUTRAL" (Gray): Conflicting signals or low conviction
o Stay out or reduce size significantly
Individual Indicator Interpretation:
TICK:
• Green: Bullish momentum (>+300)
• Red: Bearish momentum (<-300)
• Yellow: Exhaustion (±1000+)
• Gray: Neutral
ADD (Advance-Decline):
• Green (↑): Breadth improving - more stocks participating in the move
• Red (↓): Breadth deteriorating - fewer stocks participating
• Gray (±): Breadth stagnant - no clear participation trend
VIX:
• Green (↓): Fear declining - healthy environment for rallies
• Red (↑): Fear rising - risk-off mode, supports downward moves
• Gray (±): Volatility compression - often precedes explosive moves
Volume:
• Green: High conviction (>1.5x average)
• Gray: Low conviction
Trading Strategy:
1. Wait for "MAXIMUM" or "STRONG" signals for highest probability entries
o Maximum signals = go full size with confidence
o Strong signals = good conviction, normal position sizing
2. Confirm directional alignment:
o For longs: Want ADD ↑ (rising) and VIX ↓ (falling)
o For shorts: Want ADD ↓ (falling) and VIX ↑ (rising)
3. Use exhaustion warnings (yellow) to:
o Take profits on existing positions
o Prepare counter-trend entries
o Tighten stops
4. Avoid "MODERATE" signals unless you have strong conviction from other analysis
o These work best as confirmation for existing setups
o Not strong enough to initiate new positions alone
5. Never trade "CHOPPY/NEUTRAL" signals
o Gray means stay out - preserve capital
o Wait for clear alignment
6. Watch for divergences:
o Price making new highs but ADD ↓ (falling) = distribution warning
o Price making new lows but ADD ↑ (rising) = potential bottom
o Divergence alert will notify you
Best Practices:
• Use on 1-5 minute charts for daytrading
• Combine with your price action or technical setup (support/resistance, trendlines, patterns)
• The dashboard confirms when to take your setup, not what setup to take
• Most effective during regular market hours (9:30 AM - 4:00 PM ET) when volume is present
• The strongest edge comes from "MAXIMUM" signals - wait for these for best risk/reward
• Pay special attention to ADD direction - it's the most predictive breadth indicator
• VIX compression (gray ±) often signals upcoming volatility expansion - prepare for bigger moves
Customization Option
All thresholds are adjustable in settings:
• TICK Extreme: Higher = fewer exhaustion warnings (try 1200-1500 for less sensitivity)
• ADD Compression Threshold: Change detection sensitivity
o Default 100 = balanced
o Lower (50) = more sensitive to small breadth changes
o Higher (200-300) = only shows major breadth shifts
• VIX Elevated: Adjust for current volatility regime (15-25 typical range)
• VIX Compression Threshold:
o Default 2% = balanced
o Lower (0.5-1%) = catches subtle VIX changes
o Higher (3-5%) = only shows significant VIX moves
• Volume Threshold: Lower for quieter stocks/times, higher for more confirmation
Alerts Available
• Maximum Bullish: All 4 internals aligned bullish (TICK + ADD↑ + VIX↓ + Volume)
• Maximum Bearish: All 4 internals aligned bearish (TICK + ADD↓ + VIX↑ + Volume)
• Strong Bullish: TICK bullish + ADD rising
• Strong Bearish: TICK bearish + ADD falling
• Exhaustion Warning: TICK at extreme levels
• Divergence Warning: TICK and ADD directions conflicting
Understanding the Signal Synthesis
The indicator uses intelligent logic to combine all internals:
"MAXIMUM" Signals require:
• TICK direction (bullish/bearish)
• ADD momentum (rising/falling) in same direction
• VIX direction (falling for bulls, rising for bears)
• Volume elevated (>1.5x average)
"STRONG" Signals require:
• TICK direction (bullish/bearish)
• ADD momentum (rising/falling) in same direction
• (VIX and volume are bonuses but not required)
"MODERATE" Signals:
• TICK showing direction
• But ADD not confirming or contradicting
• Weakest actionable signal
This hierarchy ensures you know exactly how much conviction the market has behind any move.
Technical Details
• Pulls real-time data from NYSE TICK (USI:TICK), NYSE ADD (USI:ADD), and CBOE VIX
• ADD direction calculated using bar-to-bar change with compression detection
• VIX direction calculated using bar-to-bar percentage change
• Volume calculation uses 20-period simple moving average
• Dashboard updates every bar
• No repainting - all calculations based on closed bar data
Who This Is For
• Active daytraders of stocks, futures (ES/NQ), and options
• Scalpers needing quick directional confirmation with multiple internal alignment
• Swing traders looking to time intraday entries with maximum confluence
• Volatility traders who monitor VIX behavior
• Market makers and professionals who trade based on breadth and internals
• Anyone who monitors market internals but wants intelligent synthesis vs raw data
Tips For Success
Trading Philosophy:
• Quality over quantity - wait for "MAXIMUM" signals for best results
• One "MAXIMUM" signal trade is worth five "MODERATE" signal trades
• Gray/neutral is not a sign of missing opportunity - it's protecting your capital
Signal Confidence Levels:
1. MAXIMUM (95%+ confidence) - Trade these aggressively with full size
2. STRONG (80-85% confidence) - Trade these with normal position sizing
3. MODERATE (60-70% confidence) - Only if confirmed by strong technical setup
4. CHOPPY/NEUTRAL - Do not trade, wait for clarity
Advanced Techniques:
• Breadth divergences: Watch for price making new highs while ADD shows ↓ (falling) = major warning
• VIX/Price divergences: Rallies with rising VIX (↑) are usually false moves
• Volume confirmation: "MAXIMUM" signals with 2x+ volume are the absolute best
• Compression zones: When both ADD and VIX show compression (±), expect explosive breakout soon
• Sequential signals: Back-to-back "MAXIMUM" signals in same direction = strong trending day
Common Patterns:
• Opening surge with "MAXIMUM BULL" that shifts to "EXHAUSTION" (yellow) = fade the high
• Selloff with "MAXIMUM BEAR" followed by ADD ↑ (rising) divergence = potential reversal
• Choppy morning followed by "MAXIMUM" signal afternoon = best trending opportunity
Example Scenarios
Perfect Bull Entry:
• Bright green signal box
• TICK: +650
• ADD: +1200 (↑)
• VIX: 18.30 (↓)
• Volume: 2.3x
• Status: "✓ MAXIMUM BULL" → ALL SYSTEMS GO - Take aggressive long positions
Strong Bull (Good Confidence):
• Green signal box (slightly less bright)
• TICK: +500
• ADD: +800 (↑)
• VIX: 19.50 (±)
• Volume: 1.2x
• Status: "✓ STRONG BULL" → Good long setup - breadth confirming even without VIX/volume
Caution Bull (Moderate):
• Faded green signal box
• TICK: +400
• ADD: +900 (↓)
• VIX: 20.10 (↑)
• Volume: 0.9x
• Status: "MODERATE BULL" → CAUTION - TICK bullish but breadth deteriorating and VIX rising = weak rally
Exhaustion Warning:
• Yellow signal box
• TICK: +1350 ⚠
• ADD: +2100 (↑)
• VIX: 17.20 (↓)
• Volume: 1.8x
• Status: "⚠ EXHAUSTION" → Take profits or prepare to fade - TICK overextended despite good internals
Divergence Setup (Potential Reversal):
• Faded green signal
• TICK: +300
• ADD: +1800 (↓)
• VIX: 21.50 (↑)
• Volume: 1.6x
• Status: "MODERATE BULL" → WARNING - Price rallying but breadth collapsing and fear rising = distribution
Perfect Bear Entry:
• Bright red signal box
• TICK: -780
• ADD: -1600 (↓)
• VIX: 24.80 (↑)
• Volume: 2.5x
• Status: "✓ MAXIMUM BEAR" → Perfect short setup - all momentum bearish with conviction
Compression (Wait Mode):
• Gray signal box
• TICK: +50
• ADD: -200 (±)
• VIX: 16.40 (±)
• Volume: 0.7x
• Status: "CHOPPY/NEUTRAL" → STAY OUT - Volatility compression, no conviction, await breakout
Performance Optimization
Best Market Conditions:
• Works excellent in trending markets (up or down)
• Particularly powerful during high-volume sessions (first/last hours)
• "MAXIMUM" signals most reliable during 9:45-11:00 AM and 2:00-3:30 PM ET
Less Effective During:
• Lunch period (11:30 AM - 1:30 PM) - lower volume reduces signal quality
• Low-volatility environments - compression signals dominate
• Major news events in first 5 minutes - wait for internals to stabilize
Recommended Use Cases:
• Scalping: Trade only "MAXIMUM" signals for quick 5-15 minute moves
• Daytrading: Use "MAXIMUM" and "STRONG" signals for position entries
• Swing entries: Use "MAXIMUM" signals for optimal intraday entry timing
• Exit timing: Use "EXHAUSTION" (yellow) warnings to take profits
________________________________________
Pro Tip: Create a dedicated workspace with this indicator on SPY/ES/NQ charts. Set alerts for "MAXIMUM BULL", "MAXIMUM BEAR", and "EXHAUSTION" signals. Most professional traders only trade the "MAXIMUM" setups and ignore everything else - this alone can dramatically improve win rates.

Market Momentum in Premium & Discount-Delta @MaxMaserati 3.0Market Delta Momentum in Premium & Discount-Delta @MaxMaserati 3.0
══════════════════════════════════════════════════════
Overview
The MMPD 3.0 indicator is an advanced momentum oscillator that combines market structure analysis with institutional order flow concepts. It transforms price action into a normalized 0-100 scale, identifying premium and discount zones where institutional traders typically operate, while simultaneously tracking momentum through specialized body close candles and multi-timeframe synchronization.
This indicator is designed for traders who want to:
══════════════════════════════════════════════════════
Identify high-probability reversal zones using premium/discount analysis
Track momentum divergence between price and the MMPD oscillator
Recognize institutional rejection and acceptance zones
Synchronize multiple timeframes for confluence-based trading decisions
Core Methodology
══════════════════════════════════════════════════════
MMPD Calculation
The Market Delta Momentum indicator uses a proprietary calculation that:
Normalizes price position within a specific period range (0-100 scale)
Applies double smoothing to filter noise
Calculates a balance line (similar to a moving average) to determine bullish/bearish momentum
The relationship between the MMPD line and balance line creates directional candles
Key Zones:
══════════════════════════════════════════════════════
90-100: Extreme Premium (Institutional Selling Zone)
80-90: High Premium (Caution Zone)
65-80: Premium (Bullish Bias)
50-65: Light Premium (Neutral-Bullish)
35-50: Light Discount (Neutral-Bearish)
20-35: Discount (Bearish Bias)
10-20: High Discount (Institutional Buying Zone)
0-10: Extreme Discount (High Probability Buy Zone)
MMM 3.0 Body Close Logic BC and the MMPD 3.0 Body Close Logic MBC
══════════════════════════════════════════════════════
1️⃣ Body Close Analysis (BC & MBC)
Price Body Close (BC)
Bullish BC: Price closes above the previous high AND closes above its open (green candle showing aggressive buying)
Bearish BC: Price closes below the previous low AND closes below its open (red candle showing aggressive selling)
No Body Close (NBC): All other candles - representing consolidation, pause, or loss of momentum
MMPD Body Close (MBC)
Bullish MBC: MMPD closes higher than previous MMPD structure (continuation or reversal momentum)
Bearish MBC: MMPD closes lower than previous MMPD structure (continuation or reversal momentum)
MNBC: MMPD No Body Close - weak or ranging MMPD momentum
BC + MBC Confirmation
When Price BC and MMPD MBC align in the same direction, it signals high-conviction momentum:
Deep Green: Bullish BC + Bullish MBC (Strongest Bullish Signal)
Pale Green: Bullish BC only (Moderate Bullish Signal)
Deep Red: Bearish BC + Bearish MBC (Strongest Bearish Signal)
Pale Pink: Bearish BC only (Moderate Bearish Signal)
2️⃣ Momentum Synchronization System
The indicator compares MBC (MMPD Body Close) momentum against BC (Price Body Close) momentum to identify divergence and synchronization:
Synchronized States:
BULLISH+: High volatility bullish synchronization (BC+MBC aligned, high ATR)
BULLISH-: Low volatility bullish synchronization (BC+MBC aligned, low ATR)
BEARISH+: High volatility bearish synchronization (BC+MBC aligned, high ATR)
BEARISH-: Low volatility bearish synchronization (BC+MBC aligned, low ATR)
SYNCHRONIZED: Both MMPD and Price moving together (standard bullish or bearish move)
Divergence States (Reversal Warnings):
MMPD FAST | PRICE SLOW: MMPD showing strong directional MBC candles while Price shows NBC (pause/consolidation) - Reversal Warning!
If MMPD is bullish MBC but Price is NBC → Potential Bearish Reversal
If MMPD is bearish MBC but Price is NBC → Potential Bullish Reversal
Status Indicators:
BULL / BEAR: Standard synchronized moves
BULL+ / BEAR+: High volatility synchronized moves (aggressive trending)
BULL- / BEAR-: Low volatility synchronized moves (grinding trends)
POT. BULL / POT. BEAR: Potential reversal zones (divergence detected)
BALANCED: Neutral conditions, no clear momentum alignment which is price efficiency
3️⃣ Premium/Discount Breakout Markers
🔴 Red Circle Dots (Premium Exit)
Appears when MMPD closes below 80 after being completely in the 80-100 extreme premium zone
Signals institutional distribution complete, potential reversal or correction
🟢 Green Circle Dots (Discount Exit)
Appears when MMPD closes above 20 after being completely in the 0-20 extreme discount zone
Signals institutional accumulation complete, potential rally or reversal
🔴 Red Squares (Premium Rejection)
Appears on the first candle that fails to touch 80-100 after a Bullish MBC touched that zone
Indicates rejection of premium pricing, bearish signal
🟢 Green Squares (Discount Rejection)
Appears on the first candle that fails to touch 0-20 after a Bearish MBC touched that zone
Indicates rejection of discount pricing, bullish signal
🔻 Red Triangles Down (Bearish Midline Rejection)
Signals potential bearish Resumption
🔺 Green Triangles Up (Bullish Midline Bounce)
Signals potential Bullish Resumption
4️⃣ Multi-Timeframe Dashboard with Candle time to close
The MTF table displays:
6 customizable timeframes (default: 5min, 15min, 1H, 4H, Daily, Weekly)
Premium/Discount Status with color-coded zones for each timeframe
Time to Close (T2C): Live countdown timer for each timeframe candle close
Red warning color when the candle closing time is imminent
4H timeframe auto-detects exchange-specific session starts (ES, NQ, CL, GC, etc.)
Momentum Sync Status: Shows the current synchronization state between MMPD and Price across the chart timeframe
Color Coding:
Premium zones: Green/Cyan colors
Discount zones: Purple/Magenta colors
Intensity increases with extremeness (darker = more extreme)
5️⃣ Delta MMPD Alternative View
Toggle between two oscillator calculations:
MMPD: Original MMPD
Delta MMPD: Volume-weighted delta calculation emphasizing buying/selling pressure
TIPS
══════════════════════════════════════════════════════
Use Multi-Timeframe Confluence: The strongest signals occur when multiple timeframes align in premium/discount zones
Wait for Body Close Confirmation: BC+MBC alignment = highest probability setups
Respect Momentum Sync Warnings: "MMPD FAST | PRICE SLOW" is a critical reversal warning
Trade Premium → Discount or Discount → Premium: Mean reversion from extremes offers best risk/reward
Combine with Price Action: MMPD is a momentum oscillator - always confirm with price structure (support/resistance, trendlines, chart patterns)
Educational Notes
══════════════════════════════════════════════════════
What is Premium/Discount Pricing?
Institutional traders operate based on value zones:
Premium: Price is expensive relative to recent range - institutions distribute (sell)
Discount: Price is cheap relative to recent range - institutions accumulate (buy)
Fair Value (50 line): Equilibrium pricing where institutions pause
MMM 3.0 Body Close Approach Importance
══════════════════════════════════════════════════════
BC (Body Close): Shows price commitment and aggressivity
NBC (No Body Close): Shows indecision, consolidation, or loss of momentum
Consecutive BC candles = strong momentum
NBC candles breaking BC sequence = momentum loss → potential reversal
Momentum Synchronization Theory
══════════════════════════════════════════════════════
When MMPD (momentum) moves aggressively but Price shows NBC (pause), it indicates:
Momentum exhaustion
Smart money distribution/accumulation
Imminent reversal as retail traders get trapped
⚠️ Disclaimer
This indicator is for educational purposes only. Past performance does not guarantee future results. Always practice proper risk management and never risk more than you can afford to lose. Trading involves substantial risk of loss. The creator assumes no responsibility for trading losses incurred using this indicator.

Flout Ranges + STDVs [bilal]# Flout Ranges + STDVs
## What It Does
Automatically draws FLOUT, CBDR, and ASIA session ranges with standard deviation levels and highlight zones. Perfect for ICT-style trading and session-based strategies.
## Main Features
**📊 Session Ranges**
- FLOUT, CBDR, and ASIA ranges drawn automatically
- Works for both Indices and Forex (just toggle Forex Mode)
- Customizable colors and labels for each range
**📈 Standard Deviation Levels**
- Shows key STDV levels from your ranges
- FLOUT: -6 to +6 from midpoint
- CBDR/ASIA: 0 to 7 from range low
- Helps identify expansion targets and reversal zones
**🎯 Highlight Zones**
- Zone 1 (default 3.5-4.0 STDV): Common reversal area
- Zone 2 (default 5.5-6.0 STDV): Extended targets
- Shaded boxes make them easy to spot
- Automatically extends forward into London session
**📐 Smart Trendlines**
- Connects the open prices at key times
- Switches to X-pattern on trending FLOUT days
- Helps identify directional bias
## Quick Setup
1. Add indicator to your 1-5 minute chart
2. Toggle **Forex Mode** if trading forex (otherwise leave off for indices)
3. Turn on STDV lines for the ranges you want to see
4. Adjust highlight zones if needed (defaults work great)
## Why Use This?
- **Save Time**: No more manual drawing of ranges and levels
- **Stay Consistent**: Same levels calculated every session
- **Better Entries**: Use STDV zones for high-probability setups
- **Cleaner Charts**: Toggle what you need, hide what you don't
## Pro Tips
💡 Watch for reactions at 3.5-4.0 STDV zones - these are prime reversal areas
💡 Combine multiple ranges for allignements setups
---
*All times in New York timezone. Best used on 1-5 minute charts.*

Dynamic Gann Square Pro - [Magic_xD]Premium Gann Analysis System for Professional Traders
Dynamic Gann Square Pro is an advanced technical analysis tool that combines classical Gann theory with modern geometric analysis to identify high-probability support/resistance zones, time cycles, and market turning points.
🎯 What This Indicator Does
This indicator provides a comprehensive suite of Gann-based analytical tools designed to help traders identify:
Dynamic Support & Resistance Levels: Automatically calculated key price zones based on market structure
Gann Square of 9 Calculations: Multiple calculation methods including Range, Daily, Weekly, and Monthly timeframes
Advanced Time Cycle Analysis: Gann cycles, Fibonacci time projections, and Square Root cycles for anticipating market turns
Geometric Pattern Recognition: Gann Stars with customizable shapes (Square, Triangle, Pentagon, Hexagon, Octagon, and more)
Price Action Zones: Color-coded zones highlighting critical decision points
Whale Detection System: Volume-weighted analysis to identify institutional activity
Multi-Timeframe Dashboard: Real-time technical rating system combining 10+ indicators (RSI, MACD, Stochastic, ADX, Bollinger Bands, and more)
📊 Key Features
Flexible Calculation Modes:
Select Candle Mode: Click directly on your chart to select your reference point
Lookback Mode: Define custom lookback periods (1-5000 bars)
Auto-Timeframe Detection: Automatically adjusts to Daily, Weekly, or Monthly ranges
Advanced Gann Tools:
Configurable Gann Square spacing with 17 precision levels (from 0.00000001 to 100000000)
Cycle multipliers (1-10 cycles) representing 360° to 3600° rotations
14 geometric shapes for market division analysis
Infinite Squares projection system for extended future projections
Time Cycle Systems:
Classical Gann Time Cycles with automatic repetition
Extended Fibonacci Time Ratios (0.382, 0.618, 1.618, 2.618, 3.618, up to 21.0)
W.D. Gann Square Root Method for geometric time expansion
Time grid subdivisions with customizable styles
Visual Clarity:
Multiple color themes (Dark Blue, Dark Gray, Black, Dark Green, Dark Purple)
Adjustable line styles (Solid, Dashed, Dotted) for all elements
Customizable labels with offset controls
Zone highlighting with transparency controls
Clean, professional chart presentation
🔮 Who Should Use This
This indicator is designed for:
Experienced traders familiar with Gann analysis methodology
Swing traders looking for high-probability reversal zones
Position traders using geometric and time-based analysis
Technical analysts who incorporate classical market theory
Gold & Forex traders (optimized for XAUUSD, BTCUSD, and major pairs)
⚙️ How to Use
Select Your Mode: Choose between "Select Candle" (click a pivot) or "Lookback" (automatic detection)
Configure Calculation Method: Pick your preferred Gann Square method (Range, Sqr9, Daily, Weekly, Monthly)
Adjust Cycles & Shape: Set the number of cycles and geometric division pattern
Enable Desired Features: Toggle Gann levels, Stars, Time Cycles, Trendlines, and Dashboard as needed
Customize Visual Style: Match your chart theme and preferences
The indicator automatically updates as new price data arrives, continuously calculating fresh support/resistance zones and time projections.
📈 What Makes This Different
Unlike simple support/resistance indicators, Dynamic Gann Square Pro implements authentic W.D. Gann methodology including:
True Square of 9 spiral calculations
Geometric price-time relationships
Natural angle divisions based on sacred geometry
Volume-weighted institutional detection
Multi-indicator consensus analysis
The system combines price analysis with time analysis, recognizing that Gann theory emphasizes both dimensions equally for accurate market forecasting.
⚠️ Important Notes
This is a technical analysis tool and should be used alongside proper risk management
Best results achieved when combined with your existing trading strategy
The indicator works on all timeframes but is optimized for H1, H4, and Daily charts
Customization is key: Spend time adjusting settings to match your trading instrument and style
The dashboard provides a technical rating but is not financial advice
🎓 Educational Foundation
This indicator is built on the teachings of W.D. Gann, one of the most legendary traders of the 20th century, incorporating:
Square of 9 theory
Natural geometric divisions (360° cycles)
Price-time equivalence principles
Support/resistance zone analysis.
Coded by Magic_xD - Ahmed Ramzey
Professional Algorithmic Trading System Developer
All copyrights reserved. This indicator represents years of research into Gann theory combined with modern programming techniques.
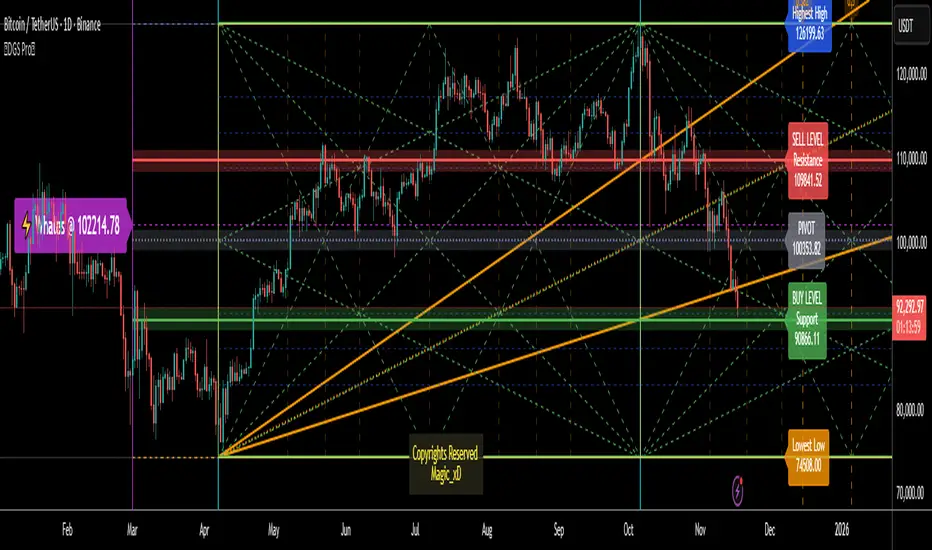
Supply & Demand ZonesThis indicator detects high-probability supply and demand zones using a multi-step smart money concept approach:
Liquidity Sweep Detection: Identifies when price sweeps above a pivot high (supply setup) or below a pivot low (demand setup), capturing liquidity grabs by institutional traders.
Displacement Confirmation: Requires a strong displacement candle (measured by ATR and body percentage) or fair value gap (FVG/imbalance) in the opposite direction after the sweep.
Volume Confirmation: Optional filter ensures zones form only when volume exceeds the user-defined threshold, indicating institutional participation.
Smart Filtering: Built-in logic prevents overlapping zones, enforces minimum spacing between signals, and requires confirmation bars to eliminate false signals.
Zone Lifecycle Management: Zones are automatically removed when price closes through them with momentum. Breached zones can optionally "flip" to the opposite type when re-tested with strong displacement.
✨ Key Features
Clean Visual Display: Small "D" (Demand) and "S" (Supply) labels with shaded zone boxes
Non-Repainting: All signals use confirmed historical data—no lookahead or repainting
Volume Filter: Optional confirmation using volume spike detection
Zone Flip Logic: Breached demand zones can become supply (and vice versa) when violated
Overlap Prevention: Smart algorithm prevents clustered or duplicate zones
Confirmation Delay: Configurable wait period after sweep to confirm genuine setups
Customizable Inputs: Adjust pivot sensitivity, displacement thresholds, volume filters, and more
Alert Ready: Built-in alert conditions for new supply and demand zone formations
🎯 How to Add to Your Chart
Favorite the Indicator: Click the star icon to add this script to your favorites
Open Your Chart: Navigate to the asset and timeframe you want to trade (works best on 5m-1H intraday charts)
Add Indicator: Click "Indicators" at the top, search for "Supply & Demand Zones (Smart Filtered)", and add to chart
Customize Settings: Click the gear icon ⚙️ to adjust inputs based on your trading style and instrument volatility
Set Alerts: Right-click the indicator name → "Add alert" → Select "Supply Zone" or "Demand Zone" conditions
📖 How to Use
Demand Zones (Green "D" Labels):
Price swept below a swing low (liquidity grab)
Strong bullish displacement or imbalance followed
Trading Action: Look for LONG entries when price returns to the zone or on immediate continuation
Stop Loss: Place just below the zone or sweep low
Target: Next resistance level, supply zone, or risk-reward ratio target
Supply Zones (Red "S" Labels):
Price swept above a swing high (liquidity grab)
Strong bearish displacement or imbalance followed
Trading Action: Look for SHORT entries when price returns to the zone or on immediate continuation
Stop Loss: Place just above the zone or sweep high
Target: Next support level, demand zone, or risk-reward ratio target
Flipped Zones (Orange Labels):
Previous demand/supply zone was broken with strong momentum
Zone has flipped polarity and may now act as the opposite type
Trading Action: Exercise caution—wait for additional confirmation before trading flipped zones
🔍 What to Look For
High-Quality Setups:
Zone forms with above-average volume (check volume filter is enabled)
Clear liquidity sweep visible on the chart
Strong displacement candle with large body percentage
Zone aligns with overall market trend or key structure levels
Multiple timeframe confirmation (check higher timeframe for context)
Avoid These Setups:
Zones forming in choppy, low-volume conditions
Multiple overlapping zones in the same area (indicator filters these automatically)
Zones that appear immediately after news events (set confirmation bars higher)
Counter-trend zones without additional confluence
⚙️ Recommended Settings by Timeframe
5-Minute Charts (Scalping):
Pivot Lookback: 3/3
Min Displacement ATR: 0.9
Confirmation Bars: 1
Min Zone Spacing: 3-5 bars
Volume Threshold: 1.2x
15-Minute Charts (Intraday):
Pivot Lookback: 4/4 (default)
Min Displacement ATR: 1.0 (default)
Confirmation Bars: 2 (default)
Min Zone Spacing: 5-8 bars
Volume Threshold: 1.2x
1-Hour Charts (Swing Trading):
Pivot Lookback: 5/5
Min Displacement ATR: 1.2-1.5
Confirmation Bars: 3
Min Zone Spacing: 8-12 bars
Volume Threshold: 1.3x
💡 Trading Tips & Best Practices
Combine with Price Action: Use this indicator alongside candlestick patterns, support/resistance, and trendlines for confirmation
Multiple Timeframe Analysis: Check higher timeframes for overall bias and major zones
Volume is Key: Enable volume filter to focus on institutional-backed moves
Risk Management: Always use stop losses and proper position sizing
Backtesting: Test settings on your preferred instruments and timeframes before live trading
Context Matters: Consider market conditions, news events, and session times
Wait for Confirmation: Don't rush entries—wait for price reaction at the zone
⚠️ Important Disclaimers
Educational Purpose Only: This indicator is provided for educational and informational purposes. It does not constitute financial advice, investment recommendations, or trading signals.
No Guarantees: Past performance and backtested results do not guarantee future results. Trading involves substantial risk of loss.

Slope Rank ReversalThis tool is designed to solve the fundamental problem of "buying low and selling high" by providing objective entry/exit signals based on momentum extremes and inflection points.
The System employs three core components:
Trend Detection (PSAR): The Parabolic SAR is used as a filter to confirm that a trend reversal or transition is currently underway, isolating actionable trade setups.
Dynamic Momentum Ranking: The indicator continuously measures the slope of the price action. This slope is then ranked against historical data to objectively identify when an asset is in an extreme state (overbought or oversold).
Signal Generation (Inflection Points):
Oversold/Buy: A 🟢 Green X is generated only when the slope ranking indicates the market is steeply negative (oversold), and the slope value begins to tick upwards (the inflection point), signaling potential mean reversion.
Overbought/Sell: A 🔴 Red X is generated only when the slope ranking indicates the market is steeply positive (overbought), and the slope value begins to tick downwards, signaling momentum exhaustion.
The core philosophy is simple: Enter only when the market is exhausted and has started to turn.

ORB Pro SuiteOverview
ORB Pro with Filters + Debug Overlay is an advanced Opening Range Breakout indicator designed for precision intraday trading. It defines a configurable ORB window, automatically builds the breakout range, and triggers long or short signals only when all active filters align. The script also includes a built-in debug overlay that explains why each breakout is accepted or blocked, allowing traders to fine-tune entries with transparency.
What Makes It Unique
• Modular filter stack – close-confirmation vs. instant breaks, retest confirmation with adjustable tolerance %, volume-spike and EMA-trend filters, ORB-size range, session cutoff, and cooldown logic.
• Non-blocking debug overlay – inline or corner display of the exact rejection reason (“Too late,” “Low volume,” “Trend mismatch,” etc.).
• Fully customizable visuals – choose shaded, outline, or line-only ORB styles; set opacity, border color, and right-edge offset so the box never hides current candles.
• Integrated reversal engine – detects doji, hammer, and engulfing structures within a time-filtered window and optional VWAP/EMA confluence.
How It Works
During the defined opening window (default 9:30 – 9:45 NY), the indicator records the session high and low.
After the box closes, it looks for breakouts confirmed by candle close or retest (per user settings).
Each signal passes through range, volume, trend, time-delay, and session filters before printing.
Visual stop-loss / take-profit levels appear for reference using either R:R multiples or fixed %.
The optional reversal layer marks short-term exhaustion zones for counter-scalp setups.
Usage Guidelines
• Apply to standard candlestick charts (not Heikin Ashi, Renko, or Range).
• Select your local ORB start / end time, then enable or disable filters based on your playbook.
• Use the “Outline only” or “Corner table” debug modes for a cleaner chart.
• The script provides visual and alert-based confirmations only; it does not execute orders or backtest performance.
Inputs at a Glance
– ORB window (start/end time)
– Close-confirm toggle
– Retest tolerance %
– Volume SMA length
– EMA length for trend filter
– Min/Max range % filter
– Cooldown bars and session cutoff
– Visual R:R ratio or fixed SL/TP %
– Box style, opacity, border width / color
– Debug overlay mode (inline or table) and leader lines
Notes & Disclaimers
• This script is for analysis and educational purposes only. It does not constitute financial advice or guarantee performance.
• Signals are calculated on completed bars without lookahead.
• Invite-only access ensures version integrity and controlled distribution.
© Trades with B – Original development in Pine v6. Reuse of this code requires explicit permission from the author.
