Adaptive Momentum Reversion StrategyThe Adaptive Momentum Reversion Strategy: An Empirical Approach to Market Behavior
The Adaptive Momentum Reversion Strategy seeks to capitalize on market price dynamics by combining concepts from momentum and mean reversion theories. This hybrid approach leverages a Rate of Change (ROC) indicator along with Bollinger Bands to identify overbought and oversold conditions, triggering trades based on the crossing of specific thresholds. The strategy aims to detect momentum shifts and exploit price reversions to their mean.
Theoretical Framework
Momentum and Mean Reversion: Momentum trading assumes that assets with a recent history of strong performance will continue in that direction, while mean reversion suggests that assets tend to return to their historical average over time (Fama & French, 1988; Poterba & Summers, 1988). This strategy incorporates elements of both, looking for periods when momentum is either overextended (and likely to revert) or when the asset’s price is temporarily underpriced relative to its historical trend.
Rate of Change (ROC): The ROC is a straightforward momentum indicator that measures the percentage change in price over a specified period (Wilder, 1978). The strategy calculates the ROC over a 2-period window, making it responsive to short-term price changes. By using ROC, the strategy aims to detect price acceleration and deceleration.
Bollinger Bands: Bollinger Bands are used to identify volatility and potential price extremes, often signaling overbought or oversold conditions. The bands consist of a moving average and two standard deviation bounds that adjust dynamically with price volatility (Bollinger, 2002).
The strategy employs two sets of Bollinger Bands: one for short-term volatility (lower band) and another for longer-term trends (upper band), with different lengths and standard deviation multipliers.
Strategy Construction
Indicator Inputs:
ROC Period: The rate of change is computed over a 2-period window, which provides sensitivity to short-term price fluctuations.
Bollinger Bands:
Lower Band: Calculated with a 18-period length and a standard deviation of 1.7.
Upper Band: Calculated with a 21-period length and a standard deviation of 2.1.
Calculations:
ROC Calculation: The ROC is computed by comparing the current close price to the close price from rocPeriod days ago, expressing it as a percentage.
Bollinger Bands: The strategy calculates both upper and lower Bollinger Bands around the ROC, using a simple moving average as the central basis. The lower Bollinger Band is used as a reference for identifying potential long entry points when the ROC crosses above it, while the upper Bollinger Band serves as a reference for exits, when the ROC crosses below it.
Trading Conditions:
Long Entry: A long position is initiated when the ROC crosses above the lower Bollinger Band, signaling a potential shift from a period of low momentum to an increase in price movement.
Exit Condition: A position is closed when the ROC crosses under the upper Bollinger Band, or when the ROC drops below the lower band again, indicating a reversal or weakening of momentum.
Visual Indicators:
ROC Plot: The ROC is plotted as a line to visualize the momentum direction.
Bollinger Bands: The upper and lower bands, along with their basis (simple moving averages), are plotted to delineate the expected range for the ROC.
Background Color: To enhance decision-making, the strategy colors the background when extreme conditions are detected—green for oversold (ROC below the lower band) and red for overbought (ROC above the upper band), indicating potential reversal zones.
Strategy Performance Considerations
The use of Bollinger Bands in this strategy provides an adaptive framework that adjusts to changing market volatility. When volatility increases, the bands widen, allowing for larger price movements, while during quieter periods, the bands contract, reducing trade signals. This adaptiveness is critical in maintaining strategy effectiveness across different market conditions.
The strategy’s pyramiding setting is disabled (pyramiding=0), ensuring that only one position is taken at a time, which is a conservative risk management approach. Additionally, the strategy includes transaction costs and slippage parameters to account for real-world trading conditions.
Empirical Evidence and Relevance
The combination of momentum and mean reversion has been widely studied and shown to provide profitable opportunities under certain market conditions. Studies such as Jegadeesh and Titman (1993) confirm that momentum strategies tend to work well in trending markets, while mean reversion strategies have been effective during periods of high volatility or after sharp price movements (De Bondt & Thaler, 1985). By integrating both strategies into one system, the Adaptive Momentum Reversion Strategy may be able to capitalize on both trending and reverting market behavior.
Furthermore, research by Chan (1996) on momentum-based trading systems demonstrates that adaptive strategies, which adjust to changes in market volatility, often outperform static strategies, providing a compelling rationale for the use of Bollinger Bands in this context.
Conclusion
The Adaptive Momentum Reversion Strategy provides a robust framework for trading based on the dual concepts of momentum and mean reversion. By using ROC in combination with Bollinger Bands, the strategy is capable of identifying overbought and oversold conditions while adapting to changing market conditions. The use of adaptive indicators ensures that the strategy remains flexible and can perform across different market environments, potentially offering a competitive edge for traders who seek to balance risk and reward in their trading approaches.
References
Bollinger, J. (2002). Bollinger on Bollinger Bands. McGraw-Hill Professional.
Chan, L. K. C. (1996). Momentum, Mean Reversion, and the Cross-Section of Stock Returns. Journal of Finance, 51(5), 1681-1713.
De Bondt, W. F., & Thaler, R. H. (1985). Does the Stock Market Overreact? Journal of Finance, 40(3), 793-805.
Fama, E. F., & French, K. R. (1988). Permanent and Temporary Components of Stock Prices. Journal of Political Economy, 96(2), 246-273.
Jegadeesh, N., & Titman, S. (1993). Returns to Buying Winners and Selling Losers: Implications for Stock Market Efficiency. Journal of Finance, 48(1), 65-91.
Poterba, J. M., & Summers, L. H. (1988). Mean Reversion in Stock Prices: Evidence and Implications. Journal of Financial Economics, 22(1), 27-59.
Wilder, J. W. (1978). New Concepts in Technical Trading Systems. Trend Research.
ابحث في النصوص البرمجية عن "信达股份40周年"

SCE ReversalsThis tool uses past market data to attempt to identify where changes in “memory” may occur to spot reversals. The Hurst Exponent was a big inspiration for this code. The main driver is identifying when past ranges expand and contract, leading to a change in direction. With the use of Sum of Squared Errors, users do not need to input anything.
Getting optimized parameters
// Define ranges for N and lkb
N_range = array.from(15, 20, 25, 30, 35, 40, 45, 50, 55, 60)
// Function to calculate SSE
sse_calc(_N) =>
x = math.pow(close - close , 2)
y = math.pow(close - close , 2) + math.pow(close, 2)
z = x / y
scaled_z = z * math.log(_N)
min_r = ta.lowest(scaled_z, _N)
max_r = ta.highest(scaled_z, _N)
norm_r = (scaled_z - min_r) / (max_r - min_r)
SMA = ta.sma(close, _N)
reversal_bullish = norm_r == 1.000 and norm_r < 0.90 and close < SMA and session.ismarket and barstate.isconfirmed
reversal_bearish = norm_r == 1.000 and norm_r < 0.90 and close > SMA and session.ismarket and barstate.isconfirmed
var float error = na
if reversal_bullish or reversal_bearish
error := math.pow(close - SMA, 2)
error
else
error := 999999999999999999999999999999999999999
error
error
var int N_opt = na
var float min_SSE = na
// Loop through ranges and calculate SSE
for N in N_range
sse = sse_calc(N)
if na(min_SSE) or sse < min_SSE
min_SSE := sse
N_opt := N
The N_range list encompasses every lookback value to check with. The sse_calc function accepts an individual element to then perform the calculation for Reversals. If there is a reversal, the error becomes how far away the close is from a moving average with that look back. Lowest error wins. That would be the look back used for the Reversals calculation.
Reversals calculation
// Calculating with optimized parameters
x_opt = math.pow(close - close , 2)
y_opt = math.pow(close - close , 2) + math.pow(close, 2)
z_opt = x_opt / y_opt
scaled_z_opt = z_opt * math.log(N_opt)
min_r_opt = ta.lowest(scaled_z_opt, N_opt)
max_r_opt = ta.highest(scaled_z_opt, N_opt)
norm_r_opt = (scaled_z_opt - min_r_opt) / (max_r_opt - min_r_opt)
SMA_opt = ta.sma(close, N_opt)
reversal_bullish_opt = norm_r_opt == 1.000 and norm_r_opt < 0.90 and close < SMA_opt and close > high and close > open and session.ismarket and barstate.isconfirmed
reversal_bearish_opt = norm_r_opt == 1.000 and norm_r_opt < 0.90 and close > SMA_opt and close < low and close < open and session.ismarket and barstate.isconfirmed
X_opt and y_opt are the compared values to develop the system. Everything done afterwards is scaling and using it to spot the Reversals. X_opt is the current close, minus the close with the optimal N bars back, squared. Then y_opt is also that but plus the current close squared. Z_opt is then x_opt / y_opt. This gives us a pretty small number that will go up when we approach tops or bottoms. To make life a little easier I normalize the value between 0 and 1.
After I find the moving average with the optimal N, I can check if there is a Reversal. Reversals are there when the last value is at 1 and the current value drops below 0.90. This would tell us that “memory” was strong and is now changing. To determine direction and help with accuracy, if the close is above the moving average it is a bearish alert, and vice versa. As well as the close must be below the last low for a bearish Reversal, above the last high for a bullish Reversal. Also the close must be above the open for a bullish Reversal, and below for a bearish one.
Visual examples
This NASDAQ:TSLA chart shows how alerts may come around. The bullish and bearish labels are plotted on the chart along with a reference line to see price interact with.
The indicator has the potential to be inactive, like we see here on $OKLO. There is only one alert, and it marks the bottom nicely.
Stocks with strong trends like NYSE:NOW may be more susceptible to false alerts. Assets that are volatile and bounce around a lot may be better.
It works on intra day charts the same as on Daily or longer charts. We see here on NASDAQ:QQQ it spotted the bottom on this particular trading day.
This tool is meant to aid traders in making decisions, not to be followed blindly. No trading tool is 100% accurate and Sum of Squared Errors does not guarantee the most optimal value. I encourage feedback and constructive criticism.

AI InfinityAI Infinity – Multidimensional Market Analysis
Overview
The AI Infinity indicator combines multiple analysis tools into a single solution. Alongside dynamic candle coloring based on MACD and Stochastic signals, it features Alligator lines, several RSI lines (including glow effects), and optionally enabled EMAs (20/50, 100, and 200). Every module is individually configurable, allowing traders to tailor the indicator to their personal style and strategy.
Important Note (Disclaimer)
This indicator is provided for educational and informational purposes only.
It does not constitute financial or investment advice and offers no guarantee of profit.
Each trader is responsible for their own trading decisions.
Past performance does not guarantee future results.
Please review the settings thoroughly and adjust them to your personal risk profile; consider supplementary analyses or professional guidance where appropriate.
Functionality & Components
1. Candle Coloring (MACD & Stochastic)
Objective: Provide an immediate visual snapshot of the market’s condition.
Details:
MACD Signal: Used to identify bullish and bearish momentum.
Stochastic: Detects overbought and oversold zones.
Color Modes: Offers both a simple (two-color) mode and a gradient mode.
2. Alligator Lines
Objective: Assist with trend analysis and determining the market’s current phase.
Details:
Dynamic SMMA Lines (Jaw, Teeth, Lips) that adjust based on volatility and market conditions.
Multiple Lengths: Each element uses a separate smoothing period (13, 8, 5).
Transparency: You can show or hide each line independently.
3. RSI Lines & Glow Effects
Objective: Display the RSI values directly on the price chart so critical levels (e.g., 20, 50, 80) remain visible at a glance.
Details:
RSI Scaling: The RSI is plotted in the chart window, eliminating the need to switch panels.
Dynamic Transparency: A pulse effect indicates when the RSI is near critical thresholds.
Glow Mode: Choose between “Direct Glow” or “Dynamic Transparency” (based on ATR distance).
Custom RSI Length: Freely adjustable (default is 14).
4. Optional EMAs (20/50, 100, 200)
Objective: Utilize moving averages for trend assessment and identifying potential support/resistance areas.
Details:
20/50 EMA: Select which one to display via a dropdown menu.
100 EMA & 200 EMA: Independently enabled.
Color Logic: Automatically green (price > EMA) or red (price < EMA). Each EMA’s up/down color is customizable.
Configuration Options
Candle Coloring:
Choose between Gradient or Simple mode.
Adjust the color scheme for bullish/bearish candles.
Transparency is dynamically based on candle body size and Stochastic state.
Alligator Lines:
Toggle each line (Jaw/Teeth/Lips) on or off.
Select individual colors for each line.
RSI Section:
RSI Length can be set as desired.
RSI lines (0, 20, 50, 80, 100) with user-defined colors and transparency (pulse effect).
Additional lines (e.g., RSI 40/60) are also available.
Glow Effects:
Switch between “Dynamic Transparency” (ATR-based) and “Direct Glow”.
Independently applied to the RSI 100 and RSI 0 lines.
EMAs (20/50, 100, 200):
Activate each one as needed.
Each EMA’s up/down color can be customized.
Example Use Cases
Trend Identification:
Enable Alligator lines to gauge general trend direction through SMMA signals.
Timing:
Watch the Candle Colors to spot potential overbought or oversold conditions.
Fine-Tuning:
Utilize the RSI lines to closely monitor important thresholds (50 as a trend barometer, 80/20 as possible reversal zones).
Filtering:
Enable a 50 EMA to quickly see if the market is trading above (bullish) or below (bearish) it.

BBSS+This Pine Script implements a custom indicator overlaying Bollinger Bands with additional features for trend analysis using Exponential Moving Averages (EMAs). Here's a breakdown of its functionality:
Bollinger Bands:
The script calculates the Bollinger Bands using a 20-period Simple Moving Average (SMA) as the basis and a multiplier of 2 for the standard deviation.
It plots the Upper Band and Lower Band in red.
EMA Calculations:
Three EMAs are calculated for the close price with periods of 5, 10, and 40.
The EMAs are plotted in green (5-period), cyan (10-period), and orange (40-period) to distinguish between them.
Trend Detection:
The script determines bullish or bearish EMA alignments:
Bullish Order: EMA 5 > EMA 10 > EMA 40.
Bearish Order: EMA 5 < EMA 10 < EMA 40.
Entry Signals:
Long Entry: Triggered when:
The close price crosses above the Upper Bollinger Band.
The Upper Band is above its 5-period SMA (indicating momentum).
The EMAs are in a bullish order.
Short Entry: Triggered when:
The close price crosses below the Lower Bollinger Band.
The Lower Band is below its 5-period SMA.
The EMAs are in a bearish order.
Trend State Tracking:
A variable tracks whether the market is in a Long or Short trend based on conditions:
A Long trend continues unless conditions for a Short Entry are met or the Upper Band dips below its average.
A Short trend continues unless conditions for a Long Entry are met or the Lower Band rises above its average.
Visual Aids:
Signal Shapes:
Triangle-up shapes indicate Long Entry points below the bar.
Triangle-down shapes indicate Short Entry points above the bar.
Bar Colors:
Green bars indicate a Long trend.
Red bars indicate a Short trend.
This script combines Bollinger Bands with EMA crossovers to generate entry signals and visualize market trends, making it a versatile tool for identifying momentum and trend reversals.

RSI NarrativesDescription:
The RSI Narratives script aggregates Relative Strength Index (RSI) values across multiple cryptocurrency narratives or sectors, providing an easy-to-read visual and alert system for trend reversals and overbought/oversold conditions. This tool is designed for traders looking to track sector-specific trends and compare performance across AI, DeFi, Level 1 blockchains, and more.
Key Features:
RSI Aggregation by Sector: Calculates average RSI for key narratives, including AI, DeFi, Level 1 blockchains, new memes, and more.
Customizable RSI Settings: Adjust RSI period, line width, and label offsets for personalized analysis.
Dynamic Alerts: Receive alerts when a narrative enters overbought or oversold territory, helping you act quickly on market movements.
Clean Visualization: Overlay sector-specific SMA lines with distinct colors and optional labels for quick interpretation.
Multi-Narrative Comparison: Analyze trends across diverse narratives to identify emerging opportunities.
Parameters for Customization:
RSI Period: Set the lookback period for RSI calculations (default: 14).
Line Width: Adjust the thickness of plotted lines (default: 2).
Label Offset: Control label placement for better chart readability.
Overbought/Oversold Thresholds: Configure the RSI levels for alerts (default: 70/40).
How to Use:
Add the script to your TradingView chart.
Customize the RSI parameters to suit your trading strategy.
Monitor the plotted SMA lines to identify narrative-specific trends.
Set alerts for overbought and oversold conditions to stay informed in real time.
Alerts System:
Alerts trigger when a narrative crosses predefined overbought or oversold levels.
Text notifications suggest potential trading actions, such as selling on overbought or buying on oversold.
Intended Users:
This script is ideal for crypto traders, sector analysts, and market enthusiasts who want to track performance across narratives and gain actionable insights into sector rotations.
Disclaimer:
This script is for educational and informational purposes only. It does not constitute financial advice. Please test on historical data and practice caution when trading.
Nimu Market on DemandNimu Market On Demand is an innovative tool designed to provide a visual representation of market demand levels on a scale of 1 to 100. This scale is displayed at specific intervals , making it easy for users to understand market demand fluctuations in real time.
To enhance analysis, Nimu Market On Demand also incorporates the Relative Strength Index (RSI) with key thresholds at . RSI is a widely-used technical indicator that measures market strength and momentum, offering insights into overbought (excessive buying) or oversold (excessive selling) conditions.
The combination of the Demand graph and RSI enables users to:
Identify the right time to buy when the RSI falls below 30, signaling an oversold condition.
Determine the optimal time to sell when the RSI rises above 70, indicating an overbought condition.
With an integrated visualization, users can effortlessly observe demand patterns and combine them with RSI signals to make smarter and more strategic trading decisions. This tool is designed to help traders and investors maximize opportunities in a dynamic market environment.

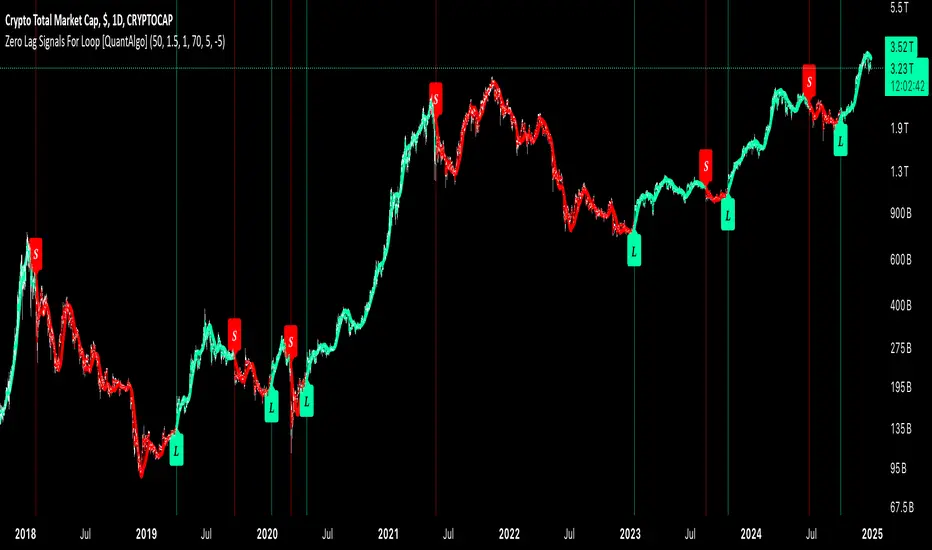
Zero Lag Signals For Loop [QuantAlgo]Elevate your trend-following investing and trading strategy with Zero Lag Signals For Loop by QuantAlgo , a simple yet effective technical indicator that merges advanced zero-lag mechanism with adaptive trend analysis to bring you a fresh take on market momentum tracking. Its aim is to support both medium- to long-term investors monitoring broader market shifts and precision-focused traders seeking quality entries through its dual-focused analysis approach!
🟢 Core Architecture
The foundation of this indicator rests on its zero-lag implementation and dynamic trend assessment. By utilizing a loop-driven scoring system alongside volatility-based filtering, each market movement is evaluated through multiple historical lenses while accounting for current market conditions. This multi-layered approach helps differentiate between genuine trend movements and market noise across timeframe and asset classes.
🟢 Technical Foundation
Three distinct components of this indicator are:
Zero Lag EMA : An enhanced moving average calculation designed to minimize traditional lag effects
For Loop Scoring System : A comprehensive scoring mechanism that weighs current price action against historical contexts
Dynamic Volatility Analysis : A sophisticated ATR-based filter that adjusts signal sensitivity to market conditions
🟢 Key Features & Signals
The Zero Lag Signals For Loop provides market insights through:
Color-coded Zero Lag line that adapts to trend direction
Dynamic fills between price and Zero Lag basis for enhanced visualization
Trend change markers (L/S) that highlight potential reversal points
Smart bar coloring that helps visualize market momentum
Background color changes with vertical lines at significant trend shifts
Customizable alerts for both bullish and bearish reversals
🟢 Practical Usage Tips
Here's how you can get the most out of the Zero Lag Signals For Loop :
1/ Setup:
Add the indicator to your TradingView chart by clicking on the star icon to add it to your favorites ⭐️
Start with the default Zero Lag length for balanced sensitivity
Use the standard volatility multiplier for proper filtering
Keep the default loop range for comprehensive trend analysis
Adjust threshold levels based on your investing and/or trading style
2/ Reading Signals:
Watch for L/S markers - they indicate validated trend reversals
Pay attention to Zero Lag line color changes - they confirm trend direction
Monitor bar colors for additional trend confirmation
Configure alerts for trend changes in both bullish and bearish directions, ensuring you can act on significant technical developments promptly.
🟢 Pro Tips
Fine-tune the Zero Lag length based on your timeframe:
→ Lower values (20-40) for more responsive signals
→ Higher values (60-100) for stronger trend confirmation
Adjust volatility multiplier based on market conditions:
→ Increase multiplier in volatile markets
→ Decrease multiplier in stable trending markets
Combine with:
→ Volume analysis for trade validation
→ Multiple timeframe analysis for broader context
→ Other technical tools for comprehensive analysis
Brijesh TTrades candle plot"Brijesh TTrades candle plot" is a powerful and customizable indicator that allows you to overlay higher timeframe candles directly on your chart. Choose your desired timeframe (e.g., Daily, Hourly) and plot up to 10 recent candles with precise control over color, wick style, and width. The candles are offset by 40 bars to the right, providing a clear and unobstructed view of the current price action. Ideal for multi-timeframe analysis and gaining deeper insights into market trends.

Merry ChristmasThis indicator creates a dynamic table of holiday greetings in 40 languages, taking advantage of Pine Script v6's new variable text size feature. The messages appear with randomized colors, sizes, and positions, refreshing with each bar update to create an ever-changing festive display. Includes traditional Christmas, Hanukkah, and New Year wishes across cultures. To fellow Pine developers who continue to push the boundaries of what's possible with Pine Script - thank you and happy holidays.

TASC 2025.01 Linear Predictive Filters█ OVERVIEW
This script implements a suite of tools for identifying and utilizing dominant cycles in time series data, as introduced by John Ehlers in the "Linear Predictive Filters And Instantaneous Frequency" article featured in the January 2025 edition of TASC's Traders' Tips . Dominant cycle information can help traders adapt their indicators and strategies to changing market conditions.
█ CONCEPTS
Conventional technical indicators and strategies often rely on static, unchanging parameters, which may fail to account for the dynamic nature of market data. In his article, John Ehlers applies digital signal processing principles to address this issue, introducing linear predictive filters to identify cyclic information for adapting indicators and strategies to evolving market conditions.
This approach treats market data as a complex series in the time domain. Analyzing the series in the frequency domain reveals information about its cyclic components. To reduce the impact of frequencies outside a range of interest and focus on a specific range of cycles, Ehlers applies second-order highpass and lowpass filters to the price data, which attenuate or remove wavelengths outside the desired range. This band-limited analysis isolates specific parts of the frequency spectrum for various trading styles, e.g., longer wavelengths for position trading or shorter wavelengths for swing trading.
After filtering the series to produce band-limited data, Ehlers applies a linear predictive filter to predict future values a few bars ahead. The filter, calculated based on the techniques proposed by Lloyd Griffiths, adaptively minimizes the error between the latest data point and prediction, successively adjusting its coefficients to align with the band-limited series. The filter's coefficients can then be applied to generate an adaptive estimate of the band-limited data's structure in the frequency domain and identify the dominant cycle.
█ USAGE
This script implements the following tools presented in the article:
Griffiths Predictor
This tool calculates a linear predictive filter to forecast future data points in band-limited price data. The crosses between the prediction and signal lines can provide potential trade signals.
Griffiths Spectrum
This tool calculates a partial frequency spectrum of the band-limited price data derived from the linear predictive filter's coefficients, displaying a color-coded representation of the frequency information in the pane. This mode's display represents the data as a periodogram . The bottom of each plotted bar corresponds to a specific analyzed period (inverse of frequency), and the bar's color represents the presence of that periodic cycle in the time series relative to the one with the highest presence (i.e., the dominant cycle). Warmer, brighter colors indicate a higher presence of the cycle in the series, whereas darker colors indicate a lower presence.
Griffiths Dominant Cycle
This tool compares the cyclic components within the partial spectrum and identifies the frequency with the highest power, i.e., the dominant cycle . Traders can use this dominant cycle information to tune other indicators and strategies, which may help promote better alignment with dynamic market conditions.
Notes on parameters
Bandpass boundaries:
In the article, Ehlers recommends an upper bound of 125 bars or higher to capture longer-term cycles for position trading. He recommends an upper bound of 40 bars and a lower bound of 18 bars for swing trading. If traders use smaller lower bounds, Ehlers advises a minimum of eight bars to minimize the potential effects of aliasing.
Data length:
The Griffiths predictor can use a relatively small data length, as autocorrelation diminishes rapidly with lag. However, for optimal spectrum and dominant cycle calculations, the length must match or exceed the upper bound of the bandpass filter. Ehlers recommends avoiding excessively long lengths to maintain responsiveness to shorter-term cycles.

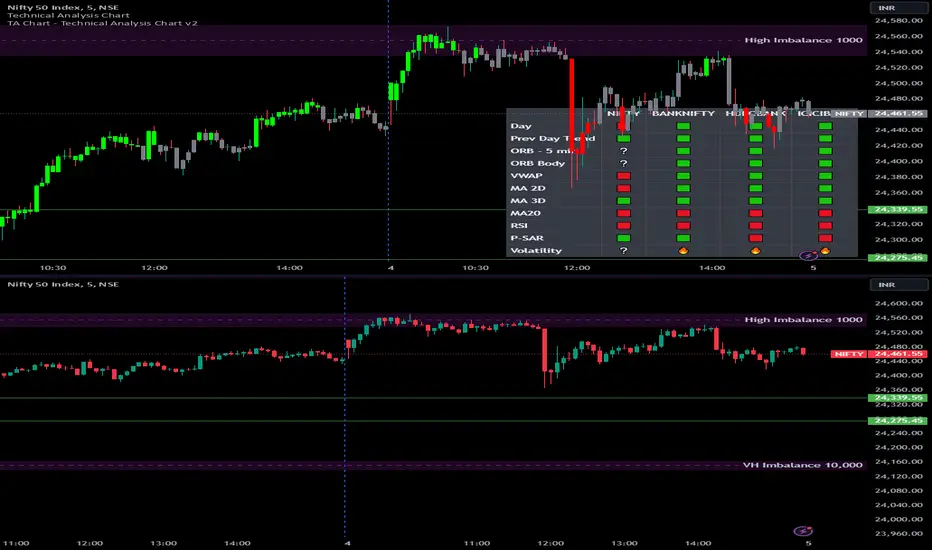
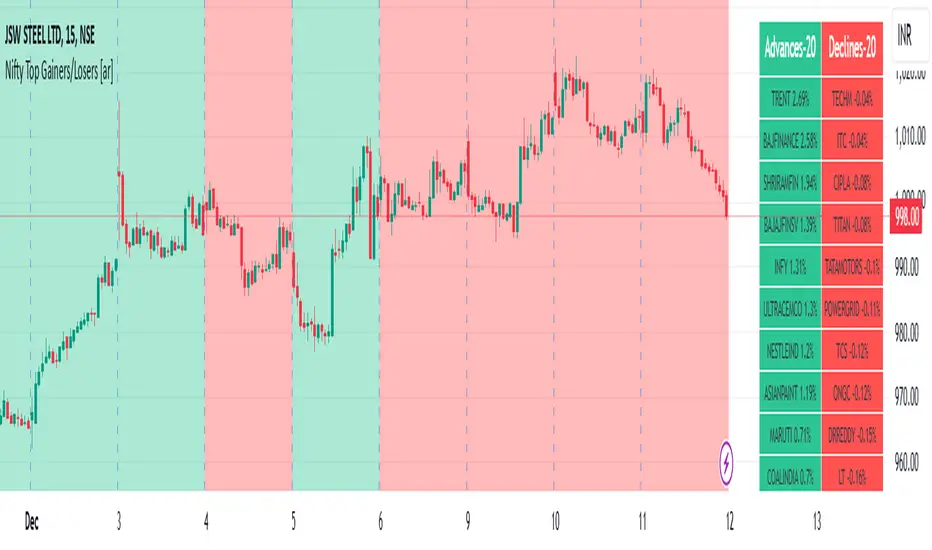
Nifty Top Gainers/Losers [ar]Nifty Top Gainers/Losers - Real-time Market Performance Tracker
A powerful indicator that monitors and displays real-time performance of 40 major Nifty stocks in a clean, organized table format. Perfect for traders seeking instant market breadth insights.
Key Features:
• Dynamic advances/declines counter at the top
• Real-time percentage change calculations
• Color-coded display (green for gainers, red for losers)
• Customizable reference points (Previous Day Close/Today's Open)
• Optional background color based on market breadth
• Flexible top gainers/losers limit setting
Customization Options:
- Adjust colors for gainers and losers
- Set transparency for background
- Modify the number of top performers to display
- Add/remove symbols from the watchlist
- Choose calculation reference (Previous Day Close/Today's Open)
Ideal for:
- Day traders monitoring market momentum
- Investors tracking sector rotation
- Analysts studying market breadth
- Portfolio managers seeking quick market overview
This indicator helps identify market leaders and laggards at a glance, making it an essential tool for informed trading decisions.
Alerts█ OVERVIEW
This library is a Pine Script™ programmers tool that provides functions to simplify the creation of compound conditions and alert messages. With these functions, scripts can use comma-separated "string" lists to specify condition groups from arbitrarily large "bool" arrays , offering a convenient way to provide highly flexible alert creation to script users without requiring numerous inputs in the "Settings/Inputs" menu.
█ CONCEPTS
Compound conditions
Compound conditions are essentially groups of two or more conditions, where each required condition must occur to produce a `true` result. Traders often combine conditions, including signals from various indicators, to drive and reinforce trade decisions. Similarly, programmers use compound conditions in logical operations to create scripts that respond dynamically to groups of events.
Condition conundrum
Providing flexible condition combinations to script users for signals and alerts often poses a significant challenge: input complexity . Conventionally, such flexibility comes at the cost of an extensive list of separate inputs for toggling individual conditions and customizing their properties, often resulting in complicated input menus that are difficult for users to navigate effectively. Furthermore, managing all those inputs usually entails tediously handling many extra variables and logical expressions, making such projects more complex for programmers.
Condensing complexity
This library introduces a technique using parsed strings to reference groups of elements from "bool" arrays , helping to simplify and streamline the construction of compound conditions and alert messages. With this approach, programmers can provide one or more "string" inputs in their scripts where users can list numbers corresponding to the conditions they want to combine.
For example, suppose you have a script that creates alert triggers based on a combination of up to 20 individual conditions, and you want to make inputs for users to choose which conditions to combine. Instead of creating 20 separate checkboxes in the "Settings/Inputs" tab and manually adding associated logic for each one, you can store the conditional values in arrays, make one or more "string" inputs that accept values listing the array item locations (e.g., "1,4,8,11"), and then pass the inputs to these functions to determine the compound conditions formed by the specified groups.
This approach condenses the input space, improving navigability and utility. Additionally, it helps provide high-level simplicity to complex conditional code, making it easier to maintain and expand over time.
█ CALCULATIONS AND USE
This library contains three functions for evaluating compound conditions: `getCompoundConditon()`, `getCompoundConditionsArray()`, and `compoundAlertMessage()`. Each function has two overloads that evaluate compound conditions based on groups of items from one or two "bool" arrays . The sections below explain the functions' calculations and how to use them.
Referencing conditions using "string" index lists
Each function processes "string" values containing comma-separated lists of numerals representing the indices of the "bool" array items to use in its calculations (e.g., "4, 8, 12"). The functions split each supplied "string" list by its commas, then iterate over those specified indices in the "bool" arrays to determine each group's combined `true` or `false` state.
For convenience, the numbers in the "string" lists can represent zero-based indices (where the first item is at index 0) or one-based indices (where the first item is at index 1), depending on the function's `zeroIndex` parameter. For example, an index list of "0, 2, 4" with a `zeroIndex` value of `true` specifies that the condition group uses the first , third , and fifth "bool" values in the array, ignoring all others. If the `zeroIndex` value is `false`, the list "1, 3, 5" also refers to those same elements.
Zero-based indexing is convenient for programmers because Pine arrays always use this index format. However, one-based indexing is often more convenient and familiar for script users, especially non-programmers.
Evaluating one or many condition groups
The `getCompoundCondition()` function evaluates singular condition groups determined by its `indexList` parameter, returning `true` values whenever the specified array elements are `true`. This function is helpful when a script has to evaluate specific groups of conditions and does not require many combinations.
In contrast, the `getCompoundConditionsArray()` function can evaluate numerous condition groups, one for each "string" included in its `indexLists` argument. It returns arrays containing `true` or `false` states for each listed group. This function is helpful when a script requires multiple condition combinations in additional calculations or logic.
The `compoundAlertMessage()` function is similar to the `getCompoundConditionsArray()` function. It also evaluates a separate compound condition group for each "string" in its `indexLists` array, but it returns "string" values containing the marker (name) of each group with a `true` result. You can use these returned values as the `message` argument in alert() calls, display them in labels and other drawing objects, or even use them in additional calculations and logic.
Directional condition pairs
The first overload of each function operates on a single `conditions` array, returning values representing one or more compound conditions from groups in that array. These functions are ideal for general-purpose condition groups that may or may not represent direction information.
The second overloads accept two arrays representing upward and downward conditions separately: `upConditions` and `downConditions`. These overloads evaluate opposing directional conditions in pairs (e.g., RSI is above/below a level) and return upward and downward condition information separately in a tuple .
When using the directional overloads, ensure the `upConditions` and `downConditions` arrays are the same size, with the intended condition pairs at the same indices . For instance, if you have a specific upward RSI condition's value at the first index in the `upConditions` array, include the opposing downward RSI condition's value at that same index in the `downConditions` array. If a condition can apply to both directions (e.g., rising volume), include its value at the same index in both arrays.
Group markers
To simplify the generation of informative alert messages, the `compoundAlertMessage()` function assigns "string" markers to each condition group, where "marker" refers to the group's name. The `groupMarkers` parameter allows you to assign custom markers to each listed group. If not specified, the function generates default group markers in the format "M", where "M" is short for "Marker" and "" represents the group number starting from 1. For example, the default marker for the first group specified in the `indexLists` array is "M1".
The function's returned "string" values contain a comma-separated list with markers for each activated condition group (e.g., "M1, M4"). The function's second overload, which processes directional pairs of conditions, also appends extra characters to the markers to signify the direction. The default for upward groups is "▲" (e.g., "M1▲") and the default for downward ones is "▼" (e.g., "M1▼"). You can customize these appended characters with the `upChar` and `downChar` parameters.
Designing customizable alerts
We recommend following these primary steps when using this library to design flexible alerts for script users:
1. Create text inputs for users to specify comma-separated lists of conditions with the input.string() or input.text_area() functions, and then collect all the input values in a "string" array . Note that each separate "string" in the array will represent a distinct condition group.
2. Create arrays of "bool" values representing the possible conditions to choose from. If your script will process pairs of upward and downward conditions, ensure the related elements in the arrays align at the same indices.
3. Call `compoundAlertMessage()` using the arrays from steps 1 and 2 as arguments to get the alert message text. If your script will use the text for alerts only, not historical display or calculation purposes, the call is necessary only on realtime bars .
4. Pass the calculated "string" values as the `message` argument in alert() calls. We recommend calling the function only when the "string" is not empty (i.e., `messageText != ""`). To avoid repainting alerts on open bars, use barstate.isconfirmed in the condition to allow alert triggers only on each bar's close .
5. Test the alerts. Open the "Create Alert" dialog box and select "Any alert() function call" in the "Condition" field. It is also helpful to inspect the strings with Pine Logs .
NOTE: Because the techniques in this library use lists of numbers to specify conditions, we recommend including a tooltip for the "string" inputs that lists the available numbers and the conditions they represent. This tooltip provides a legend for script users, making it simple to understand and utilize. To create the tooltip, declare a "const string" listing the options and pass it to the `input.*()` call's `tooltip` parameter. See the library's example code for a simple demonstration.
█ EXAMPLE CODE
This library's example code demonstrates one possible way to offer a selection of compound conditions with "string" inputs and these functions. It uses three input.string() calls, each accepting a comma-separated list representing a distinct condition group. The title of each input represents the default group marker that appears in the label and alert text. The code collects these three input values in a `conditionGroups` array for use with the `compoundAlertMessage()` function.
In this code, we created two "bool" arrays to store six arbitrary condition pairs for demonstration:
1. Bar up/down: The bar's close price must be above the open price for upward conditions, and vice versa for downward conditions.
2. Fast EMA above/below slow EMA : The 9-period Exponential Moving Average of close prices must be above the 21-period EMA for upward conditions, and vice versa for downward conditions.
3. Volume above average : The bar's volume must exceed its 20-bar average to activate an upward or downward condition.
4. Volume rising : The volume must exceed that of the previous bar to activate an upward or downward condition.
5. RSI trending up/down : The 14-period Relative Strength Index of close prices must be between 50 and 70 for upward conditions, and between 30 and 50 for downward conditions.
6. High volatility : The 7-period Average True Range (ATR) must be above the 40-period ATR to activate an upward or downward condition.
We included a `tooltip` argument for the third input.string() call that displays the condition numbers and titles, where 1 is the first condition number.
The `bullConditions` array contains the `true` or `false` states of all individual upward conditions, and the `bearConditions` array contains all downward condition states. For the conditions that filter either direction because they are non-directional, such as "High volatility", both arrays contain the condition's `true` or `false` value at the same index. If you use these conditions alone, they activate upward and downward alert conditions simultaneously.
The example code calls `compoundAlertMessage()` using the `bullConditions`, `bearConditions`, and `conditionGroups` arrays to create a tuple of strings containing the directional markers for each activated group. On confirmed bars, it displays non-empty strings in labels and uses them in alert() calls. For the text shown in the labels, we used str.replace_all() to replace commas with newline characters, aligning the markers vertically in the display.
Look first. Then leap.
█ FUNCTIONS
This library exports the following functions:
getCompoundCondition(conditions, indexList, minRequired, zeroIndex)
(Overload 1 of 2) Determines a compound condition based on selected elements from a `conditions` array.
Parameters:
conditions (array) : (array) An array containing the possible "bool" values to use in the compound condition.
indexList (string) : (series string) A "string" containing a comma-separated list of whole numbers representing the group of `conditions` elements to use in the compound condition. For example, if the value is `"0, 2, 4"`, and `minRequired` is `na`, the function returns `true` only if the `conditions` elements at index 0, 2, and 4 are all `true`. If the value is an empty "string", the function returns `false`.
minRequired (int) : (series int) Optional. Determines the minimum number of selected conditions required to activate the compound condition. For example, if the value is 2, the function returns `true` if at least two of the specified `conditions` elements are `true`. If the value is `na`, the function returns `true` only if all specified elements are `true`. The default is `na`.
zeroIndex (bool) : (series bool) Optional. Specifies whether the `indexList` represents zero-based array indices. If `true`, a value of "0" in the list represents the first array index. If `false`, a `value` of "1" represents the first index. The default is `true`.
Returns: (bool) `true` if `conditions` elements in the group specified by the `indexList` are `true`, `false` otherwise.
getCompoundCondition(upConditions, downConditions, indexList, minRequired, allowUp, allowDown, zeroIndex)
(Overload 2 of 2) Determines upward and downward compound conditions based on selected elements from `upConditions` and `downConditions` arrays.
Parameters:
upConditions (array) : (array) An array containing the possible "bool" values to use in the upward compound condition.
downConditions (array) : (array) An array containing the possible "bool" values to use in the downward compound condition.
indexList (string) : (series string) A "string" containing a comma-separated list of whole numbers representing the `upConditions` and `downConditions` elements to use in the compound conditions. For example, if the value is `"0, 2, 4"` and `minRequired` is `na`, the function returns `true` for the first value only if the `upConditions` elements at index 0, 2, and 4 are all `true`. If the value is an empty "string", the function returns ` `.
minRequired (int) : (series int) Optional. Determines the minimum number of selected conditions required to activate either compound condition. For example, if the value is 2, the function returns `true` for its first value if at least two of the specified `upConditions` elements are `true`. If the value is `na`, the function returns `true` only if all specified elements are `true`. The default is `na`.
allowUp (bool) : (series bool) Optional. Controls whether the function considers upward compound conditions. If `false`, the function ignores the `upConditions` array, and the first item in the returned tuple is `false`. The default is `true`.
allowDown (bool) : (series bool) Optional. Controls whether the function considers downward compound conditions. If `false`, the function ignores the `downConditions` array, and the second item in the returned tuple is `false`. The default is `true`.
zeroIndex (bool) : (series bool) Optional. Specifies whether the `indexList` represents zero-based array indices. If `true`, a value of "0" in the list represents the first array index. If `false`, a value of "1" represents the first index. The default is `true`.
Returns: ( ) A tuple containing two "bool" values representing the upward and downward compound condition states, respectively.
getCompoundConditionsArray(conditions, indexLists, zeroIndex)
(Overload 1 of 2) Creates an array of "bool" values representing compound conditions formed by selected elements from a `conditions` array.
Parameters:
conditions (array) : (array) An array containing the possible "bool" values to use in each compound condition.
indexLists (array) : (array) An array of strings containing comma-separated lists of whole numbers representing the `conditions` elements to use in each compound condition. For example, if an item is `"0, 2, 4"`, the corresponding item in the returned array is `true` only if the `conditions` elements at index 0, 2, and 4 are all `true`. If an item is an empty "string", the item in the returned array is `false`.
zeroIndex (bool) : (series bool) Optional. Specifies whether the "string" lists in the `indexLists` represent zero-based array indices. If `true`, a value of "0" in a list represents the first array index. If `false`, a value of "1" represents the first index. The default is `true`.
Returns: (array) An array of "bool" values representing compound condition states for each condition group. An item in the array is `true` only if all the `conditions` elements specified by the corresponding `indexLists` item are `true`. Otherwise, the item is `false`.
getCompoundConditionsArray(upConditions, downConditions, indexLists, allowUp, allowDown, zeroIndex)
(Overload 2 of 2) Creates two arrays of "bool" values representing compound upward and
downward conditions formed by selected elements from `upConditions` and `downConditions` arrays.
Parameters:
upConditions (array) : (array) An array containing the possible "bool" values to use in each upward compound condition.
downConditions (array) : (array) An array containing the possible "bool" values to use in each downward compound condition.
indexLists (array) : (array) An array of strings containing comma-separated lists of whole numbers representing the `upConditions` and `downConditions` elements to use in each compound condition. For example, if an item is `"0, 2, 4"`, the corresponding item in the first returned array is `true` only if the `upConditions` elements at index 0, 2, and 4 are all `true`. If an item is an empty "string", the items in both returned arrays are `false`.
allowUp (bool) : (series bool) Optional. Controls whether the function considers upward compound conditions. If `false`, the function ignores the `upConditions` array, and all elements in the first returned array are `false`. The default is `true`.
allowDown (bool) : (series bool) Optional. Controls whether the function considers downward compound conditions. If `false`, the function ignores the `downConditions` array, and all elements in the second returned array are `false`. The default is `true`.
zeroIndex (bool) : (series bool) Optional. Specifies whether the "string" lists in the `indexLists` represent zero-based array indices. If `true`, a value of "0" in a list represents the first array index. If `false`, a value of "1" represents the first index. The default is `true`.
Returns: ( ) A tuple containing two "bool" arrays:
- The first array contains values representing upward compound condition states determined using the `upConditions`.
- The second array contains values representing downward compound condition states determined using the `downConditions`.
compoundAlertMessage(conditions, indexLists, zeroIndex, groupMarkers)
(Overload 1 of 2) Creates a "string" message containing a comma-separated list of markers representing active compound conditions formed by specified element groups from a `conditions` array.
Parameters:
conditions (array) : (array) An array containing the possible "bool" values to use in each compound condition.
indexLists (array) : (array) An array of strings containing comma-separated lists of whole numbers representing the `conditions` elements to use in each compound condition. For example, if an item is `"0, 2, 4"`, the corresponding marker for that item appears in the returned "string" only if the `conditions` elements at index 0, 2, and 4 are all `true`.
zeroIndex (bool) : (series bool) Optional. Specifies whether the "string" lists in the `indexLists` represent zero-based array indices. If `true`, a value of "0" in a list represents the first array index. If `false`, a value of "1" represents the first index. The default is `true`.
groupMarkers (array) : (array) Optional. If specified, sets the marker (name) for each condition group specified in the `indexLists` array. If `na`, the function uses the format `"M"` for each group, where "M" is short for "Marker" and `` represents the one-based index for the group (e.g., the marker for the first listed group is "M1"). The default is `na`.
Returns: (string) A "string" containing a list of markers corresponding to each active compound condition.
compoundAlertMessage(upConditions, downConditions, indexLists, allowUp, allowDown, zeroIndex, groupMarkers, upChar, downChar)
(Overload 2 of 2) Creates two "string" messages containing comma-separated lists of markers representing active upward and downward compound conditions formed by specified element groups from `upConditions` and `downConditions` arrays.
Parameters:
upConditions (array) An array containing the possible "bool" values to use in each upward compound condition.
downConditions (array) An array containing the possible "bool" values to use in each downward compound condition.
indexLists (array) An array of strings containing comma-separated lists of whole numbers representing the `upConditions` and `downConditions` element groups to use in each compound condition. For example, if an item is `"0, 2, 4"`, the corresponding group marker for that item appears in the first returned "string" only if the `upConditions` elements at index 0, 2, and 4 are all `true`.
allowUp (bool) Optional. Controls whether the function considers upward compound conditions. If `false`, the function ignores the `upConditions` array and returns an empty "string" for the first tuple element. The default is `true`.
allowDown (bool) Optional. Controls whether the function considers downward compound conditions. If `false`, the function ignores the `downConditions` array and returns an empty "string" for the second tuple element. The default is `true`.
zeroIndex (bool) Optional. Specifies whether the "string" lists in the `indexLists` represent zero-based array indices. If `true`, a value of "0" in a list represents the first array index. If `false`, a value of "1" represents the first index. The default is `true`.
groupMarkers (array) Optional. If specified, sets the name (marker) of each condition group specified in the `indexLists` array. If `na`, the function uses the format `"M"` for each group, where "M" is short for "Marker" and `` represents the one-based index for the group (e.g., the marker for the first listed group is "M1"). The default is `na`.
upChar (string) Optional. A "string" appended to all group markers for upward conditions to signify direction. The default is "▲".
downChar (string) Optional. A "string" appended to all group markers for downward conditions to signify direction. The default is "▼".
Returns: ( ): A tuple of "string" values containing lists of markers corresponding to active upward and downward compound conditions, respectively.

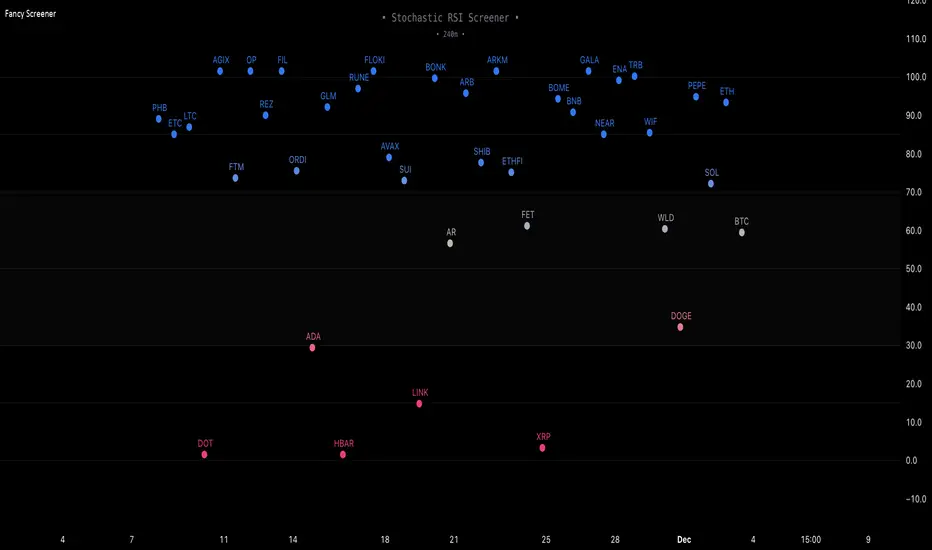
Fancy Oscillator Screener [Daveatt]⬛ OVERVIEW
Building upon LeviathanCapital original RSI Screener (), this enhanced version brings comprehensive technical analysis capabilities to your trading workflow. Through an intuitive grid display, you can monitor multiple trading instruments simultaneously while leveraging powerful indicators to identify market opportunities in real-time.
⬛ FEATURES
This script provides a sophisticated visualization system that supports both cross rates and heat map displays, allowing you to track exchange rates and percentage changes with ease. You can organize up to 40 trading pairs into seven customizable groups, making it simple to focus on specific market segments or trading strategies.
If you overlay on any circle/asset on the chart, you'll see the accurate oscillator value displayed for that asset
⬛ TECHNICAL INDICATORS
The screener supports the following oscillators:
• RSI - the oscillator from the original script version
• Awesome Oscillator
• Chaikin Oscillator
• Stochastic RSI
• Stochastic
• Volume Oscillator
• CCI
• Williams %R
• MFI
• ROC
• ATR Multiple
• ADX
• Fisher Transform
• Historical Volatility
• External : connect your own custom oscillator
⬛ DYNAMIC SCALING
One of the key improvements in this version is the implementation of dynamic chart scaling. Unlike the original script which was optimized for RSI's 0-100 range, this version automatically adjusts its scale based on the selected oscillator.
This adaptation was necessary because different indicators operate on vastly different numerical ranges - for instance, CCI typically ranges from -200 to +200, while Williams %R operates from -100 to 0.
The dynamic scaling ensures that each oscillator's data is properly displayed within its natural range, making the visualization both accurate and meaningful regardless of which indicator you choose to use.
⬛ ALERTS
I've integrated a comprehensive alert system that monitors both overbought and oversold conditions.
Users can now set custom threshold levels for their alerts.
When any asset in your monitored group crosses these thresholds, the system generates an alert, helping you catch potential trading opportunities without constant manual monitoring.
em will help you stay informed of market movements and potential trading opportunities.
I hope you'll find this tool valuable in your trading journey
All the BEST,
Daveatt
Futures Correlation VisualizerOVERVIEW
This indicator plots the normalized price changes of commonly traded futures. Visualizing data in this way makes studying and understanding market participation and sentiment easier.
Note:
Only 20 symbols can be plotted. The "request" functions are limited to 40 calls , 1 timeframe counts as a call, and 2 timeframes are used per symbol. Normalized values are derived by dividing the charts timeframe by 1D data. A runtime error will occur when more than 20 symbols are enabled. This limitation is unavoidable.
INPUTS
You can configure:
Colors and color scheme
Symbols to plot (most common futures)
Norm. source (todays open / yesterdays close)
Measurement type (%, ‱, Δ)
Label, zone, and zero options

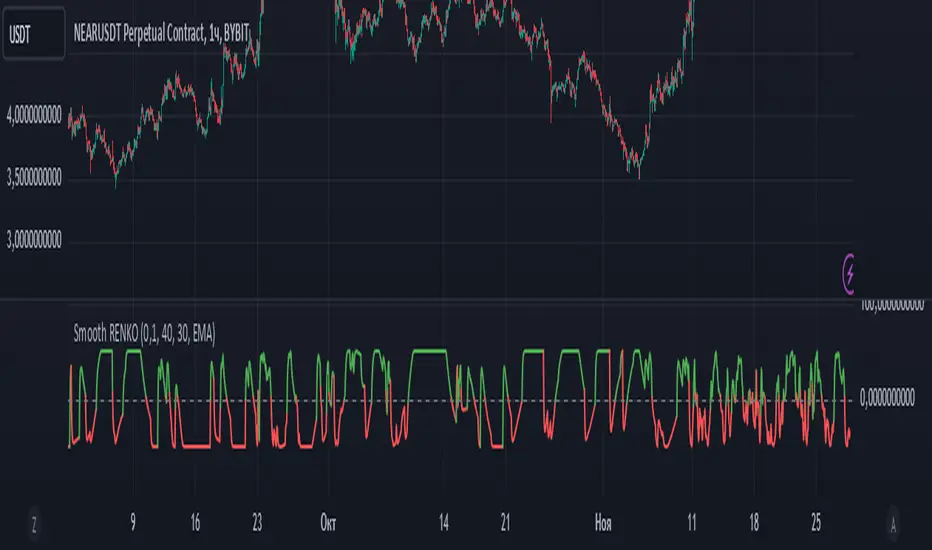
Smoothed Renko OscillatorSMOOTHED RENKO OSCILLATOR
Technical indicator combining Renko charting with oscillator mechanics for price momentum analysis. Brick size determines sensitivity of price movement detection, with adjustable smoothing for noise reduction.
Parameters include brick size (default 10), smoothing period (5), oscillator period (14), and smoothing type selection (EMA/SMA/WMA). Values above zero indicate bullish momentum, below zero bearish momentum, with ±40-50 marking potential reversal zones. Zero-line crossovers suggest trend changes.
Larger brick settings reduce noise but delay signals, while smaller bricks increase sensitivity. EMA smoothing provides faster response, while SMA/WMA offer more stable readings. The indicator supports trend confirmation, momentum measurement, divergence analysis, and entry/exit timing.
Best used in conjunction with price action and additional indicators for comprehensive market analysis. Particularly effective in trending markets for momentum confirmation and potential reversal identification.
Flag Screener [QuantVue]Flag Screener is a screening tool that identify bull and bear flags in up to 40 different symbols.
The indicator takes a comma separated list of symbols and then scans the symbols in real time to detect bull or bear flags.
What are flags
Flags are continuation patterns that occur within the general trend of the security. A bull flag represents a temporary pause or consolidation before price resumes it's upward movement, while a bear flag occurs before price continues its downward movement.
Both flag patterns consist of two components:
The Pole
The Flag
The pole is the initial strong upward surge or decline that precedes the flag. The pole is usually a fast move accompanied by heavy volume signaling significant buying or selling pressure.
The flag is then formed as price consolidates after the initial surge or decline from the pole. For a bull flag price will drift slightly downward to sideways, a bear flag will drift upward to sideways. The best flags often see volume dry up during this phase of the pattern.
Indicator Settings
Both components are fully customizable in the indicator so the user can adjust for any time frame or volatility. Select the minimum and maximum accepted limits from the % gain loss required for the pole, the maximum acceptable flag depth or rally and the minimum and maximum number of bars for each component.

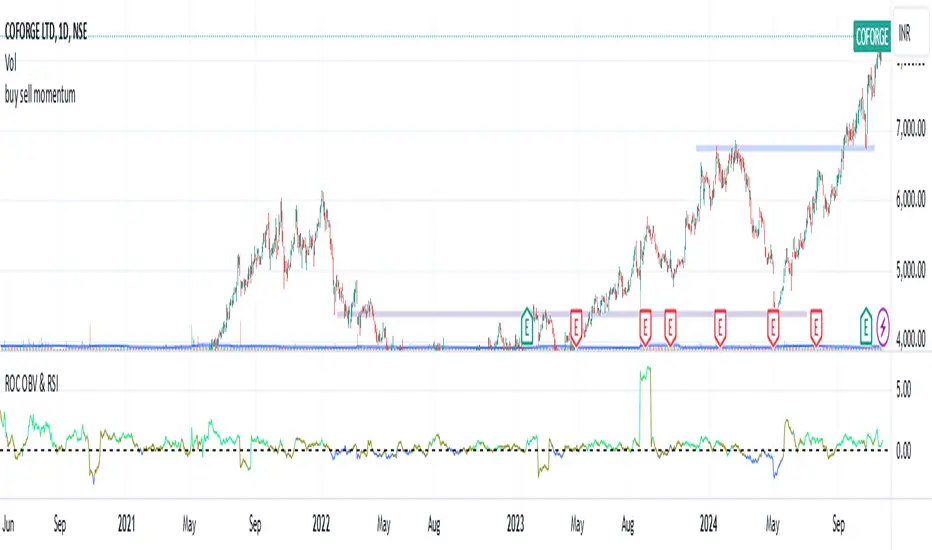
Rate of Change of OBV with RSI ColorThis indicator combines three popular tools in technical analysis : On-Balance Volume (OBV), Rate of Change (ROC), and Relative Strength Index (RSI). It aims to monitor momentum and potential trend reversals based on volume and price changes.
Calculation:
ROC(OBV) = ((OBV(today) - OBV(today - period)) / OBV(today - period)) * 100
This calculates the percentage change in OBV over a specific period. A positive ROC indicates an upward trend in volume, while a negative ROC suggests a downward trend.
What it Monitors:
OBV: Tracks the volume flow associated with price movements. Rising OBV suggests buying pressure, while falling OBV suggests selling pressure.
ROC of OBV:
Measures the rate of change in the OBV, indicating if the volume flow is accelerating or decelerating.
RSI: Measures the strength of recent price movements, indicating potential overbought or oversold conditions.
How it can be Used:
Identifying Trend Continuation: Rising ROC OBV with a rising RSI might suggest a continuation of an uptrend, especially if the color is lime (RSI above 60).
Identifying Trend Reversal: Falling ROC OBV with a declining RSI might suggest a potential trend reversal, especially if the color approaches blue (RSI below 40).
Confirmation with Threshold: The horizontal line (threshold) can be used as a support or resistance level. Bouncing ROC OBV off the threshold with a color change could suggest a pause in the trend but not necessarily a reversal.
When this Indicator is Useful:
This indicator can be useful for assets with strong volume activity, where tracking volume changes provides additional insights.
It might be helpful during periods of consolidation or trend continuation to identify potential breakouts or confirmations.
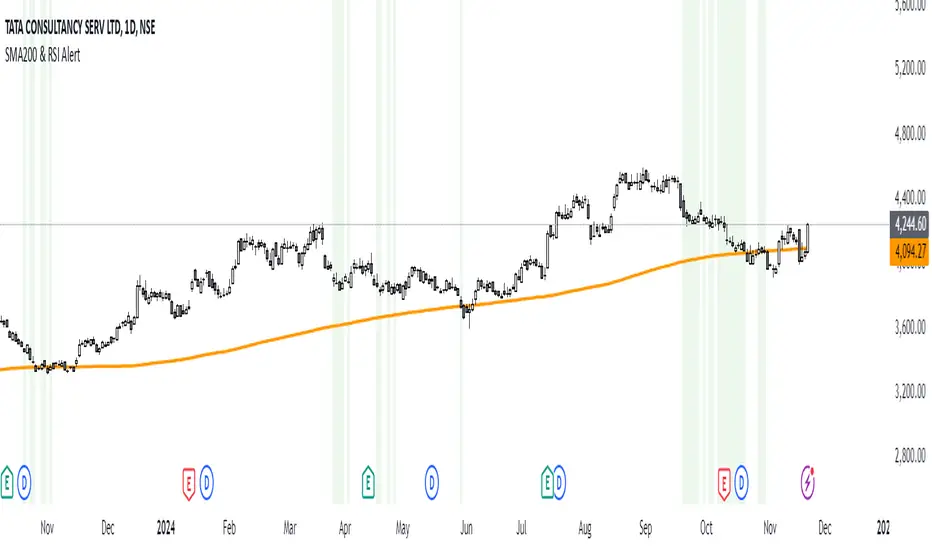
SMA200 & RSI [Tarun]The SMA200 & RSI Signal Indicator is a powerful tool designed for traders who want to identify potential entry zones based on a combination of price action and momentum. This indicator combines two essential trading components:
SMA200 (Simple Moving Average): A widely used trend-following tool that highlights the overall direction of the market.
RSI (Relative Strength Index): A momentum oscillator that measures the speed and change of price movements.
How It Works:
Price Above SMA200: Indicates bullish market conditions.
RSI Between 40 and 20: Suggests that the asset is in a potential oversold or pullback zone within a bullish trend.
When both conditions are met, the indicator triggers:
Background Highlight: The chart background turns green to indicate a potential signal zone.
Disclaimer:
This indicator is not a standalone trading strategy. Use it in conjunction with other analysis methods such as support and resistance, candlestick patterns, or volume analysis. Always practice proper risk management.
ICT Macro Sessions by @zeusbottradingICT Macro Sessions Indicator
The ICT Macro Sessions Indicator is a powerful tool designed for traders who follow the ICT (Inner Circle Trader) methodology and want to optimize their trading during specific high-probability time intervals. This indicator highlights all the key macro sessions throughout the trading day in the GMT+8 (Hong Kong) time zone.
What Does the Indicator Do?
This indicator visually marks ICT Macro Sessions on your trading chart using background colors and optional labels. Each session corresponds to specific time intervals when institutional activity is most likely to drive price action. By focusing on these periods, traders can align their strategies with market volatility and liquidity, increasing their chances of success.
Highlighted Sessions
The indicator covers all major ICT Macro Sessions, each with a unique color for easy identification:
London Macro 1 (15:33–16:00 GMT+8):
- Marks the early London session, often characterized by strong directional moves.
London Macro 2 (17:03–17:30 GMT+8):
- Captures the mid-London session, where price frequently reacts to liquidity levels.
New York AM Macro 1 (22:50–23:10 GMT+8):
- Highlights the start of the New York session, a prime time for price reversals or continuations.
New York AM Macro 2 (23:50–00:10 GMT+8):
- Focuses on late-morning New York activity, often aligning with key news releases.
New York Lunch Macro (00:50–01:10 GMT+8):
- Covers the lunch period in New York, where price may consolidate or set up for afternoon moves.
New York PM Macro 1 (02:10–02:40 GMT+8):
- Tracks post-lunch activity in New York, often featuring renewed volatility.
New York PM Macro 2 (04:15–04:45 GMT+8):
- Captures late-session moves as institutional traders finalize their positions.
Features of the Indicator
Fixed Time: The indicator is pre-configured for GMT+8 but it will adapt automatically to your timezone. No need to change anything in the code.
Background Highlighting: Each session is visually marked with a unique background color for quick recognition.
Optional Labels: Traders can enable or disable labels for each session, providing flexibility in how information is displayed.
Session Toggles: You can choose which sessions to display based on your trading preferences and strategy.
Intraday Timeframes: The indicator is optimized for intraday charts with timeframes of 45 minutes or less. You can change it to anything you like.
Why Use This Indicator?
The ICT Macro Sessions Indicator helps traders focus on the most critical times of the trading day when institutional activity is at its peak. These periods often coincide with significant price movements, making them ideal for scalping, day trading, or even swing trading setups. By visually highlighting these sessions, the indicator eliminates guesswork and allows traders to plan their trades with precision.

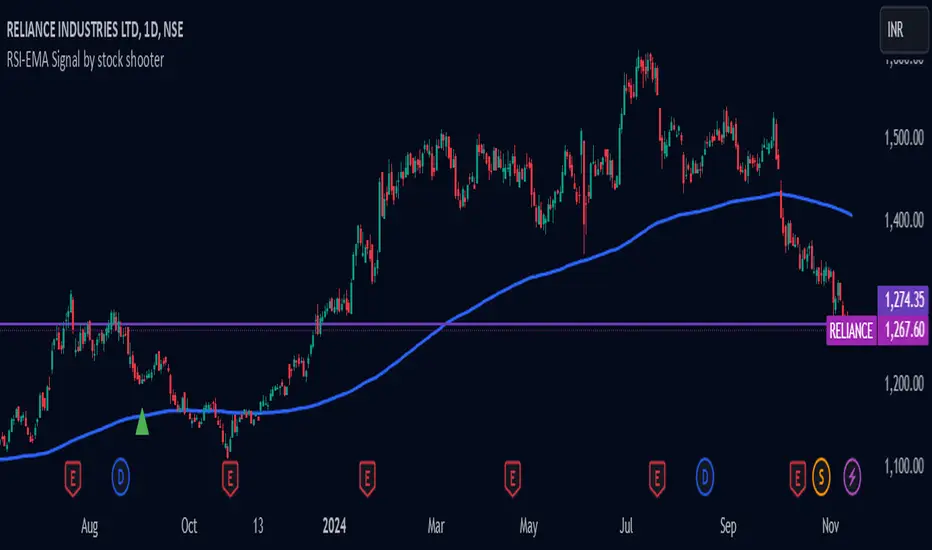
RSI-EMA Signal by stock shooter## Strategy Description: 200 EMA Crossover with RSI, Green/Red Candles, Volume, and Exit Conditions
This strategy combines several technical indicators to identify potential long and short entry opportunities in a trading instrument. Here's a breakdown of its components:
1. 200-period Exponential Moving Average (EMA):
* The 200-period EMA acts as a long-term trend indicator.
* The strategy looks for entries when the price is above (long) or below (short) the 200 EMA.
2. Relative Strength Index (RSI):
* The RSI measures the momentum of price movements and helps identify overbought and oversold conditions.
* The strategy looks for entries when the RSI is below 40 (oversold) for long positions and above 60 (overbought) for short positions.
3. Green/Red Candles:
* This indicator filters out potential entries based on the current candle's closing price relative to its opening price.
* The strategy only considers long entries on green candles (closing price higher than opening) and short entries on red candles (closing price lower than opening).
4. Volume:
* This indicator adds a volume filter to the entry conditions.
* The strategy only considers entries when the current candle's volume is higher than the average volume of the previous 20 candles, aiming for stronger signals.
Overall:
This strategy aims to capture long opportunities during potential uptrends and short opportunities during downtrends, based on a combination of price action, momentum, and volume confirmation.
Important Notes:
Backtesting is crucial to evaluate the historical performance of this strategy before deploying it with real capital.
Consider incorporating additional risk management techniques like stop-loss orders.
This strategy is just a starting point and can be further customized based on your trading goals and risk tolerance.
Forex Heatmap█ OVERVIEW
This indicator creates a dynamic grid display of currency pair cross rates (exchange rates) and percentage changes, emulating the Cross Rates and Heat Map widgets available on our Forex page. It provides a view of realtime exchange rates for all possible pairs derived from a user-specified list of currencies, allowing users to monitor the relative performance of several currencies directly on a TradingView chart.
█ CONCEPTS
Foreign exchange
The Foreign Exchange (Forex/FX) market is the largest, most liquid financial market globally, with an average daily trading volume of over 5 trillion USD. Open 24 hours a day, five days a week, it operates through a decentralized network of financial hubs in various major cities worldwide. In this market, participants trade currencies in pairs , where the listed price of a currency pair represents the exchange rate from a given base currency to a specific quote currency . For example, the "EURUSD" pair's price represents the amount of USD (quote currency) that equals one unit of EUR (base currency). Globally, the most traded currencies include the U.S. dollar (USD), Euro (EUR), Japanese yen (JPY), British pound (GBP), and Australian dollar (AUD), with USD involved in over 87% of all trades.
Understanding the Forex market is essential for traders and investors, even those who do not trade currency pairs directly, because exchange rates profoundly affect global markets. For instance, fluctuations in the value of USD can impact the demand for U.S. exports or the earnings of companies that handle multinational transactions, either of which can affect the prices of stocks, indices, and commodities. Additionally, since many factors influence exchange rates, including economic policies and interest rate changes, analyzing the exchange rates across currencies can provide insight into global economic health.
█ FEATURES
Requesting a list of currencies
This indicator requests data for every valid currency pair combination from the list of currencies defined by the "Currency list" input in the "Settings/Inputs" tab. The list can contain up to six unique currency codes separated by commas, resulting in a maximum of 30 requested currency pairs.
For example, if the specified "Currency list" input is "CAD, USD, EUR", the indicator requests and displays relevant data for six currency pair combinations: "CADUSD", "USDCAD", "CADEUR", "EURCAD", "USDEUR", "EURUSD". See the "Grid display" section below to understand how the script organizes the requested information.
Each item in the comma-separated list must represent a valid currency code. If the "Currency list" input contains an invalid currency code, the corresponding cells for that currency in the "Cross rates" or "Heat map" grid show "NaN" values. If the list contains empty items, e.g., "CAD, ,EUR, ", the indicator ignores them in its data requests and calculations.
NOTE: Some uncommon currency pair combinations might not have data feeds available. If no available symbols provide the exchange rates between two specified currencies, the corresponding table cells show "NaN" results.
Realtime data
The indicator retrieves realtime market prices, daily price changes, and minimum tick sizes for all the currency pairs derived from the "Currency list" input. It updates the retrieved information shown in its grid display after new ticks become available to reflect the latest known values.
NOTE: Pine scripts execute on realtime bars only when new ticks are available in the chart's data feed. If no new updates are available from the chart's realtime feed, it may cause a delay in the data the indicator receives.
Grid display
This indicator displays the requested data for each currency pair in a table with cells organized as a grid. Each row name corresponds to a pair's base currency , and each column name corresponds to a quote currency . The cell at the intersection of a specific row and column shows the value requested from the corresponding currency pair.
For example, the cell at the intersection of a "EUR" row and "USD" column shows the data retrieved for the "EURUSD" currency pair, and the cell at the "USD" row and "EUR" column shows data for the inverse pair ("USDEUR").
Note that the main diagonal cells in the table, where rows and columns with the same names intersect, are blank. The exchange rate from one currency to itself is always 1, and no Forex symbols such as "EUREUR" exist.
The dropdown input at the top of the "Settings/Inputs" tab determines the type of information displayed in the table. Two options are available: "Cross rates" and "Heat map" . Both modes color their cells for light and dark themes separately based on the inputs in the "Colors" section.
Cross rates
When a user selects the "Cross rates" display mode, the table's cells show the latest available exchange rate for each currency pair, emulating the behavior of the Cross Rates widget. Each cell's value represents the amount of the quote currency (column name) that equals one unit of the base currency (row name). This display allows users to compare cross rates across currency pairs, and their inverses.
The background color of each cell changes based on the most recent update to the exchange rate, allowing users to monitor the direction of short-term fluctuations as they occur. By default, the background turns green (positive cell color) when the cross rate increases from the last recorded update and red (negative cell color) when the rate decreases. The cell's color reverts to the chart's background color after no new updates are available for 200 milliseconds.
Heat map
When a user selects the "Heat map" display mode, the table's cells show the latest daily percentage change of each currency pair, emulating the behavior of the Heat Map widget.
In this mode, the background color of each cell depends on the corresponding currency pair's daily performance. Heat maps typically use colors that vary in intensity based on the calculated values. This indicator uses the following color coding by default:
• Green (Positive cell color): Percentage change > +0.1%
• No color: Percentage change between 0.0% and +0.1%
• Bright red (Negative cell color): Percentage change < -0.1%
• Lighter/darker red (Minor negative cell color): Percentage change between 0.0% and -0.1%
█ FOR Pine Script™ CODERS
• This script utilizes dynamic requests to iteratively fetch information from multiple contexts using a single request.security() instance in the code. Previously, `request.*()` functions were not allowed within the local scopes of loops or conditional structures, and most `request.*()` function parameters, excluding `expression`, required arguments of a simple or weaker qualified type. The new `dynamic_requests` parameter in script declaration statements enables more flexibility in how scripts can use `request.*()` calls. When its value is `true`, all `request.*()` functions can accept series arguments for the parameters that define their requested contexts, and `request.*()` functions can execute within local scopes. See the Dynamic requests section of the Pine Script™ User Manual to learn more.
• Scripts can execute up to 40 unique `request.*()` function calls. A `request.*()` call is unique only if the script does not already call the same function with the same arguments. See this section of the User Manual's Limitations page for more information.
• Typically, when requesting higher-timeframe data with request.security() using barmerge.lookahead_on as the `lookahead` argument, the `expression` argument should use the history-referencing operator to offset the series, preventing lookahead bias on historical bars. However, the request.security() call in this script uses barmerge.lookahead_on without offsetting the `expression` because the script only displays results for the latest historical bar and all realtime bars, where there is no future information to leak into the past. Instead, using this call on those bars ensures each request fetches the most recent data available from each context.
• The request.security() instance in this script includes a `calc_bars_count` argument to specify that each request retrieves only a minimal number of bars from the end of each symbol's historical data feed. The script does not need to request all the historical data for each symbol because it only shows results on the last chart bar that do not depend on the entire time series. In this case, reducing the retrieved bars in each request helps minimize resource usage without impacting the calculated results.
Look first. Then leap.

Moving Average Simple Tool [OmegaTools]This TradingView script is a versatile Moving Average Tool that offers users multiple moving average types and a customizable overbought and oversold (OB/OS) sensitivity feature. It is designed to assist in identifying potential price trends, reversals, and momentum by using different average calculations and providing visual indicators for deviation levels. Below is a detailed breakdown of the settings, functionality, and visual elements within the Moving Average Simple Tool.
Indicator Overview
Indicator Name: Moving Average Simple Tool
Short Title: MA Tool
Purpose: Provides a choice of six moving average types with configurable sensitivity, which helps traders identify trend direction, potential reversal zones, and overbought or oversold conditions.
Input Parameters
Source (src): This option allows the user to select the data source for the moving average calculation. By default, it is set to close, but users can choose other options like open, high, low, or any custom price data.
Length (lnt): Defines the period length for the moving average. By default, it is set to 21 periods, allowing users to adjust the moving average sensitivity to either shorter or longer periods.
Average Type (mode): This input defines the moving average calculation type. Six types of averages are available:
SMA (Simple Moving Average)
EMA (Exponential Moving Average)
WMA (Weighted Moving Average)
VWMA (Volume-Weighted Moving Average)
RMA (Rolling Moving Average)
Middle Line: Calculates the average between the highest and lowest price over the period specified in Length. This is useful for a mid-range line rather than a traditional moving average.
Sensitivity (sens): This parameter controls the sensitivity of the overbought and oversold levels. The sensitivity value can range from 1 to 40, where a lower value represents a higher sensitivity and a higher value allows for smoother OB/OS zones.
Color Settings:
OS (Oversold Color, upc): The color applied to deviation areas that fall below the oversold threshold.
OB (Overbought Color, dnc): The color applied to deviation areas that exceed the overbought threshold.
Middle Line Color (midc): A gradient color that visually blends between overbought and oversold colors for smoother visual transitions.
Calculation Components
Moving Average Calculation (mu): Based on the chosen Average Type, this calculation derives the moving average or middle line value for the selected source and length.
Deviation (dev): The deviation of the source value from the moving average is calculated. This is useful to determine whether the current price is significantly above or below the average, signaling potential buying or selling opportunities.
Overbought (ob) and Oversold (os) Levels: These levels are calculated using a linear percentile interpolation based on the deviation, length, and sensitivity inputs. The higher the sensitivity, the narrower the overbought and oversold zones, allowing users to capture more frequent signals.
Visual Elements
Moving Average Line (mu): This line represents the moving average based on the selected calculation method and is plotted with a dynamic color based on deviation thresholds. When the deviation crosses into overbought or oversold zones, it shifts to the corresponding OB/OS colors, providing a visual indication of potential trend reversals.
Deviation Plot (dev): This plot visualizes the deviation values as a column plot, with colors matching the overbought, oversold, or neutral states. This helps users to quickly assess whether the price is trending or reverting back to its mean.
Overbought (ob) and Oversold (os) Levels: These levels are plotted as fixed lines, helping users identify when the deviation crosses into overbought or oversold zones.
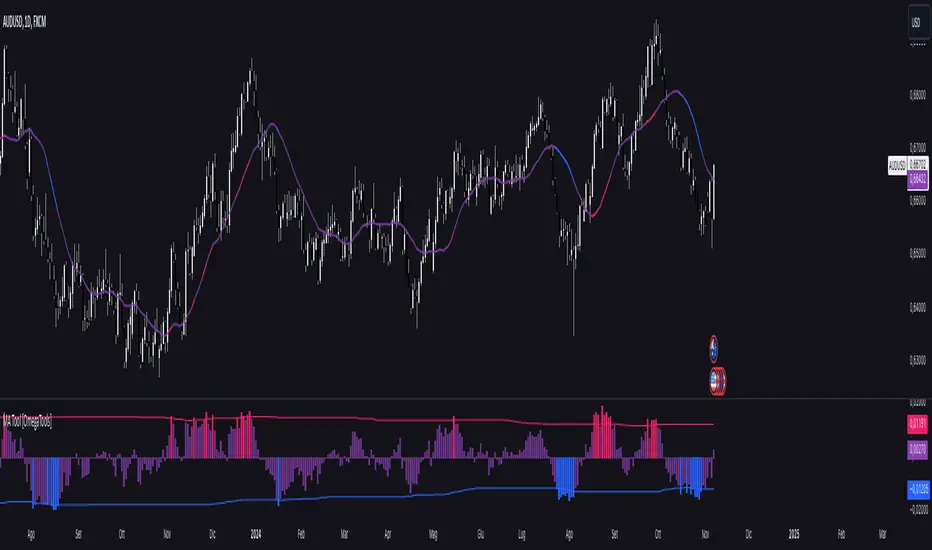
Options Series - Technical Analysis Chart➤ Simple Technical Chart Only:
➤ With MA-20 Overlay and Volatility background bars:
➤ With RSI Candles:
⭐ Overview and How It Works:
This script provides a multi-asset analysis tool to assess various market conditions across four symbols simultaneously. It combines several indicators such as daily price change, Moving Averages (MA), Bollinger Bands (BB), Parabolic SAR, RSI, and VWAP to generate buy/sell signals and trend indicators. Its strength lies in the layered use of indicators to enhance signal reliability, making it valuable for traders needing cross-validation in decision-making.
⭐ Key Features and Functionality:
The script evaluates each symbol's price against various indicators and conditions:
Daily Price Conditions: It checks if each symbol’s close price is above or below the previous day’s open, close, and intra-day ranges, forming a foundational bullish/bearish condition.
Range Breakout 1st 5min Candle (ORB): Opening Range Breakout levels are calculated and compared with current close prices, detecting breakout/breakdown conditions.
ORB Body: This basically calculates the previous day Daily candle body size, if todays Daily candle body size is greater than previous day, then we can say that we are having good momentum else its likely to be in-sidebar trading.
Moving Averages (MA): It leverages EMA-20, 2-day, and 3-day exponential moving averages to gauge short to medium-term trends.
RSI and VWAP: Relative Strength Index (RSI) determines overbought or oversold conditions, while VWAP compares prices to volume-weighted levels.
Bollinger Bands and Trend Analysis: Detects volatility and potential breakout conditions.
Concept of ORB Body:
Current_PrevDay_Body = (math.max(var_Current_PrevD_Open, var_Current_PrevD_Close) - math.min(var_Current_PrevD_Open, var_Current_PrevD_Close))
Current_Upper_ORB = var_Current_D_Open + Current_PrevDay_Body
Current_Lower_ORB = var_Current_D_Open - Current_PrevDay_Body
Current_TodayDay_Body = math.max(var_Current_D_Open, var_Current_Close) - math.min(var_Current_D_Open, var_Current_Close)
Current_ORBBody = Current_TodayDay_Body > Current_PrevDay_Body
Current_Upper_ORB_bull = (var_Current_Close > Current_Upper_ORB)
Current_Lower_ORB_bear = (var_Current_Close < Current_Lower_ORB)
🎨 Visualizations and User Experience:
The script can dynamically display colored backgrounds indicating trends when conditions are met. For example, the bgcolor function changes the background when certain trend-based criteria are satisfied, offering visual cues to users. Additionally, the checkbox input toggles trend bar visualizations, enhancing user experience by providing a quick visual reference without needing to interpret individual data points manually.
RSI-Based Candle Coloring:
➤ The script customizes candle colors based on RSI thresholds, specifically defining upper (60) and lower (40) RSI levels. When the RSI value exceeds the upper threshold, candles are colored as bullish (green), and if it falls below the lower threshold, candles are colored as bearish (red). Neutral RSI values result in a default color (gray).
➤ This setup offers a visually intuitive way to identify potential trend directions based on RSI levels, making it ideal for traders looking to gauge momentum visually.
⭐ Settings and Customization:
With multiple user-configurable inputs, the script allows for tailored analysis. Customizable parameters, such as enabling/disabling trend bars and setting various look-back periods for indicators like Bollinger Bands and Moving Averages, make it adaptable to various trading styles and preferences. It also allows users to modify visual elements like colors and styles, improving flexibility.
⭐ Uniqueness of the Concept:
The unique aspect of this script is its multi-symbol approach combined with complex conditions. By comparing not only one but four symbols simultaneously, it provides a broader market view and allows traders to correlate signals across different assets, offering a potential edge for diversified or comparative strategies. Additionally, the incorporation of ORB and multi-timeframe MAs gives it a robustness often lacking in simpler single-symbol scripts.
🚀 Conclusion:
This script is a powerful multi-indicator tool suited for traders looking for a comparative, multi-symbol analysis. With features like ORB, Bollinger Band-based trend detection, and MA cross-verification, it can assist traders in identifying and validating trend signals across assets. The user-friendly visualizations and customizable settings further enhance its usability, making it versatile for various trading strategies and preferences.