Crypto OI AgregatedCrypto OI Aggregated — Open Interest Aggregator for Crypto Exchanges
General Description
The indicator is designed for comprehensive analysis of Open Interest (OI) across major cryptocurrency exchanges. It consolidates data from multiple platforms, visualizes it as candlestick charts or deltas, and builds tables with breakdowns by exchange and contract type. This allows traders to quickly understand where market interest is concentrated and how the market structure is shifting.
Unlike standard tools that only show data from a single exchange, this indicator provides a full market overview and makes it easy to compare dynamics across different platforms.
⸻
Key Features
• Aggregation of OI data from exchanges: Binance, Bybit, OKX, Bitget, Kraken, HTX, Deribit (feel free to leave a comment if you’d like me to add other exchanges that provide open interest data)
• Support for contract types: USDT.P, USD.P, USDC.P, USD.PM
• Automatic normalization of various OI data formats from different providers
• Display modes:
• OI candlestick chart (total aggregated OI)
• OI Delta (change in OI per bar)
• Full table with detailed data by exchange and contract type
• Short summary table with totals in USD and base assets
• Support for USD or COIN denomination
• Convenient formatting for large numbers
• Customizable colors
⸻
How to Use the Indicator
1. Select Exchanges
In the settings, enable or disable specific exchanges. It is recommended to activate only the ones you need for analysis — this will make the indicator faster.
2. Choose Data Type
• OI — aggregated open interest from selected exchanges.
• OI delta — delta (change in OI compared to the previous bar).
3. Denomination
• USD — values are converted into USD equivalents.
• COIN — values are shown in the base asset (BTC, ETH, etc.).
4. Reading the Chart
• OI candlesticks show the overall OI dynamics.
• Delta histogram highlights how much OI has grown or decreased per bar.
• Colors are fully customizable.
5. Tables
• Enabled via the Show table option.
• Full Table → Rows = exchanges, Columns = contract types. Cells contain OI values in either USD or the base asset, depending on settings. Quickly shows where the main interest is concentrated.
• Short Table → Displays only the total OI values in USD and the base asset.
⸻
Important Notes
• For better readability of large values, two custom formatting functions were implemented. They work similarly to format.volume, but with improved digit grouping and adjustable decimal precision. In the tables, the top row is formatted using format.volume, while the bottom row uses the improved formatting functions for clearer representation.
str(d, n, s) =>
str.substring(d, 0, str.length(d) - n) + '.' + str.substring(d, str.length(d) - n, str.length(d) - (n - 2)) + s
format(_r) =>
d = str.tostring(math.round(_r))
str.length(d) > 9 ? str(d, 9, " B") : str.length(d) > 6 ? str(d, 6, " M") : str.length(d) > 3 ? str(d, 3, " K") : d
⸻
Conclusion: Crypto OI Aggregated is a convenient and powerful tool for cryptocurrency derivatives traders. It enables tracking of OI dynamics across multiple exchanges simultaneously, detecting imbalances between contracts, and identifying signals that are not visible when analyzing a single exchange.
Sentiment

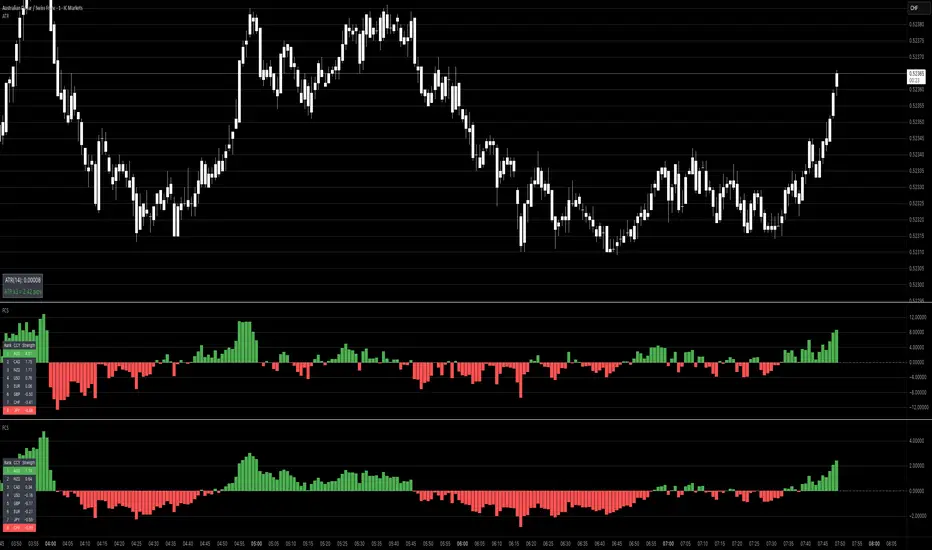
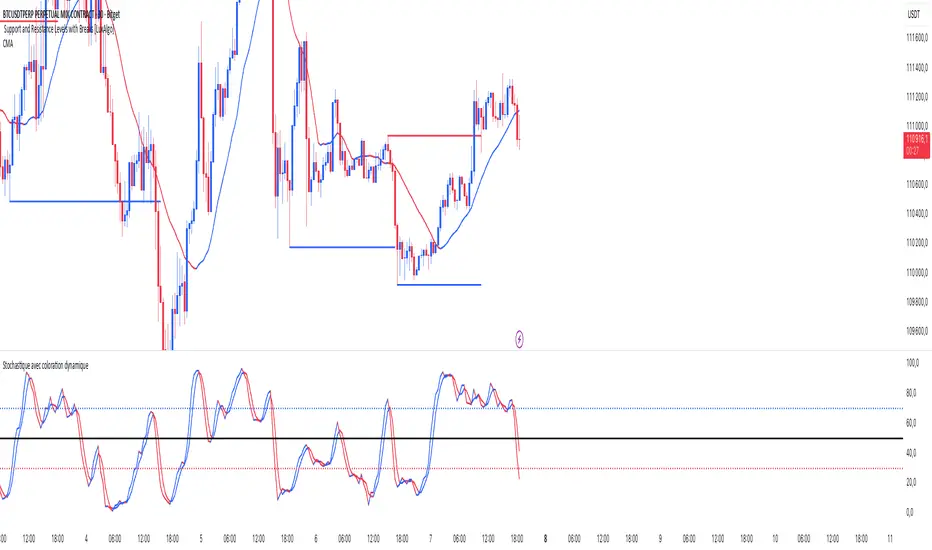
Stochastic ColorStochastic Color. A momentum indicator that compares a particular closing price of an asset to a range of its prices over a specific period of time. It helps identify overbought and oversold conditions in the market. The indicator ranges from 0 to 100, with readings above 80 typically considered overbought and readings below 20 considered oversold. It is often used to anticipate potential price reversals.
SMI Ergodic Oscillator ColorSMI Ergodic Oscillator Color. A variation of the True Strength Index (TSI), the SMI Ergodic Oscillator is a momentum indicator used to identify trend direction and potential reversals. It consists of a double-smoothed price momentum line and a signal line, helping traders spot buy and sell signals when the two lines cross. It is particularly useful for filtering out market noise and confirming the strength of a trend.
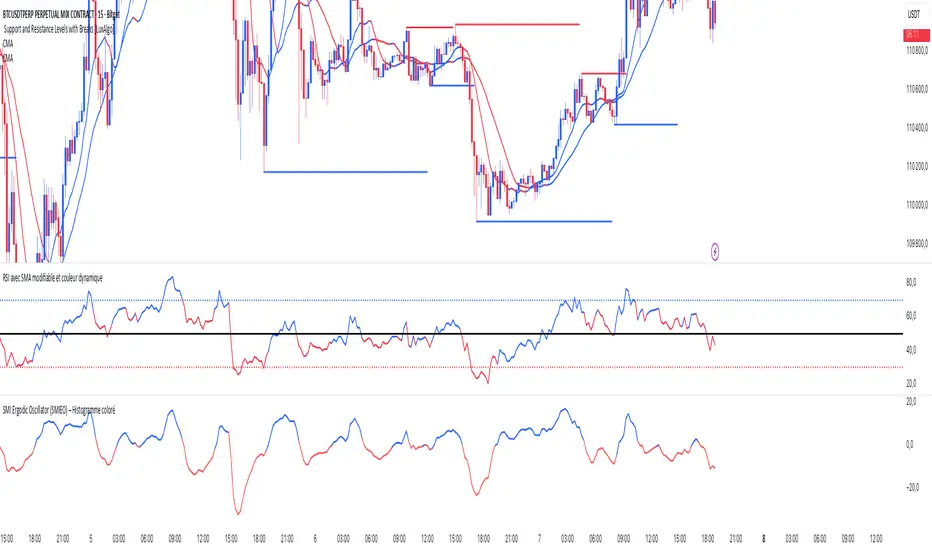
RSI SMA ColorRSI 14 with SMA 21 Color. A momentum oscillator that measures the speed and change of price movements. It ranges from 0 to 100 and is typically used to identify overbought or oversold conditions in a market. An RSI above 70 may indicate that an asset is overbought, while an RSI below 30 may suggest it is oversold.

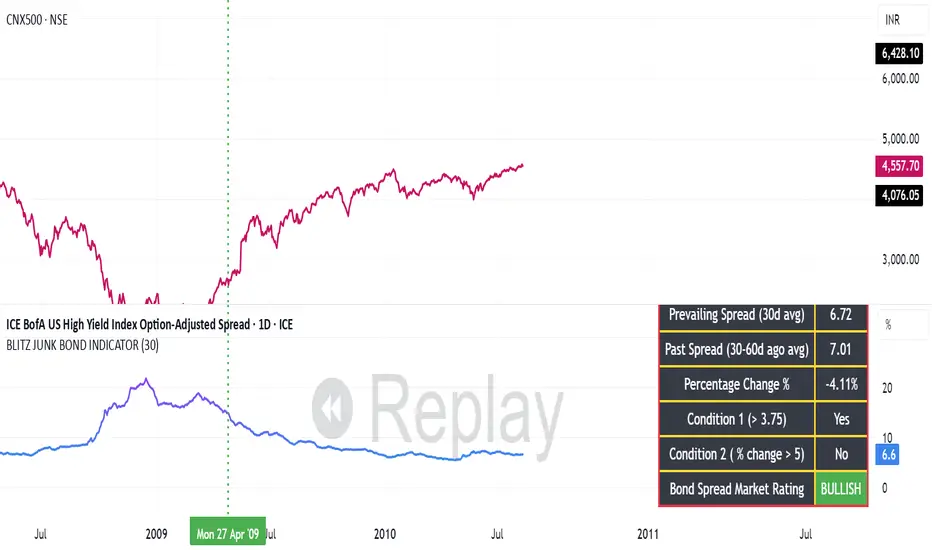
BLITZ JUNK BOND INDICATORThe given indicator considers the fluctuations in the bond market and the spread that are existing as a premium demanded by investors for high risk corporate junk bonds.
1. The junk bond spread indicator precisely anticipates market phases, especially any panic kind of scenario.
2. Junk bond spread indicator often face choppy market zone and entirely we must rely on our portfolio churning skills if such scenario occurs and the broader markets failed to perform even if the indicator has made us to make a buy position
3. Whenever Bullish signal comes, same is to be confirmed with the price action of the broader market index, then same to be confirmed in the junk bond spreads chart if the spreads are going down steadily or is breaking down from the nearest swing low and cooling off. This, scenario indicates we must expose our portfolio to equities
4. Whenever Bearish signal comes, same to be cofirmed with the price action of the broader market index, then same to be confirmed in the junk bond spread charts if the spreads are heating up breaking nearby swing highs or steadily moving up. In such scenario, we must prepare for heavy market drawdowns or must anticipate some panic scenario in the markets and thus should avoid equities.
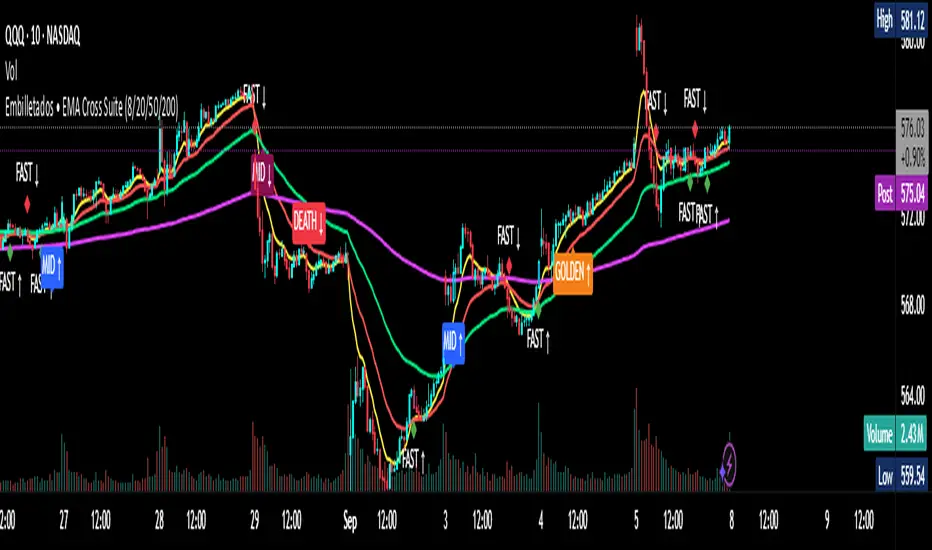
EMA Cross Suite (8/20/50/200) GOLDEN/DEATH by Carlos Chavez📜 Short Description (max 160 characters)
“Advanced EMA crossover system with FAST, MID, GOLDEN, and DEATH signals. Includes alerts, optimized visuals, and full customization.”
📄 Full Description (Paste in the box)
📌 Overview
The Embilletados • EMA Cross Suite is a professional trading indicator designed for intraday traders, scalpers, and swing traders.
It provides clear crossover signals using 4 EMAs combined with optimized visualization and built-in alerts to help you catch opportunities faster.
✨ Key Features:
🔹 4 configurable EMAs → 8, 20, 50, and 200.
🔹 Instant visual signals with colored labels:
FAST CROSS (8/20) → Quick momentum shifts.
MID CROSS (20/50) → Trend confirmation signals.
GOLDEN CROSS (50/200) → Strong bullish trend signals.
DEATH CROSS (50/200) → Strong bearish trend signals.
🔹 Built-in alerts → Get notified instantly for all crossover events.
🔹 Optimized visualization → Clean and easy-to-read interface.
🔹 Highly customizable → Enable/disable signals, labels, colors, and alerts according to your strategy.
📊 Recommended Timeframes:
10-minute charts → Best for intraday setups.
1-hour charts → Ideal for swing trading and trend confirmation.
🚀 How to Use:
Add the indicator to your chart.
Set up alerts for the desired crossovers: FAST, MID, GOLDEN, or DEATH.
Trade confidently using clear visual confirmations and real-time notifications.
🌟 Perfect for:
✅ Intraday traders
✅ Scalpers
✅ Swing traders
✅ Trend-following strategies
Retail Sentiment Indicator - Multi-Asset CFD & Fear/Greed IndexRetail Sentiment Indicator - Multi-Asset CFD & Fear/Greed Index
Overview
The Retail Sentiment Indicator provides real-time sentiment data for major financial instruments including stocks, forex, commodities, and cryptocurrencies. This indicator displays retail trader positioning and market sentiment using CFD data and fear/greed indices.
Methodology and Scale Calculation
This indicator operates on a **-50 to +50 scale** with zero representing perfect market equilibrium.
Scale Interpretation:
- **Zero (0)**: Market balance - exactly 50% of investors buying, 50% selling
- **Positive values**: Majority buying pressure
- Example: If 63% of investors are buying, the indicator shows +13 (63 - 50 = +13)
- **Negative values**: Majority selling pressure
- Example: If 92% of investors are selling, the indicator shows -42 (50 - 92 = -42)
BTC Fear & Greed Index Scaling:
The original `BTC FEAR&GREED` index is natively scaled from 0-100 by its creator. In our indicator, this data has been rescaled to also fit the -50 to +50 range for consistency with other sentiment data sources.
This unified scaling approach allows for direct comparison across all instruments and data sources within the indicator.
-Important Data Source Selection-
Bitcoin (BTC) Data Sources
When viewing Bitcoin charts, the indicator offers **two different data sources**:
1. **Default Auto-Mode**: `BTCUSD Retail CFD` - Retail CFD traders sentiment data (automatically loaded).
2. **Manual Selection**: `BTC FEAR&GREED` - Fear & Greed Index from website: alternative dot me
**To access BTC Fear & Greed Index**: Input settings -> disable checkbox "Auto-load Sentiment Data" -> manually select "BTC FEAR&GREED" from the dropdown menu.
US Stock Market Data Sources
For US stocks and indices (S&P 500, NASDAQ, Dow Jones), there are **two data source options**:
1. **Default Auto-Mode**: Individual retail CFD sentiment data for each instrument
2. **Manual Selection**: `SNN FEAR&GREED` - SNN's Fear & Greed Index covering the overall US market sentiment. SNN was used as the name to avoid any potential trademark infringement.
**To access SNN Fear & Greed Index**: When viewing US market charts, disable in input settings checkbox "Auto-load Sentiment Data" and manually select "SNN FEAR&GREED" from the dropdown menu.
This distinction allows traders to choose between **instrument-specific retail sentiment** (auto-mode) or **broader market sentiment indices** (manual selection).
Features
- **Auto-Detection**: Automatically loads sentiment data based on the current chart symbol
- **Manual Selection**: Choose from 40+ supported instruments when auto-detection is unavailable
- **Multiple Data Sources**: Combines retail CFD sentiment with Fear & Greed indices
- **Visual Zones**: Clear greed/fear zones with color-coded backgrounds
- **Real-time Updates**: Live sentiment data from merged data sources
Supported Instruments
Major Indices
- S&P 500, NASDAQ, Dow Jones 30, DAX
Forex Pairs
- Major pairs: EURUSD, GBPUSD, USDJPY, USDCHF, USDCAD
- Cross pairs: EURJPY, GBPJPY, AUDUSD, NZDUSD, and 20+ others
Commodities
- Precious metals: Gold (XAUUSD), Silver (XAGUSD)
- Energy: WTI Oil
- Agricultural: Wheat, Coffee
- Industrial: Copper
Cryptocurrencies
- Bitcoin (BTC) sentiment data
- BTC & SNN Fear & Greed indices
How to Use
1. **Auto Mode** (Default): Enable "Auto-load Sentiment Data" to automatically display sentiment for the current chart symbol
2. **Manual Mode**: Disable auto-load and select from the dropdown menu for specific instruments
3. **Interpretation**:
- Values above 0 (green) indicate retail greed/bullish sentiment
- Values below 0 (red) indicate retail fear/bearish sentiment
- Fear & Greed indices use 0-100 scale (50 is neutral)
Data Sources
This indicator uses curated sentiment data from retail CFD providers and established fear/greed indices. Data is updated regularly and sourced from reputable financial data providers.
Trading Strategy & Market Philosophy
Contrarian Trading Approach
The primary purpose of this indicator is based on the fundamental market principle that **the majority of retail investors are often wrong**, and markets typically move opposite to the positions held by the majority of market participants.
Key Strategy Guidelines:
- **Contrarian Signal**: When the majority of users are positioned on one side of the market, there is statistically greater market advantage in taking positions in the opposite direction
- **Trend Exhaustion Signal**: An interesting observed phenomenon occurs when, during a long-lasting trend where the majority of investors have consistently been on the wrong side, the Sentiment indicator suddenly shows that the majority has flipped and opened positions in the direction of that long-running trend. This is often a signal of fuel exhaustion for further movement in that direction
Interpretation Examples
- High greed readings (majority bullish) → Consider bearish opportunities
- High fear readings (majority bearish) → Consider bullish opportunities
- Sudden sentiment flip during established trends → Potential trend reversal signal
Technical Notes
- Built with PineScript v6
- Dynamic symbol detection with fallback options
- Optimized for performance with minimal resource usage
- Color-coded visualization with customizable zones
Data Sources & Expansion
Acknowledgments
We extend our gratitude to **TradingView** for enabling the use of custom data feeds based on GitHub repositories, making this comprehensive sentiment analysis possible.
Data Expansion Opportunities
As the operator of this indicator, I am **open to suggestions for new data sources** that could be integrated and published. If you have ideas for additional instruments or sentiment data:
How to Submit Suggestions:
1. Send a **private message** with your proposal
2. Include: **instrument/data type**, **source**, and **brief description**
3. If technically feasible, we will work to import and publish the data
Data Infrastructure Status
Current Data Upload Process:
Please note that sentiment data uploads may occasionally experience minor interruptions. However, this should not pose significant issues as sentiment data typically changes gradually rather than rapidly.
Infrastructure Development:
We are actively working on establishing permanent cloud-based infrastructure to ensure continuous, automated data collection and upload processes. This will provide more reliable and consistent data availability in the future.
Disclaimer
This indicator is for educational and informational purposes only. Sentiment data should be used as part of a comprehensive trading strategy and not as the sole basis for trading decisions. Past performance does not guarantee future results. The contrarian approach described is a market theory and may not always produce profitable results.

Composite Sentiment Indicator (SPY/QQQ/SOXX + VixFix)# Multi-Index Composite Sentiment Indicator
A comprehensive sentiment indicator that works across SPY, QQQ, SOXX, and custom symbols. Combines volatility, options flow, macro factors, technicals, and seasonality into a single z-score composite.
## What It Does
Takes multiple market sentiment inputs (VIX, put/call ratios, breadth, yields, etc.) and smooshes them into one normalized line. When the composite is high = markets getting spooked. When it's low = markets getting complacent.
## Key Features
- **Multi-Index Support**: Automatically adapts for SPY (uses VIX), QQQ (uses VXN), SOXX (uses VixFix), or custom symbols
- **VixFix Integration**: Larry Williams' VixFix for indices without dedicated VIX measures
- **Signal MA**: Choose from SMA/EMA/WMA/HMA/TEMA/DEMA with color coding (red above MA = risk-on, green below = risk-off)
- **September Focus**: Built-in seasonality weighting for September weakness patterns
- **Comprehensive Components**: Volatility, options sentiment, macro factors, technicals, and sector-specific metrics
## How to Use
**Basic Setup:**
1. Pick your index (SPY/QQQ/SOXX)
2. Choose signal MA type and length (EMA 21 is a good start)
3. Watch for extreme readings and MA crossovers
**Color Signals:**
- Red composite = above signal MA = bearish sentiment
- Green composite = below signal MA = bullish sentiment
- Extreme high readings (red background) = potential tops
- Extreme low readings (green background) = potential bottoms
**For Different Indices:**
- **QQQ**: Uses NASDAQ VIX (VXN) when available, falls back to VixFix
- **SOXX**: Includes semiconductor cycle indicators, uses VixFix for volatility
- **Custom**: Adapts automatically, relies on VixFix and general market metrics
## Components Included
**Volatility**: VIX/VXN/VixFix, term structure, historical vol
**Options**: Put/call ratios, SKEW index
**Macro**: DXY, 10Y yields, yield curve, TIPS spreads
**Technical**: RSI deviation, momentum
**Seasonality**: September effects, quad witching, month-end patterns
**Breadth**: S&P 500 and NASDAQ breadth measures
## Pro Tips
- Works well on Daily Timeframe
- September gets extra weight automatically - watch for August setup signals
- Keltner envelope breaks often mark sentiment exhaustion points
- Use alerts for extreme readings and MA crossovers
Works best when you understand that sentiment extremes often mark turning points, not continuation signals. High readings don't mean "keep shorting" - they mean "start looking for reversal setups."
## Settings Worth Tweaking
- Signal MA type/length for your timeframe
- Component weights based on what matters for your index
- Envelope multipliers for your risk tolerance
- VixFix parameters if default doesn't fit your symbol's volatility
The table shows all current component readings so you can see what's driving the signal. Good for context and debugging weird readings.

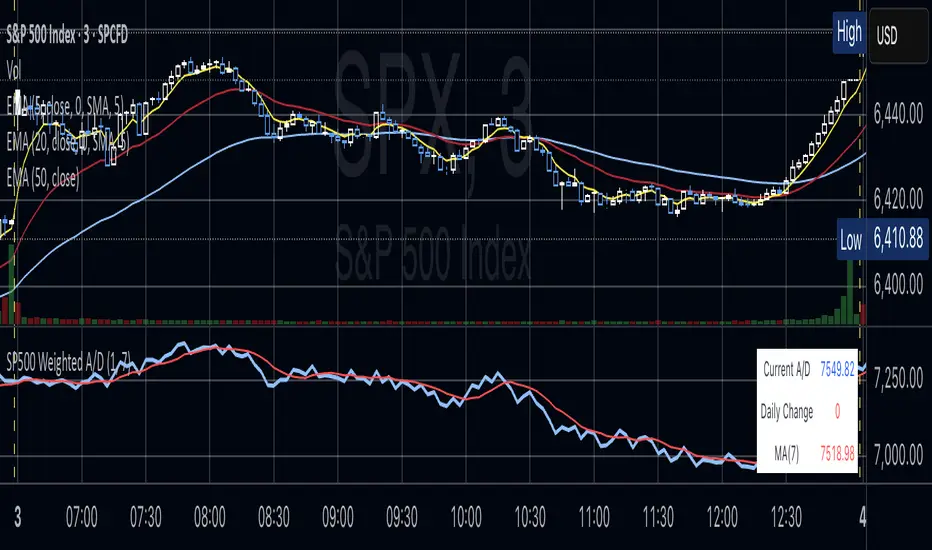
S&P 500 Weighted Advance Decline LineS&P 500 Weighted Advance Decline Line Indicator
Overview
This indicator creates a market cap weighted advance/decline line for the S&P 500 that tracks breadth based on actual index weights rather than treating all stocks equally. By weighting each stock's contribution according to its true S&P 500 impact, it provides more accurate market breadth analysis and better insights into underlying market strength and potential turning points.
Key Features
Market Cap Weighted: Each stock contributes based on its actual S&P 500 weight
Top 40 Stocks: Covers ~51% of the index with the largest companies
(limited by TradingView's 40 security call maximum for Premium accounts)
Real-Time Updates: Cumulative line shows long-term breadth trends
Visual Indicators: Background coloring, moving average option, and data table
Stock Coverage
Sector Breakdown:
Technology (29.8%) - Dominates the coverage as expected
Financials (5.8%) - Major banking and payment companies
Consumer/Retail (3.7%) - Consumer staples and retail giants
Healthcare (3.2%) - Pharma and healthcare services
Communication (1.97%) - Telecom and tech services
Energy (1.35%) - Oil and gas majors
Industrial (0.9%) - Aerospace and industrial equipment
Other Sectors (4.6%) - Miscellaneous including software and payments
Includes the 40 largest S&P 500 companies by weight, featuring:
Tech Leaders (29.8%): AAPL (7.0%), MSFT (6.5%), NVDA (4.5%), AMZN (3.5%), META (2.5%), GOOGL/GOOG (3.8%), AVGO (1.5%), ORCL (1.22%), AMD (0.51%), plus others
Financials (5.8%): BRK.B (1.8%), JPM (1.2%), V (1.0%), MA (0.8%), BAC (0.63%), WFC (0.46%)
Healthcare (3.2%): LLY (1.2%), UNH (1.2%), JNJ (1.1%), ABBV (0.8%), PG (0.9%)
Consumer/Retail (3.7%): WMT (0.8%), HD (0.8%), COST (0.7%), KO (0.6%), PEP (0.6%), NKE (0.4%)
Communication (1.97%): TMUS (0.47%), CSCO (0.47%), DIS (0.5%), CRM (0.5%)
Energy** (1.35%): XOM (0.8%), CVX (0.55%)
Industrial** (0.9%): GE (0.5%), BA (0.4%)
Other Sectors (4.6%): PLTR (0.65%), ADBE (0.6%), PYPL (0.3%), plus others
How to Interpret
Trend Signals
Rising A/D Line: Broad market strength, more weighted buying than selling
Falling A/D Line: Market weakness, more weighted selling pressure
Flat A/D Line: Balanced market conditions
Divergence Analysis
Bullish Divergence: S&P 500 makes new lows but A/D Line holds higher
Bearish Divergence: S&P 500 makes new highs but A/D Line fails to confirm
Confirmation
Strong trends occur when both price and A/D Line move in the same direction
Weak trends show when price moves but breadth doesn't follow
Settings
Lookback Period: Days for advance/decline comparison (default: 1)
Show Moving Average: Optional trend smoothing
MA Length: Moving average period (default: 20)
Limitations
Covers ~51% of S&P 500 (not complete market breadth)
Optimized for TradingView Premium accounts (40 security limit)
Heavy weighting toward mega-cap technology stocks
Dependent on real-time data quality
Fear & Greed [theUltimator5]This indicator attempts to replicate CNN's Fear & Greed Index methodology to measure market sentiment on a scale from 0-100. It combines seven key market components into a single sentiment score, where lower values indicate fear and higher values indicate greed.
Note: It is impossible to perfectly replicate the true Fear & Greed indicator due to data limitations, so this indicator attempts to best replicate the output for each of the (7) components using available data.
The uniqueness of this indicator comes from the calculation methods for the 7 components as well as the visual representation of the data, which includes a table and selectable plots for each of the 7 components which make up the overall sentiment. Existing variants of the Fear & Greed Index have substantial flaws in the calculations of several of the components which result in warped final sentiment numbers. This indicator attempts to better track all 7 components and provide a closer model to the actual Fear & Greed index.
Here are the seven components and a brief description of how each are calculated:
1. Market Momentum
Calculation: S&P 500 current price vs. 125-day moving average
Measures how far the market has moved from its long-term trend
Uses CNN-style Z-score normalization over 252 trading days
Higher values indicate strong upward momentum (greed)
Lower values suggest declining momentum (fear)
2. Stock Strength
Calculation: S&P 500 RSI scaled to 252-day range
Uses 14-period RSI of the S&P 500 index
Normalizes RSI values based on their 252-day minimum and maximum
Measures overbought/oversold conditions relative to recent history
Higher values indicate overbought conditions (greed)
Lower values suggest oversold conditions (fear)
3. Price Breadth
Calculation: Modified McClellan Oscillator
Primary: Uses NYSE advancing vs. declining issues with 7-day smoothing
Fallback: Compares sector performance (QQQ, IWM vs. SPY)
Measures how many stocks participate in market moves
Broader participation indicates healthier trends
Narrow breadth suggests selective or weak trends
4. Put/Call Ratio
Calculation: Inverted CBOE Put/Call ratios
Primary: CBOE Equity-only Put/Call ratio (more sensitive)
Fallback: CBOE Total Put/Call ratio
Uses 5-day average and applies CNN normalization
Higher put/call ratios indicate fear (inverted to lower scores)
Lower put/call ratios suggest complacency (higher scores)
5. Market Volatility
Calculation: VIX relative to its 50-day average
Compares current VIX level to its 50-day moving average
Measures deviation from normal volatility expectations
Higher VIX relative to average indicates fear (lower scores)
Lower relative VIX suggests complacency (higher scores)
6. Safe Haven Demand
Calculation: Stock returns vs. bond yield changes
Compares 20-day smoothed S&P 500 returns to Treasury yield changes
When stocks outperform bonds, indicates risk appetite (higher scores)
When bonds outperform stocks, suggests risk aversion (lower scores)
Uses Treasury 10-year yields as the safe haven benchmark
7. Junk Bond Demand
Calculation: High-yield bond spread analysis
Measures yield spread between junk bonds (JNK ETF) and Treasuries
Compares current spread to its 5-day average
Narrowing spreads indicate risk appetite (higher scores)
Widening spreads suggest risk aversion (lower scores)
The combined sentiment is plotted as a single line which changes color based on the current sentiment value.
0-25: Extreme Fear (Red) - Market panic, oversold conditions
26-45: Fear (Orange) - Cautious sentiment, bearish bias
46-55: Neutral (Yellow) - Balanced market sentiment
56-75: Greed (Light Green) - Optimistic sentiment, bullish bias
76-100: Extreme Greed (Green) - Market euphoria, potentially overbought
There are dashed lines to represent the threshold values for each of the sentiments to better visualize transitions.
The table displays each of the (7) components of the index and their respective values. The table can be toggled on/off and the position can be moved.
An optional secondary line can be toggled on to display (1) of the (7) components as a unique color and the component name and value will highlight on the table. The secondary line can be used to dig into the main driving forces behind the overall index value.

Futures Multi-Asset Open Distance Table## Multi-Asset Open Distance Table - Quick Description
This Pine Script indicator displays a **real-time table** that tracks how far **three user-selected assets** are from their key opening price levels.
**What it shows:**
- **Three customizable assets** (default: NQ!, ES!, YM!)
- **Distance from 3 key opens** for each asset:
- **1800 ET Open** (Electronic trading session start)
- **0930 ET Open** (Regular market hours start)
- **Weekly Open** (Beginning of trading week)
**Visual features:**
- **Percentage changes** from each open level
- **Color coding**: Green for gains above opens, red for losses below opens
- **Direction arrows**: ▲ (above), ▼ (below), ■ (unchanged)
- **Customizable table position** and size
**Perfect for:**
- **Intraday traders** monitoring key session levels
- **Multi-timeframe analysis** across different market opens
- **Quick reference** to see which assets are performing relative to major opening levels
- **Session-based trading strategies** using 6PM and 9:30AM opens
The table updates in real-time and provides an at-a-glance view of where your chosen assets stand relative to these critical price reference points throughout the trading day.

NY Anchored VWAP and Auto SMANY Anchored VWAP and Auto SMA
This script is a versatile trading indicator for the TradingView platform that combines two powerful components: a New York-anchored Volume-Weighted Average Price (VWAP) and a dynamic Simple Moving Average (SMA). Designed for traders who utilize VWAP for intraday trend analysis, this tool provides a clear visual representation of average price and volatility-adjusted moving averages, generating automated alerts for key crossover signals.
Indicator Components
1. NY Anchored VWAP
The VWAP is a crucial tool that represents the average price of a security adjusted for volume. This version is "anchored" to the start of the New York trading session, resetting at the beginning of each new session. This provides a clean, session-specific anchor point to gauge market sentiment and trend. The VWAP line changes color to reflect its slope:
Green: When the VWAP is trending upwards, indicating a bullish bias.
Red: When the VWAP is trending downwards, indicating a bearish bias.
2. Auto SMA
The Auto SMA is a moving average with a unique twist: its lookback period is not fixed. Instead, it dynamically adjusts based on market volatility. The script measures volatility using the Average True Range (ATR) and a Z-Score calculation.
When volatility is expanding, the SMA's length shortens, making it more sensitive to recent price changes.
When volatility is contracting, the SMA's length lengthens, smoothing out the price action to filter out noise.
This adaptive approach allows the SMA to react appropriately to different market conditions.
Suggested Trading Strategy
This indicator is particularly effective when used on a one-minute chart for identifying high-probability trade entries. The core of the strategy is to trade the crossover between the VWAP and the Auto SMA, with confirmation from a candle close.
The strategy works best when the entry signal aligns with the overall bias of the higher timeframe market structure. For example, if the daily or 4-hour chart is in an uptrend, you would look for bullish signals on the one-minute chart.
Bullish Entry Signal: A potential entry is signaled when the VWAP crosses above the Auto SMA, and is confirmed when the one-minute candle closes above both the VWAP and the SMA. This indicates a potential continuation of the bullish momentum.
Bearish Entry Signal: A potential entry is signaled when the VWAP crosses below the Auto SMA, and is confirmed when the one-minute candle closes below both the VWAP and the SMA. This indicates a potential continuation of the bearish momentum.
The built-in alerts for these crossovers allow you to receive notifications without having to constantly monitor the charts, ensuring you don't miss a potential setup.

Benchmark Relative Performance BRPBenchmark Relative Performance (BRP) is a comprehensive technical analysis tool that compares any stock's performance against a chosen benchmark (QQQ, SPY, IWM, etc.) to identify outperformance and underperformance patterns.
Key Features:
Dual-line visualization: Shows both ticker and relative strength performance
Dynamic color coding: 5-level color system indicating performance strength
Customizable benchmark: Choose from any ticker via TradingView's symbol picker
Volume weighting: Optional volume analysis for stronger signal confirmation
Performance zones: Visual thresholds for strong/moderate performance levels
Compact info table: Real-time performance status and values
What It Shows:
Benchmark Performance Line (Blue): Shows your chosen benchmark's percentage performance
Relative Strength Line (Color-coded): Shows how much the ticker outperforms/underperforms
Fill Area: Visual gap between ticker and benchmark performance
Performance Zones: Dotted lines marking significant performance thresholds
Color System:
Green: Strong outperformance (above custom threshold)
Lime: Standard outperformance
Yellow: Neutral/Equal performance
Orange: Standard underperformance
Red: Strong underperformance (below custom threshold)
Best Used For:
Stock selection and rotation strategies
Sector/ETF relative strength analysis
Identifying momentum shifts vs benchmarks
Portfolio performance evaluation
Market timing based on relative performance
Settings:
Customizable lookback period (default: 20)
Adjustable strong performance threshold (default: 5%)
Optional volume weighting factor
Full table customization (position, colors, fonts)
Performance display (percentage or decimal)
Perfect for traders and investors who want to identify stocks showing relative strength or weakness compared to major market benchmarks.

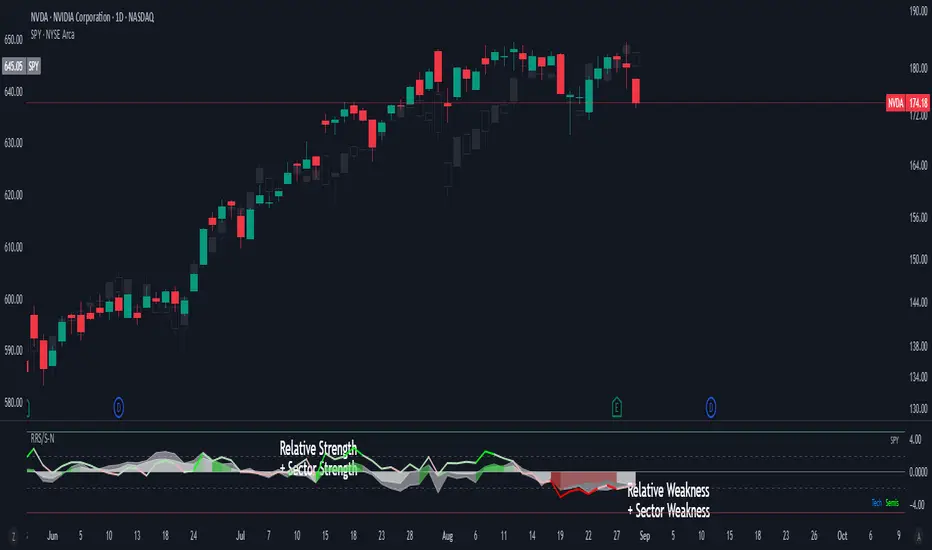
Real Relative Sector Strength - NormalizedShows RS/RW, which is esp. helpful if it's not fully clear based on the stock's chart movement compared to SPY's movement.
"Glowing green" = safely strong
"Glowing red" = safely weak
More infos: www.reddit.com
Elliott Wave [BigBeluga]🔵 OVERVIEW
Elliott Wave automatically finds and draws an Elliott-style 5-wave impulse and a dashed projection for a potential -(a)→(b)→(c) correction. It detects six sequential reversal points from rolling highs/lows — 1, 2, 3, 4, 5, (a) — validates their relative placement, and then renders the wave with labels and horizontal reference lines. If price invalidates the structure by closing back through the Wave-5 level inside a 100-bar window, the pattern is cleared (optionally kept as “broken”) while key dotted levels remain for context.
🔵 CONCEPTS
Reversal harvesting from extremes : The script scans highest/lowest values over a user-set Length and stores swing points with their bar indices.
Six-point validation : A pattern requires six pivots (1…5 and (a)). Their vertical/temporal order must satisfy Elliott-style constraints before drawing.
Impulse + projection : After confirming 1→5, the tool plots a curved polyline through the pivots and a dashed forward path from (a) toward (b) (midpoint of 5 and (a)) and back to (c).
Risk line (invalidator) : The Wave-5 price is tracked; a close back through it within 100 bars marks the structure as broken.
Minimal persistence : When broken, the wave drawing is removed to avoid noise, while dotted horizontals for waves 5 and 4 remain as reference.
🔵 FEATURES
Automatic pivot collection from rolling highs/lows (user-controlled Length ).
Wave labeling : Points 1–5 are printed; the last collected swing is marked b
. Projected i
& i
are shown with a dashed polyline.
Breaker line & cleanup : If price closes above Wave-5 (opposite for bears) within 100 bars, the pattern is removed; only dotted levels of 5 and 4 stay.
Styling controls :
Length (pivot sensitivity)
Text Size for labels (tiny/small/normal/large)
Wave color input
Show Broken toggle to keep invalidated patterns visible
Lightweight memory : Keeps a compact buffer of recent pivots/draws to stay responsive.
🔵 HOW TO USE
Set sensitivity : Increase Length on noisy charts for cleaner pivots; decrease to catch earlier/shorter structures.
Wait for confirmation : Once 1→5 is printed and (a) appears, use the Wave-5 line as your invalidation. A close back through it within ~100 bars removes the active wave (unless Show Broken is on).
Plan with the dashed path : The (a)→(b)→(c) projection offers a scenario for potential corrective movement and risk placement.
Work MTF : Identify cleaner waves on higher TFs; refine execution on lower TFs near the breaker or during the move toward (b).
Seek confluence : Align with structure (S/R), volume/Delta, or your trend filter to avoid counter-context trades.
🔵 CONCLUSION
Elliott Wave systematizes discretionary wave analysis: it detects and labels the 5-wave impulse, projects a plausible (a)-(b)-(c) path, and self-cleans on invalidation. With clear labels, dotted reference levels, and a practical breaker rule, it gives traders an objective framework for scenario planning, invalidation, and timing.

Secret bubbleSecret bubble
Why Might It Be Called "Bubbles"?
Although not officially named so, some traders or platforms might refer to Bollinger Bands as "bubbles" because:
The bands visually surround the price like a bubble.
During low volatility, the bands form a tight "bubble" around price.
Breakouts look like the price "popping out" of a bubble.
Hence, the nickname "пузырьки" (bubbles) could be a colloquial or visual metaphor for Bollinger Bands in Russian-speaking trading communities.
Conclusion
While there is no official technical indicator called "Bubbles", the term likely refers to Bollinger Bands due to their visual appearance and function. This powerful tool helps traders assess volatility, spot potential reversals, and time entries and exits. When combined with other analysis methods, Bollinger Bands remain a cornerstone of modern technical trading.
🔧 Tip: You can find Bollinger Bands on almost every trading platform (TradingView, MetaTrader, ThinkorSwim) by searching "Bollinger Bands" in the indicators list.

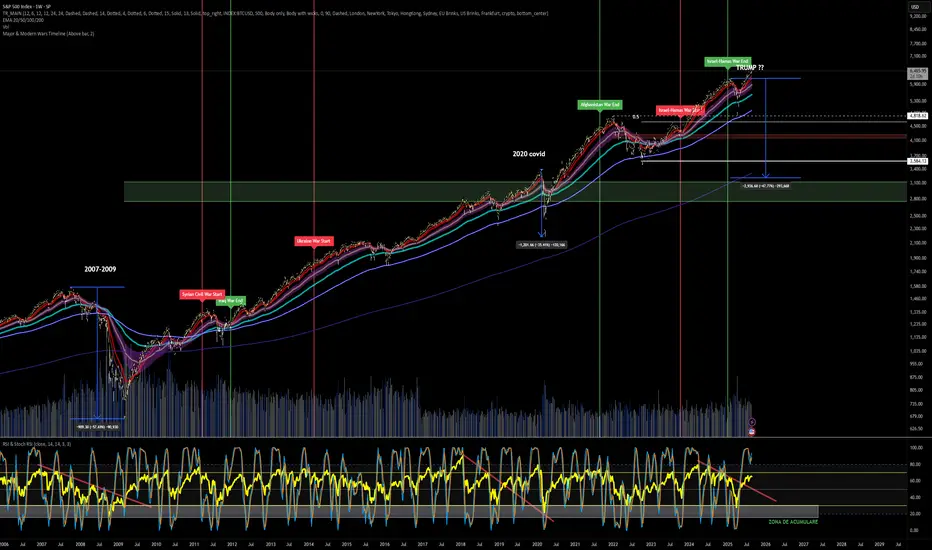
Major & Modern Wars TimelineDescription:
This indicator overlays vertical lines and labels on your chart to mark the start and end dates of major global wars and modern conflicts.
Features:
Displays start (red line + label) and end (green line + label) for each war.
Covers 20th century wars (World War I, World War II, Korean War, Vietnam War, Gulf War, Afghanistan, Iraq).
Includes modern conflicts: Syrian Civil War, Ukraine War, and Israel–Hamas War.
For ongoing conflicts, the end date is set to 2025 for timeline visualization.
Customizable: label position (above/below bar), line width.
Works on any chart timeframe, overlaying events on financial data.
Use case:
Useful for historical market analysis (e.g., gold, oil, S&P 500), helping traders and researchers see how wars and conflicts align with market movements.
Market Cap Landscape 3DHello, traders and creators! 👋
Market Cap Landscape 3D. This project is more than just a typical technical analysis tool; it's an exploration into what's possible when code meets artistry on the financial charts. It's a demonstration of how we can transcend flat, two-dimensional lines and step into a vibrant, three-dimensional world of data.
This project continues a journey that began with a previous 3D experiment, the T-Virus Sentiment, which you can explore here:
The Market Cap Landscape 3D builds on that foundation, visualizing market data—particularly crypto market caps—as a dynamic 3D mountain range. The entire landscape is procedurally generated and rendered in real-time using the powerful drawing capabilities of polyline.new() and line.new() , pushed to their creative limits.
This work is intended as a guide and a design example for all developers, born from the spirit of learning and a deep love for understanding the Pine Script™ language.
---
🧐 Core Concept: How It Works
The indicator synthesizes multiple layers of information into a single, cohesive 3D scene:
The Surface: The mountain range itself is a procedurally generated 3D mesh. Its peaks and valleys create a rich, textured landscape that serves as the canvas for our data.
Crypto Data Integration: The core feature is its ability to fetch market cap data for a list of cryptocurrencies you provide. It then sorts them in descending order and strategically places them onto the 3D surface.
The Summit: The highest point on the mountain is reserved for the asset with the #1 market cap in your list, visually represented by a flag and a custom emblem.
The Mountain Labels: The other assets are distributed across the mountainside, with their rank determining their general elevation. This creates an intuitive visual hierarchy.
The Leaderboard Pole: For clarity, a dedicated pole in the back-right corner provides a clean, ranked list of the symbols and their market caps, ensuring the data is always easy to read.
---
🧐 Example of adjusting the view
To evoke the feeling of flying over mountains
To evoke the feeling of looking at a mountain peak on a low plain
🧐 Example of predefined colors
---
🚀 How to Use
Getting started with the Market Cap Landscape 3D:
Add to Chart: Apply the "Market Cap Landscape 3D" indicator to your active chart.
Open Settings: Double-click anywhere on the 3D landscape or click the "Settings" icon next to the indicator's name.
Customize Your Crypto List: The most important setting is in the Crypto Data tab. In the "Symbols" text area, enter a comma-separated list of the crypto tickers you want to visualize (e.g., BTC,ETH,SOL,XRP ). The indicator supports up to 40 unique symbols.
> Important Note: This indicator exclusively uses TradingView's `CRYPTOCAP` data source. To find valid symbols, use the main symbol search bar on your chart. Type `CRYPTOCAP:` (including the colon) and you will see a list of available options. For example, typing `CRYPTOCAP:BTC` will confirm that `BTC` is a valid ticker for the indicator's settings. Using symbols that do not exist in the `CRYPTOCAP` index will result in a script error. or, to display other symbols, simply type CRYPTOCAP: (including the colon) and you will see a list of available options.
Adjust Your View: Use the settings in the Camera & Projection tab to rotate ( Yaw ), tilt ( Pitch ), and scale the landscape until you find a view you love.
Explore & Customize: Play with the color palettes, flag design, and other settings to make the landscape truly your own!
---
⚙️ Settings & Customization
This indicator is highly customizable. Here’s a breakdown of what each setting does:
#### 🪙 Crypto Data
Symbols: Enter the crypto tickers you want to track, separated by commas. The script automatically handles duplicates and case-insensitivity.
Show Market Cap on Mountain: When checked, it displays the full market cap value next to the symbol on the mountain. When unchecked, it shows a cleaner look with just the symbol and a colored circle background.
#### 📷 Camera & Projection
Yaw (°): Rotates the camera view horizontally (side to side).
Pitch (°): Tilts the camera view vertically (up and down).
Scale X, Y, Z: Stretches or compresses the landscape in width, depth, and height, respectively. Fine-tune these to get the perfect perspective.
#### 🏞️ Grid / Surface
Grid X/Y resolution: Controls the detail level of the 3D mesh. Higher values create a smoother surface but may use more resources.
Fill surface strips: Toggles the beautiful color gradient on the surface.
Show wireframe lines: Toggles the visibility of the grid lines.
Show nodes (markers): Toggles the small dots at each grid intersection point.
#### 🏔️ Peaks / Mountains
Fill peaks volume: Draws vertical lines on high peaks, giving them a sense of volume.
Fill peaks surface: Draws a cross-hatch pattern on the surface of high peaks.
Peak height threshold: Defines the minimum height for a peak to receive the fill effect.
Peak fill color/density: Customizes the appearance of the fill lines.
#### 🚩 Flags (3D)
Show Flag on Summit: A master switch to show or hide the flag and emblem entirely.
Flag height, width, etc.: Provides full control over the dimensions and orientation of the flag on the highest peak.
#### 🎨 Color Palette
Base Gradient Palette: Choose from 13 stunning, pre-designed color themes for the landscape, from the classic SUNSET_WAVE to vibrant themes like NEON_DREAM and OCEANIC .
#### 🛡️ Emblem / Badge Controls
This section gives you granular control over every element of the custom emblem on the flag. Tweak rotation, offsets, and scale to design your unique logo.
---
👨💻 Developer's Corner: Modifying the Core Logic
If you're a developer and wish to customize the indicator's core data source, this section is for you. The script is designed to be modular, making it easy to change what data is being ranked and visualized.
The heart of the data retrieval and ranking logic is within the f_getSortedCryptoData() function. Here’s how you can modify it:
1. Changing the Data Source (from Market Cap to something else):
The current logic uses request.security("CRYPTOCAP:" + syms.get(i), ...) to fetch market capitalization data. To change this, you need to modify this line.
Example: Ranking by RSI (14) on the Daily timeframe.
First, you'll need a function to calculate RSI. Add this function to the script:
f_getRSI(symbol, timeframe, length) =>
request.security(symbol, timeframe, ta.rsi(close, length))
Then, inside f_getSortedCryptoData() , find the `for` loop that populates the `caps` array and replace the `request.security` call:
// OLD LINE:
// caps.set(i, request.security("CRYPTOCAP:" + syms.get(i), timeframe.period, close))
// NEW LINE for RSI:
// Note: You'll need to decide how to format the symbol name (e.g., "BINANCE:" + syms.get(i) + "USDT")
caps.set(i, f_getRSI("BINANCE:" + syms.get(i) + "USDT", "D", 14))
2. Changing the Data Formatting:
The ranking values are formatted for display using the f_fmtCap() function, which currently formats large numbers into "M" (millions), "B" (billions), etc.
If you change the data source to something like RSI, you'll want to change the formatting. You can modify f_fmtCap() or create a new formatting function.
Example: Formatting for RSI.
// Modify f_fmtCap or create f_fmtRSI
f_fmtRSI(float v) =>
str.tostring(v, "#.##") // Simply format to two decimal places
Remember to update the calls to this function in the main drawing loop where the labels are created (e.g., str.format("{0}: {1}", crypto.symbol, f_fmtCap(crypto.cap)) ).
By modifying these key functions ( f_getSortedCryptoData and f_fmtCap ), you can adapt the Market Cap Landscape 3D to visualize and rank almost any dataset you can imagine, from technical indicators to fundamental data.
---
We hope you enjoy using the Market Cap Landscape 3D as much as we enjoyed creating it. Happy charting! ✨

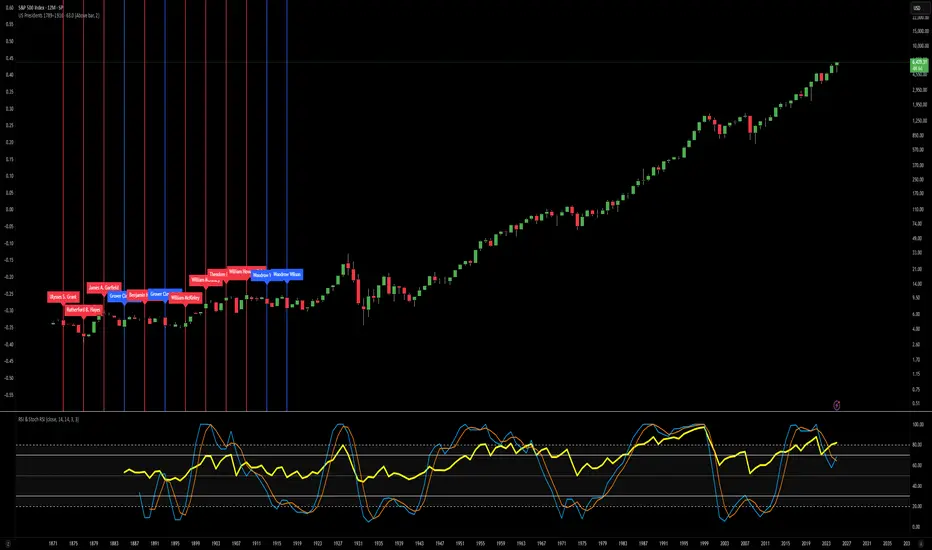
US Presidents 1789–1916Description:
This indicator displays all U.S. presidential elections from 1789 to 1916 on your chart.
Features:
Vertical lines at the date of each presidential election.
Line color by party:
Red = Republican
Blue = Democrat
Gray = Other/None
Labels showing the name of each president.
Historical flag style: All presidents before 1900 are considered historical, providing visual distinction.
Fully overlayed on the price chart for timeline context.
Customizable: Label position (above/below bar) and line width.
Use case: Great for studying historical market behavior around elections or for general reference of U.S. presidents during the early history of the country.
US Presidents 1920–2024Description:
This indicator displays all U.S. presidential elections from 1920 to 2024 on your chart.
Features:
Vertical lines at the date of each presidential election.
Line color by party:
Red = Republican
Blue = Democrat
Gray = Other/None
Labels showing the name of each president.
Modern flag style: Presidents from 1900 onward are highlighted as modern, giving clear historical separation.
Fully overlayed on the price chart for timeline context.
Customizable: Label position (above/below bar) and line width.
Use case: Useful for analyzing modern U.S. presidential cycles, market reactions to elections, or quickly referencing recent presidents directly on charts.

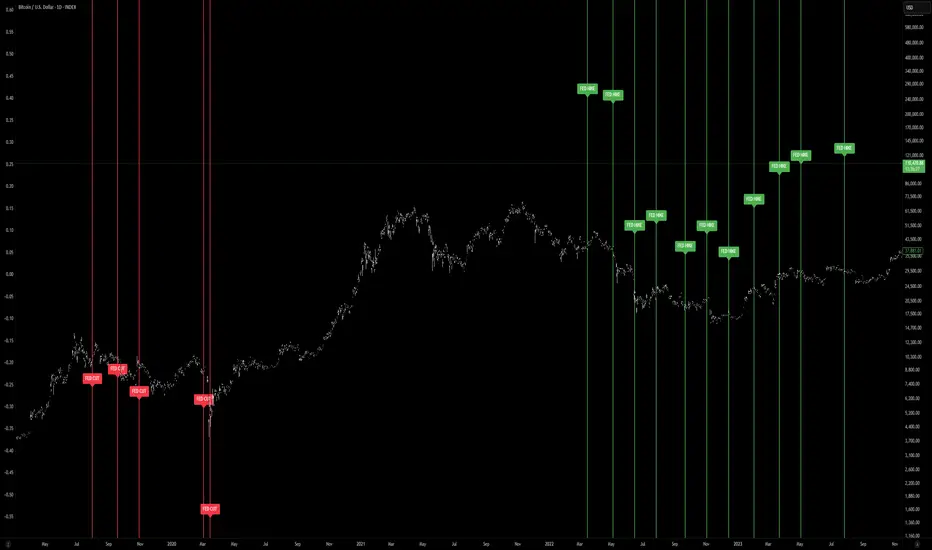
FED Rate Decisions (Cuts & Hikes)This indicator highlights key moments in U.S. monetary policy by plotting vertical lines on the chart for Federal Reserve interest rate decisions.
Features:
Rate Cuts (red): Marks dates when the Fed reduced interest rates.
Rate Hikes (green): Marks dates when the Fed increased interest rates.
Configurable view: Choose between showing all historical decisions or only those from 2019 onwards.
Labels: Each event is tagged with “FED CUT” or “FED HIKE” above or below the bar (adjustable).
Alerts: You can set TradingView alerts to be notified when the chart reaches a Fed decision day.
🔧 Inputs:
Show decisions: Switch between All or 2019+ events.
Show rate cuts / hikes: Toggle visibility separately.
Colors: Customize line and label colors.
Label position: Place labels above or below the bar.
📈 Usage:
This tool helps traders and investors visualize how Fed policy shifts align with market movements. Rate cuts often signal economic easing, while hikes suggest tightening monetary policy. By overlaying these events on price charts, you can analyze historical reactions and prepare for similar scenarios.
JL - Market HeatmapThis indicator plots a static table on your chart that displays any tickers you want and their % change on the day so far.
It updates in real time, changes color as it updates, and has several custom functions available for you:
1. Plot up to 12 tickers of your choice
2. Choose a layout with 1-4 rows
3. Display % Change or Not
4. Choose your font size (Tiny, Small, Normal, Large)
5. Up/Down Cell Colors (% change dependent)
6. Up/Down Text Colors (high contrast to your color choices)
The purpose of the indicator is to quickly measure a broad basket of market instruments to paint a more context-rich perspective of the chart you are looking at.
I hope this indicator can help you (and me) accomplish this task in a simple, clean, and seamless manner.
Thanks and enjoy - Jack
