Signal

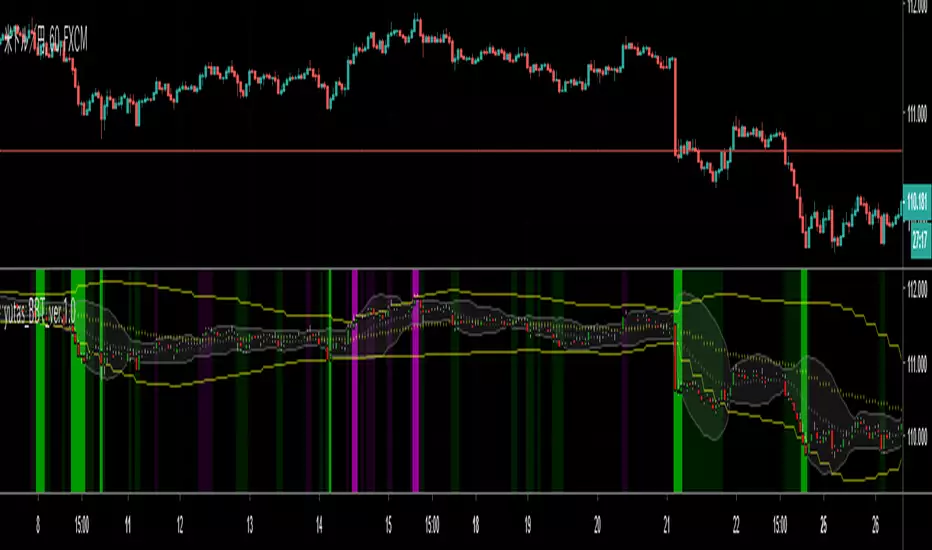
yutas_Bollinger Band Touchver.1.0
Bollinger Bands ±2(figures changeable)σ × 2(MTF)
Show / hide candlesticks.
BB touch sign display / non-display.
BB①② composite sign display / non-display.
Alert function.
-----------------------------------------------------------------
ボリンジャーバンド ±2(数値の変更可)σ × 2(マルチタイムフレーム)
ローソク足の表示・非表示。
BBタッチサイン表示・非表示。
BB①②の複合サイン表示・非表示。
アラート機能。
-----------------------------------------------------------------
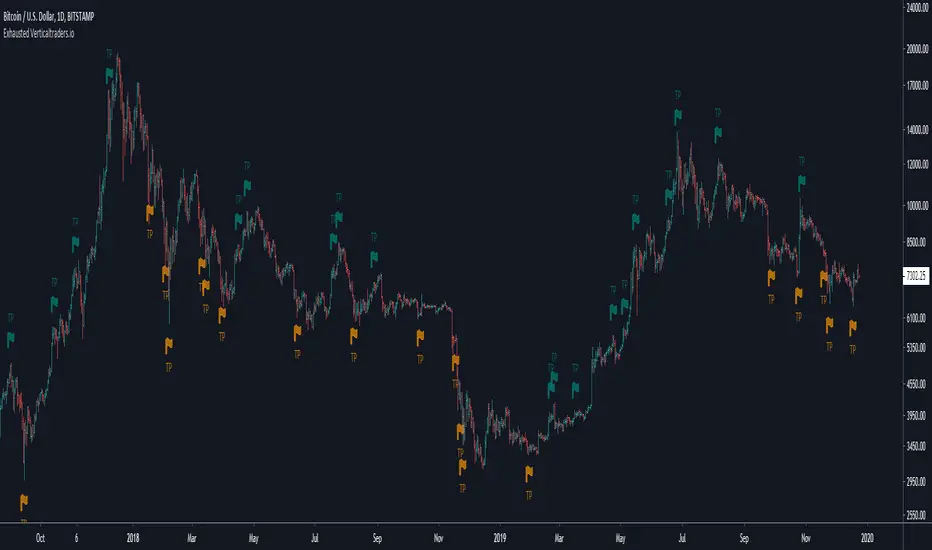
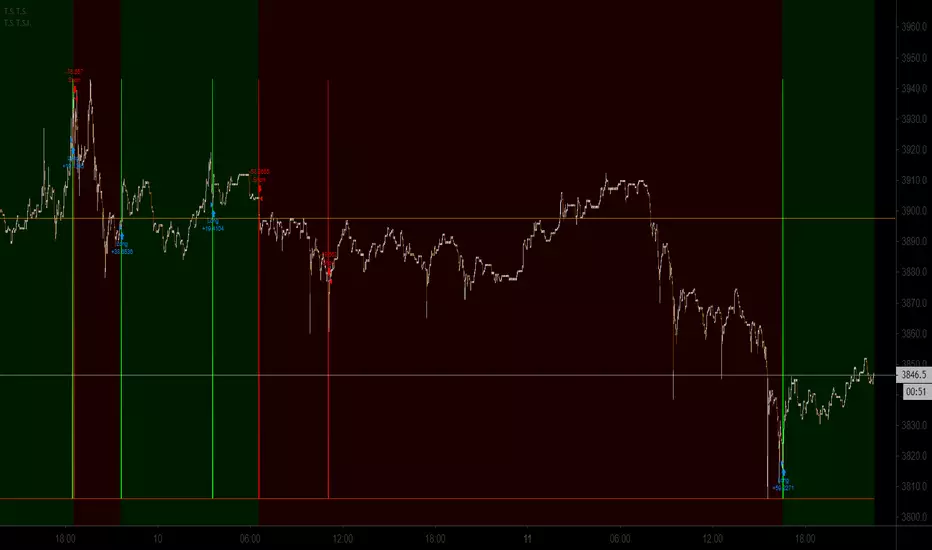
Exhausted-This algorithm takes in consideration Media averages, Volatility Movements, trend direction and other Mathematical Properties.
-After adding this signal on TradingView, you will get notified when it is suggested to protect profit or exits long and short positions.
-Meaning of colors:
Dark Red: suggestion protect profits Long
Red: suggestion exit Long
Dark green: suggestion protect profits Short
Green: suggestion exit Short
-You can activate notification alerts for any of the conditions.
-Works in any timeframe or market like Forex, Crypto, Commodities even Stocks.
-Recommended manual trading.
Do you need an Script or an expert adviser for Forex, contact our coding service!
Get this indicator today! contact us.
Adv Scalper-This algorithm takes in consideration Media averages, Volatility Movements, trend direction and other Mathematical Properties.
-After adding this signal on TradingView, you will get notified every of potential long and short points triggered by the indicator.
-This signal alerts you anytime bars form a bullish or bearish pattern and price start to move in the suggested direction.
- It is recommended to use in 15-30 min timeframes in forex , but It works in any timeframe or market like Forex, Crypto, Commodities even Stocks.
-Recommended manual trading.
Do you need an Script or an expert adviser for Forex, contact our coding service!
Get this indicator today! contact us.

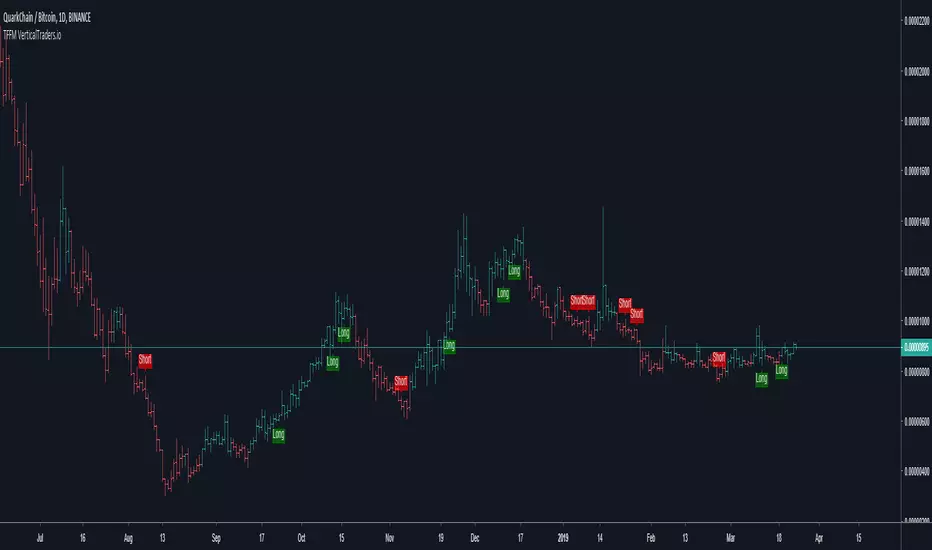
TFFM-This algorithm takes in consideration Media averages, Volatility Movements, trend direction and other Mathematical Properties.
-After adding this signal on TradingView, you will get notified every of potential long and short points triggered by the indicator.
-This signal alerts you anytime bars form a bullish or bearish pattern and price start to move in the suggested direction.
-It works in any time frame or market like Forex, Crypto, Commodities even Stocks.
-Recommended for bots or manual trading.
Do you need an Script or an expert adviser for Forex, contact our coding service:
Get this indicator today! contact us
Premium 3-This algorithm takes in consideration Media averages, Volatility Movements and other Mathematical Properties.
-Allows you to find divergences and price trends in a simple way
-After adding this signal on TradingView, you will see potential long and short according to the colors of the candlesticks.
-It works in any time frame or market like Forex, Crypto, Commodities even Stocks.
Bullish Strength
Olive: weak
Dark green: medium
Light green: strong
Lime: very strong
Bearish strength
Fuchsia: weak
Maron: medium
Red: strong
Intense red: very strong
Do you need an Script or an expert adviser for Forex, contact our coding service
Get this indicator today! contact us

Entry Bars -This algorithm takes in consideration Media averages, Volatility Movements and other Mathematical Properties.
-After adding this signal on TradingView, you will get notified every of potential long and short points triggered by the indicator.
-This signal alerts you anytime bars form a bullish or bearish pattern and price start to move in the suggested direction.
-It works in any time frame or market like Forex, Crypto, Commodities even Stocks.
-Recommended for bots or manual trading.
Do you need an Script or an expert adviser for Forex, contact our coding service
Get this indicator today! contact us

Premium 2-This algorithm takes in consideration Media averages, Volatility Movements, trend direction and other Mathematical Properties.
-After adding this signal on TradingView, you will get notified every of potential long and short points triggered by the indicator.
-This signal alerts you anytime bars form a bullish or bearish pattern and price start to move in the suggested direction.
-It works in any time frame or market like Forex, Crypto, Commodities even Stocks.
-Recommended for bots or manual trading.
Do you need an Script or an expert adviser for Forex, contact our coding service: coding@verticaltraders.io
Get this indicator today! contact us

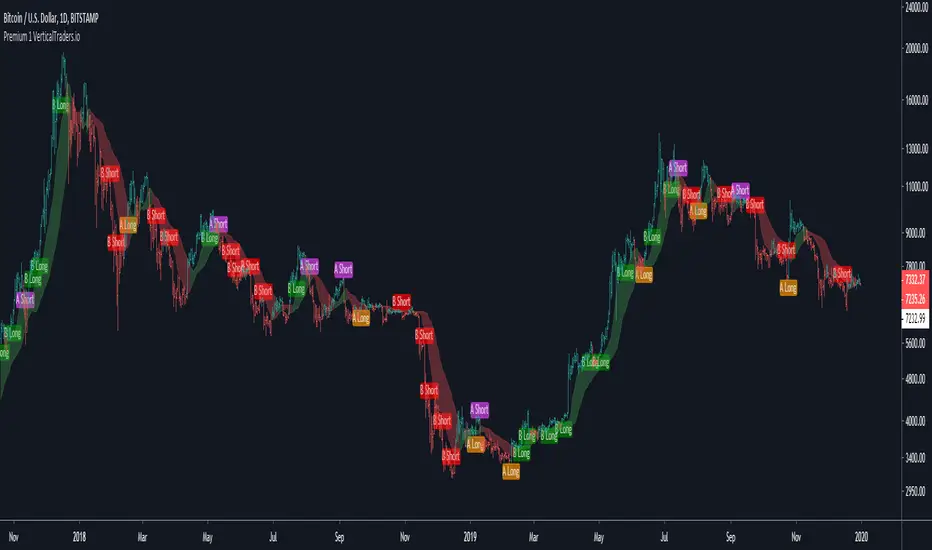
Premium 1-This algorithm takes in consideration Media averages, Volatility Movements and other Mathematical Properties.
-After adding this signal on TradingView, you will get notified every of potential long and short points triggered by the indicator.
-This signal alerts you anytime bars form a bullish or bearish pattern and price start to move in the suggested direction.
-It works in any time frame or market like Forex, Crypto, Commodities even Stocks.
-Recommended for bots or manual trading.
Do you need an Script or an expert adviser for Forex, contact our coding service:
Get this indicator today! contact us
Trader Set - Trading Signal IndicatorThe indicator version of my trading signal strategy, again DON'T EVEN ASK FOR GETTING ACCESS. This is pine version 3, no repainting and enhanced with personally trained neural network (not the one you find around in trading view, that neural network has serious issues and no, i'm not talking about repainting. the neural's network itself is not standard and full of issues).
Why did I make an indicator version? to better understand what is going on when tweaking the numbers and different inputs of my strategy system.
Also, that strategy, uses price action, side by side a personally trained neural network (dedicated for btc usd) and beside all of them, i used one of my original tools that i published during last few months for getting iron grasp on the best signals.
The result?
Leverage 10 on Bitmex, one week of trading, 100+ GAIN !!!!!!
This is a money making machine that i won't share on trading view, I have other plans for this and you will be informed when the time comes.
MTA-Traling StopIntroduction
Based on my previous indicator , this indicator plot a trailing stop using classic conditions.
Using The Indicator
Like any trailing stop when price is higher than the trailing stop this imply a buy signals, when price is lower than the trailing stop this imply a sell signal. It is possible to use decimals instead of integers for length as shown here :
length = 14.7
The indicator tend to react faster to price movements when a trend has been really long, this methodology is similar to the one used by the parabolic sar.
Downsides
Lack of robustness with the length parameter, the behaviour of the trailing stop can be hard to predict. There is a real need for control.
Conclusion
The indicator can be adaptive, even if it already is in a certain way, by changing the alpha variable at the start considering that 0 < alpha < 1. Its not recommended to use it right now except for testing/coding purpose.
It is clear that i'm not enthusiast when it come to this script, there is a real lack of accuracy, i still hope it can be of use.

Candlestick Signals StrategyThis strategy allows you to pick from 9 different candlestick patterns, and test them against historical data from your chart. You can get a good idea what patterns work best for each chart by turning each pattern on and off in the settings.

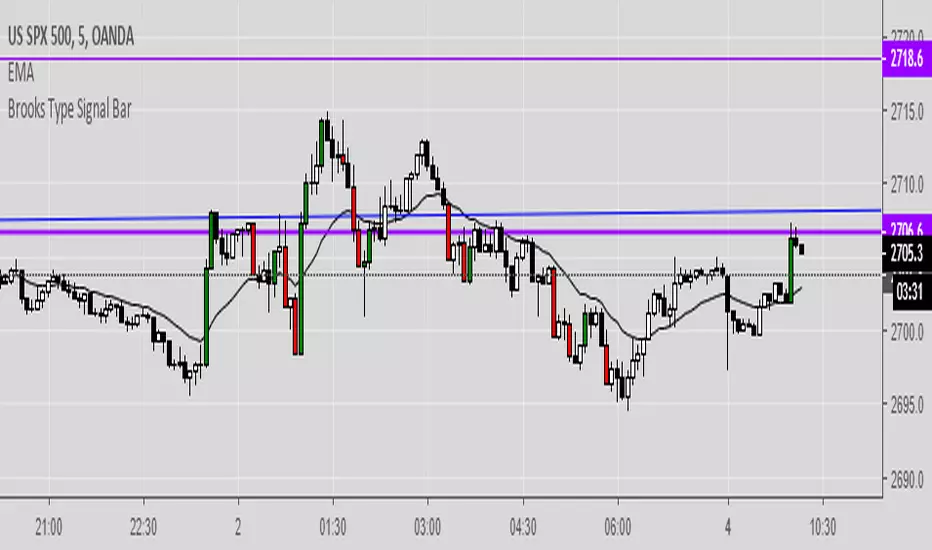
Brooks Type Signal BarIndicates "strong bars" similar to how Al Brooks defines them in his book-- these don't necessarily trigger entries but can be points of interest.
2-3 points as a signal bar size seems to work well, depending upon volatility.
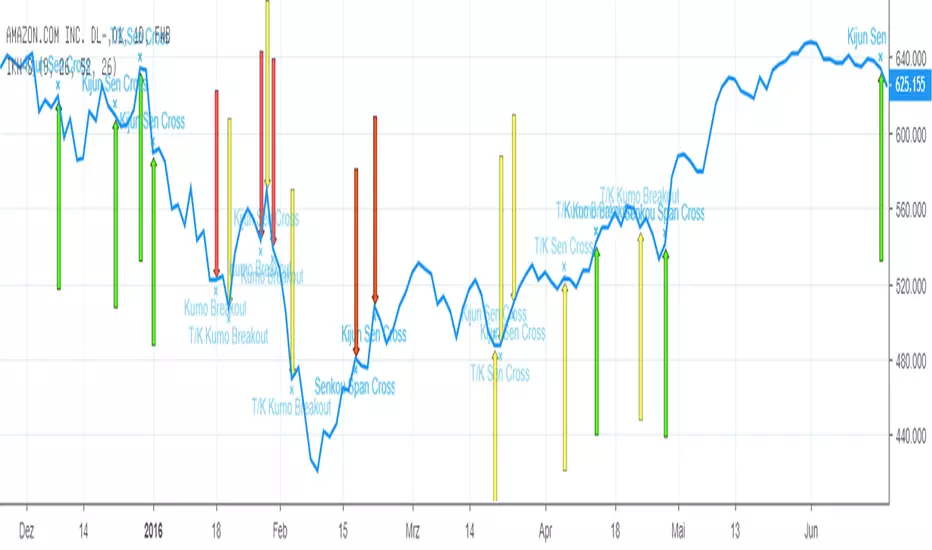
Ichimoku Kincho Hyo - Buy/Sell SignalsThe following (neutral/strong) signals are implemented:
Tenkan Sen/ Kijun Sen Komu Breakout
Tenkan Sen/ Kijun Sen Cross
Kijun Sen Cross
Kumo Breakout
Senkou Span Cross
ProfitTrailer Example TradingView Signals [v2019-01-31]ProfitTrailer Example TradingView Signal
This script provides an example of a TradingView Signal for use with ProfitTrailer's
new SIGNALS functionality and it's new TradingView integration capability.
This signals script implements a simple Moving Average Cross strategy
that works on any chart timeframe.
It allows you to pick the Price source i.e. Open, Close (default), etc.
You are able to choose between EMA (default) or SMA moving average
calculations.
You can define the fast and slow period lengths for use within the
moving average calculations.
If you get some value out of this indicator please consider making
a small donation to my favourite charity the Save the Childrens Fund.
Every donation will make a difference to the lives of children.
All donations over $2 are tax deductable. You can donate here:
savethechildrenfundraising.org.au
Copyright (c) 2019, Grant Cause aka CryptoCoyns

Volume ImpactVolume Impact (The area)
Average Volume (The thick line, xTrigger)
Volume Impact = Volume Chance - Average Volume
It provides very reliable buy sell signals. Buy(green) when increasing, sell(red) when decreasing. Volume Impact might drop before the actual price so it has an early warning potential.
Before trend changes volume average diverges from the prices. It moves reverse to the prices.
Also before trend changes, volume impact peaks diverges from price peaks. So you know a big drop is coming.
Klinger Volume Oscillator inspired this indicator... This data is there but it is more difficult to interpret.
In summary, you can foresee trend changes.
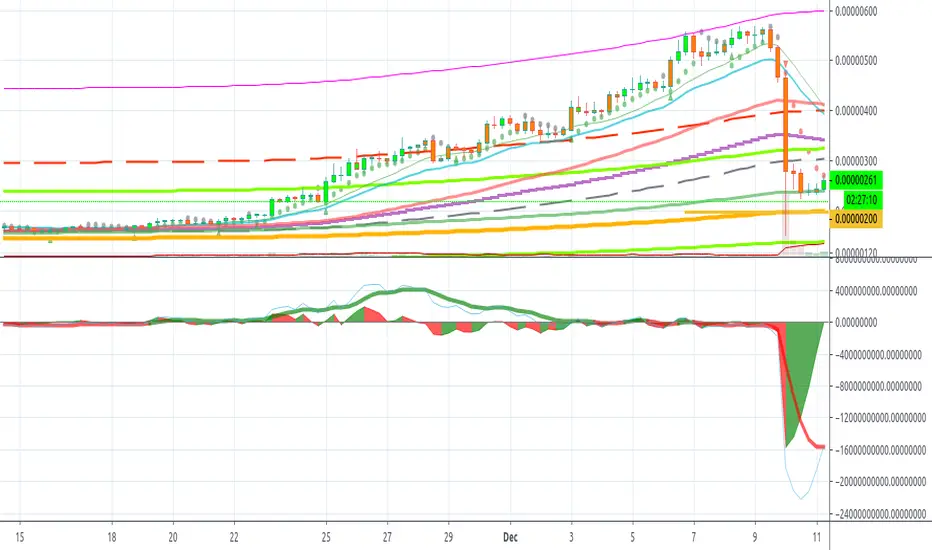
GVT pump detectoruse this to get in on gvt pumps (1h charts).
3 indicators to look for:
1) the price has closed the 1h chart above the orange 200ma line.
2) the fast blue ema 7 has crossed over the 200ma
3) the price action is above the white mid cap line and in the faint green zone).
how to use:
1) buy when the indicator along the bottom turns green
2) sell when the price goes outside of the top white band (or at latest when it comes and closes back inside) - EW/fib will guide this.
3) set SL at mid band
4) do not enter trade if red along the bottom or if green but the previous steps have passed.

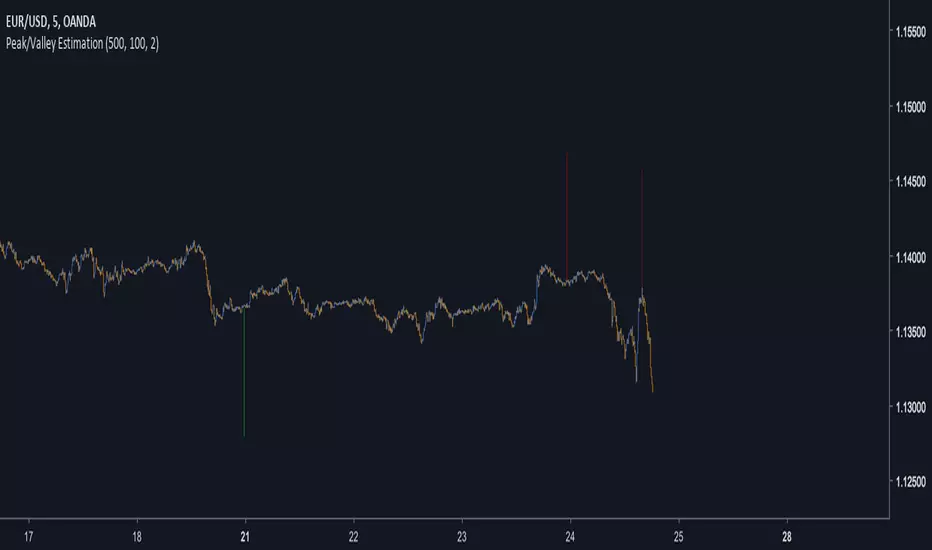
Peak/Valley EstimationEarly Signal
Estimating the Peaks and Valleys or extrema of the price is one of the best way to catch up early movements of a trend. Of course there is no perfect way to do so, if we want a perfect estimation of peaks and valleys then we must use a non causal indicator ( repainting ), if we want a causal indicator ( non repainting ) then we will need to tradeoff accuracy for allowing our indicator to be causal, its always a matter of tradeoff at the end when trying to have a desired effect (smoothness/lag for filters) .Our indicator is causal, it wont repaint but the accuracy will depend on various parameters.
In order to detect peaks and valleys in a certain period we must detrend the price, this mean subtracting it by its moving average. We take the absolute value of this result and we filter it with a local linear regression ( LSMA ) in order to eliminate noise, then we make the assumption that the highest of our result is or a peak or a valley of the price, so we divide our detrended calculation by its highest and we get a scaled result. Lets call this final result the peak index .
Parameters
There are 3 parameters in this indicator, a length parameter who control the period of the highest mentioned above, a smooth parameter who smooth our detrended price, and finally a mod parameter who select the trigger method for estimating a peak/valley.
Here are how mods work :
mod = 1 : when the peak index is equal to 1 and the previous value is not equal to 1 then we have a peak/valley. Its the fastest of the 3 mods but the one with less accuracy.
mod = 2 : when the peak index crossunder 0.8 then we have a peak/valley. This method is more robust but slower than the previous one.
mod = 3 : when the peak index is not equal to 1 and the previous peak index is equal to 1 then we have a peak/valley. Its an average of the precedents mod in term of speed and accuracy.
Lower length values tend to estimate the peak/valley of short periods of time but can also lead to the reverse desired effect ( breakouts signals ). Smoothing is important since it reduce the number of noise in our calculation and therefore help to get better results, its a parameter that should be high, sometimes higher than length if this one is low.
Estimation of medium terms peaks/valleys with length and smooth parameter both period 100 and mod = 3
Estimation peaks in palladium way to early, an example of bad accuracy. Such behaviour can be fixed with a change in the parameters.
Complementarity With Classics Indicators
As i said before its always a matter of tradeoff, here we get faster signals but we loose in accuracy, at the contrary classics indicators often have slower signals but with more accuracy. Mixing both of them can provide additional robustness in a strategy, lets take back our palladium case, using mod 3 could have been better, but its still not optimal, so lets use a classic indicator such as a moving average of period 200, our conditions are :
Long when our peak/valley estimator estimated a valley and the price crossover our moving average.
Short when our peak/valley estimator estimated a peak and the price crossunder our moving average.
here is an exemple of such signal :
We balanced our tradeoff in a way to fix both methods problems, of course its still not a perfect fix but it provide more robustness.
Other Uses
The indicator can also be used only as an order closing indicator, its safer than taking a position based on its estimation. The indicator can also give a use to the peak index used in the calculation as a trend strength indicator.
Values below 0.5 indicate a ranging market while values over 0.5 indicate a trending market.Since its a scaled measure you can use it a smoothing constant in a adaptive filter.
Conclusions
I showed how to estimate peaks and valleys and how to use such information in order to make better decision when using classical indicators, of course at the end nothing is perfect and considering the non stationarity of the markets the parameters efficiency could change drastically.
For any questions/demands feel free to pm me, i would be happy to help you
Rainbow MA10 with Signal Strategy Version by letsplayantsRainbow MA10 with Signal Strategy Version
Just One for Man.

Short Selling BITMEX Alts (15min scalp strategy)So this is a strategy i made for trading BITMEX alts on 15minute timeframe.
Works simply. You get sell signal when it is considered overbought and way too far from its mean -> the moving average. So you short it with that moving average as the target. Sometimes it goes lower, since the sell signal represents resistance area and average represents support and they act accordingly. Might break through, might bounce back to entry. So its safer to exit at support then pray on breakdown, its 15min strategy afterall.
There is no defined stop loss on this strategy. When i trade it i take risk/reward setup and my stop is calculated based on reward from entry to target. Usually its 1R or above that,usually i use price action for that purpose. if you trade it manually you have advantage, since signal gets confirmed on candle close, yet it could appear as soon as candle opens. So if you dont want any additional risks - wait for candle close and short it. If you want to gamble it - enter and average it up as it goes until you meet your risk limit.
Here is how it is inteded to be traded.
This strategy does not account for limit fees on bitmex, so it wouldnt be much practical to entry AND exit with market orders. As you can see in example, simple 1.5% move would lose 1/3 of its reward if you used market entry+exit.
This one works on :
TRX
EOS
LTC
BCH
ADA
All 15 minute timeframes. Plus it showes really good results in spot exachnges too, if you want to use as a tool to exit spot exposure (binance chart, same symbols).
Contact for free trial here or at twitter.com (i post full perfomance on all pairs there)
Also check this strategies performance on BCHH contract on bitmex. Absolute banger.

Oscillator Strategy for Scalping (BITMEX Swaps btc + eth)This is short selling strategy for BITMEX's XBTUSD and ETHUSD swaps scalping.
Made specifically for 3M XBTUSD and 3M-5M ETHUSD timeframe trading.
Not gonna open all the details, but it works mostly on bear divergences and moving averages.
On premium it shows 10000 bars back on 3minute timeframe and over that period(3 weeks aprox) XBTUSD had 28 trades and ETHUSD had 25(+17 on 5M timeframe) trades with that strategy.
How to trade it and setups that i use for manual trading:
1: You can use it to confirm your bias. Sell signal appears + price tries to retake previous resistance = most likely it will fail.
2. Sell signal after wick up suggests that you are likely to get filled at the top.
Your main target should be this moving average. Basically sell signal appears at resistance/near one and moving average represents current line of support. So when you enter short you should be eyeing this MA as your exit/target. Yes, there is a good possibility that support wount hold and this is a bear market we talking about BUT it is 3M bot oriented trading strategy, dont forget about and dont hold for too long to find yourself with price lending on MA and jumping from it.
This strategy does not have a defined stop, rather it suggests you to calculate it based on entry (provided) and target (provided).
Here is what i usually do to calculate my risks. My reward is a move to line of support, my stop is usually 1R, winrate is much higher than 50% so i feel good about it. Entry either at sell signal or at wick. Wicks not always get runned, but they provide incredible r/r setups.
Free trial for 36 hours for this one.

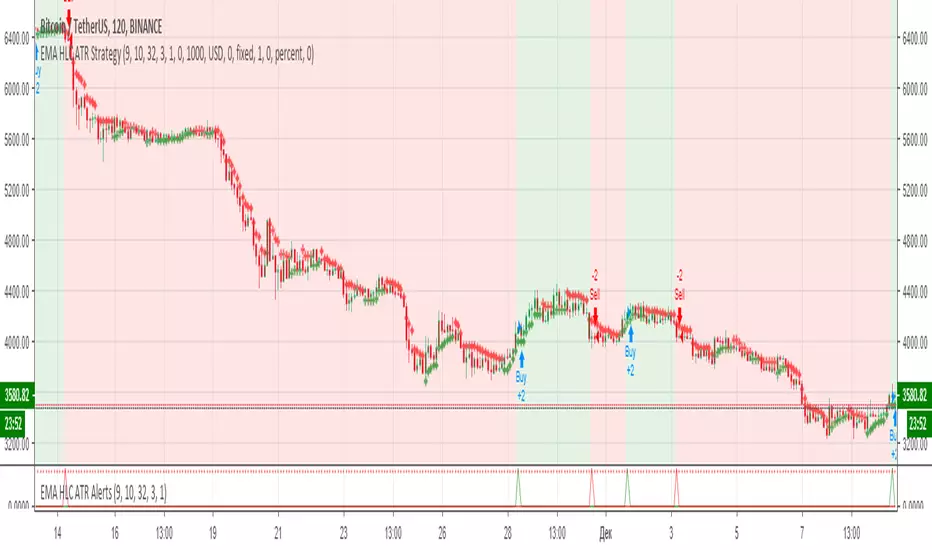
EMA HLC ATR Strategy// Strategy based on EMA HLC ATR Indicators
// Greatest effect on 2H time frame
// Created and based on Binance chart
// Working with comission
// No repaints
pooya ATRthis is modified ATR for signal strength test
with custom ATR in multi time chart
comment your opinion...
