ORDINARY LEAST SQUARES Slope by @XeL_ArjonaORDINARY LEAST SQUARES Slope by @XeL_Arjona
Ver. 1 by Ricardo M Arjona @XeL_Arjona
DISCLAIMER:
The Following indicator/code IS NOT intended to be a formal investment advice or recommendation by the author, nor should be construed as such. Users will be fully responsible by their use regarding their own trading vehicles/assets.
The embedded code and ideas within this work are FREELY AND PUBLICLY available on the Web for NON LUCRATIVE ACTIVITIES and must remain as is.
WHAT'S THIS?
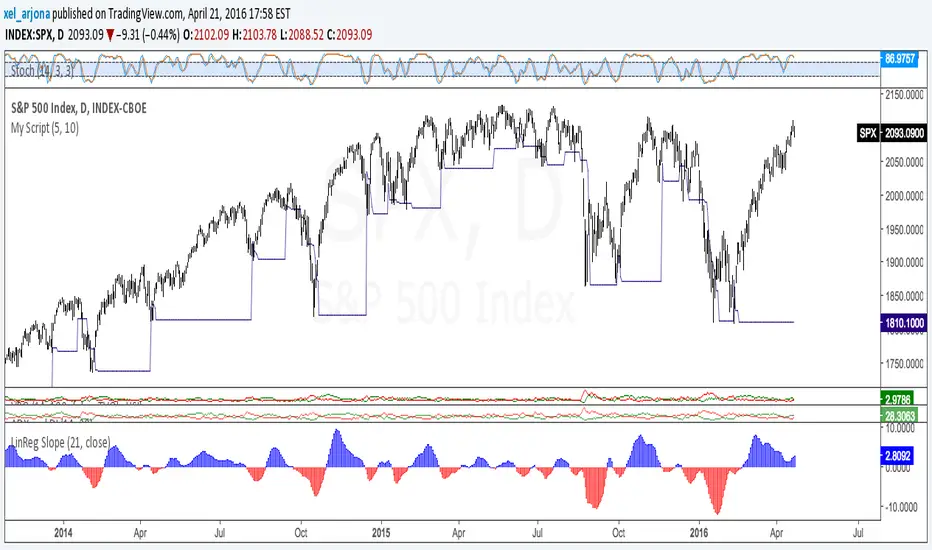
This is a REAL mathematically approach of an ORDINARY LEAST SQUARES LINE FITTING SLOPE as TradingView currently don't have a native one embedded, neither as a pine function. Other "Sope" indicators from this linear regression model I found on public library are currently based on "momentum" rather tan slope.
Any modifications or additions are quite welcome!
Cheers!
@XeL_Arjona
Slope
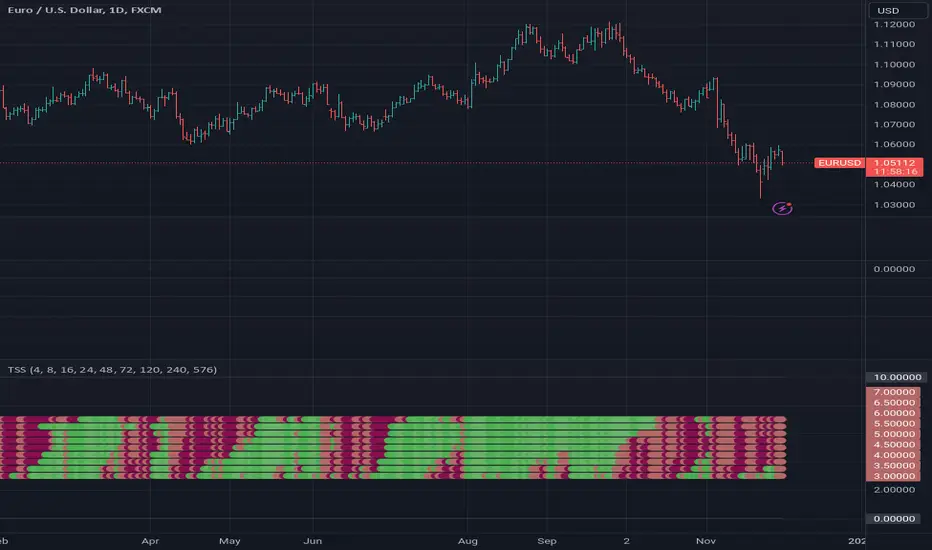
[RS]Trend Slope Signal - 8bitMoving average slope and momentum Analysis, dark color its speeding up, light color slowing
Linear Regression Slope - Version 2Version 2 - Linear Regression Slope. This version will have more freedom on picking your own length for all the Inputs.
One of the main reason I changed it is because, Slope calculation on transition period was not being computed properly. Because the Version 1, looks back the length assigned, and compute the slope based on two candle readings, could be 10 days apart or 50. That was misleading.
Therefore, I changed it to plot daily slope and Smooth it with an EMA.
Linear Regression Curve -
List of All my Indicators - www.tradingview.com
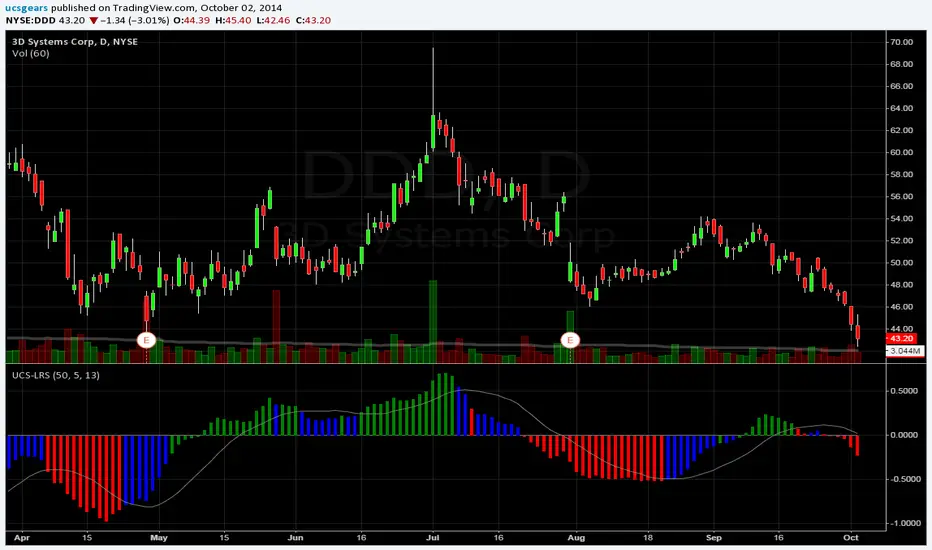
UCSgears_Linear Regression CurveThe Linear Regression Slope is based on the Curve.
List of All my Indicators - www.tradingview.com

Linear Regression SlopeCorrected Version, for
VERSION - 2 () updated for Custom Length, and fixed some formula glitches.

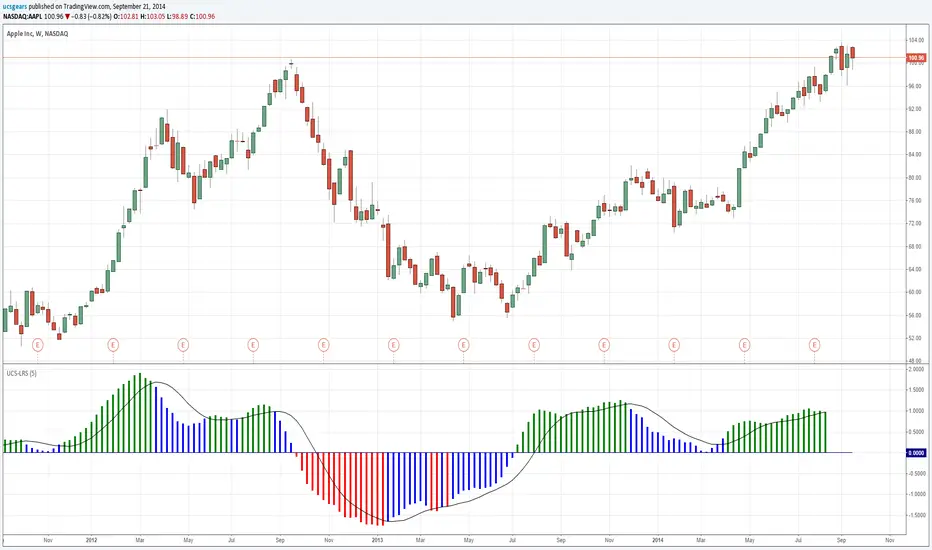
UCSgears_Linear Regression SlopeThis is version 1 of the Linear Regression Slope. In ideal world the Linear regression slope values will remain same for any time period length. because the equation is y = mx+b, where m is the slope. All I did here is m = y/x
The Main Purpose of this indicator is to see, if the Trend is accelerating or decelerating.
The first Blue bar will caution when a strong trend is losing strength. I will leave the rest for you to explore.
I picked AAPL again, because it does have both up and down trend, in the recent time.
Mistake in the code
Corrected Version -