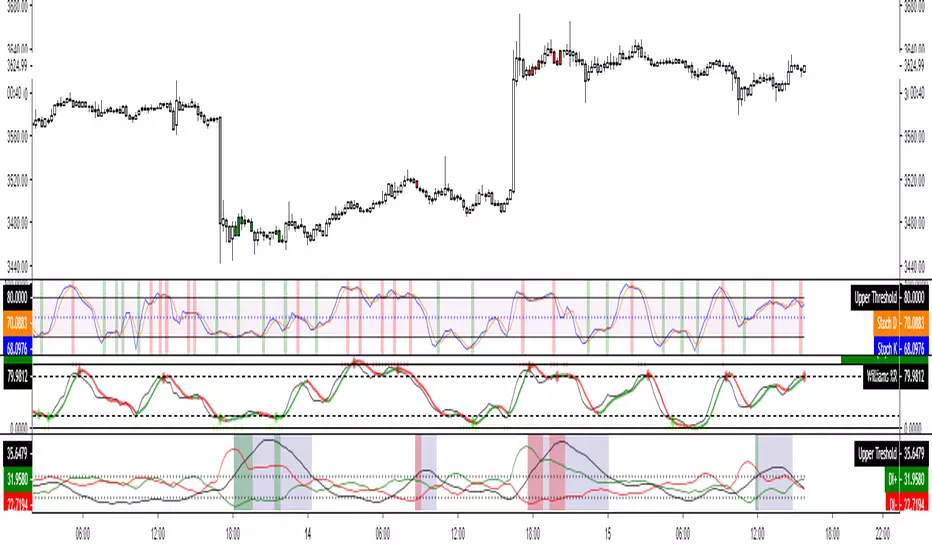
(C)RSI, (Ehler's) Stoch, (Ehler's) SRSIA collection of the following indicators:
*Connor's RSI
*RSI
*Stoch
*Stoch by Ehler
*Stoch RSI
*Stoch RSI by Ehler
The last four have long and short conditions and there are plenty of options to change the indicators to the ticker and timeframe.
مؤشر الاستوكاستك
AJCrows RSI and Stochastic RSIBoth RSI and Stochastic RSI on the same indicator.
Also option to use different resolution (time frame).


Super MFI&STOCH StrategyThe strategy speaks for itself. With it you would have shorted on bitmex with very low average and still be in profit.
Best on the 6hr, 3hr, 2hr, 1hr.

FM RSI Vs StochEasy to use RSI and Stoch
Setting Menu has an option to toggle the RSI and Stoch ON and OFF for your own preference.
Great for reducing clutter when comparing oscillators, while giving the ease of use to just click the toggle option instead of having to find and reset your indicator settings.
Colour schemes adjustable in Settings Menu for personal taste.
Stochastic Bollinger Strategy (Wicks)See 'Stochastic Bollinger Strategy' for details on how this works.
tips/donations are always appreciated venmo @rick-munoz

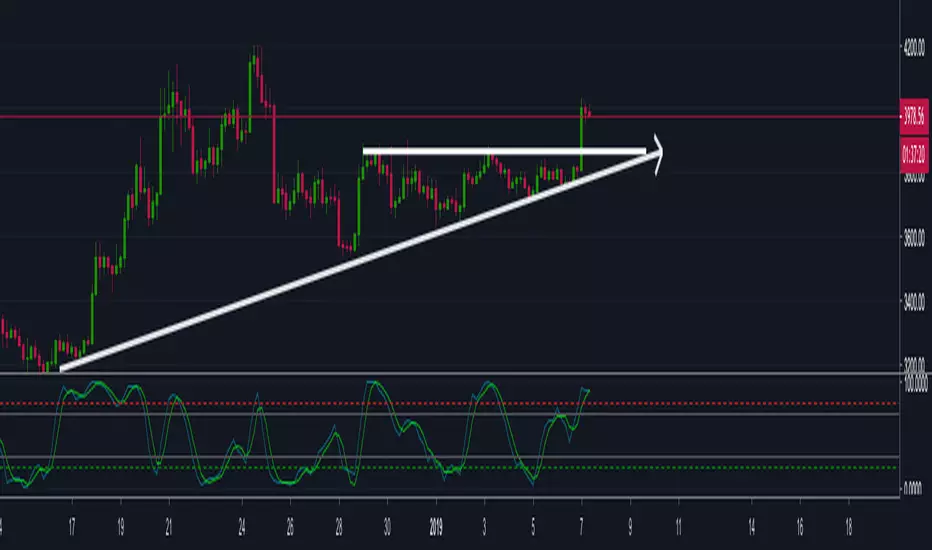
Stochastic RSIThis is a standard stochastic rsi, but the rsi passed through a momentum formula before given to stochastic, also, unlike standard stochastic rsi, it has different lookup length for low and high of rsi.
The result is almost identical to stochastic but when stochastic hits top and bottom levels and gets locked because of clamping, this version will behave properly.
The source is hidden but this script has global access.
Take note that this is not a script that I would use in my own system but some of my friends were looking for such script.
Also, it's worth mentioning that the range of this script was changed from standard 0 to 100, and it's -100 to 100.
There's still a chance for getting locked on top and bottom specially in parabolic moves but that is the nature of RSI and also stochastic and without tweaking the standard formula drastically, it won't go away and this is exactly why i wouldn't put this in my own methodology.


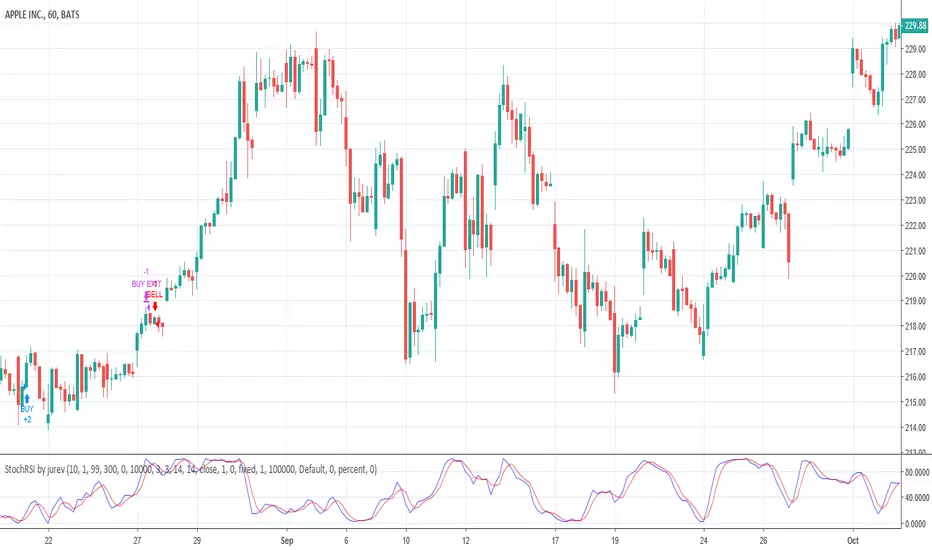
StochRSI Strategy by jurevSimple strategy on Stochastic RSI, opens buy when K is undersold, and buys when K is overbought. You can experiment with SL and TP points to optimize profit.
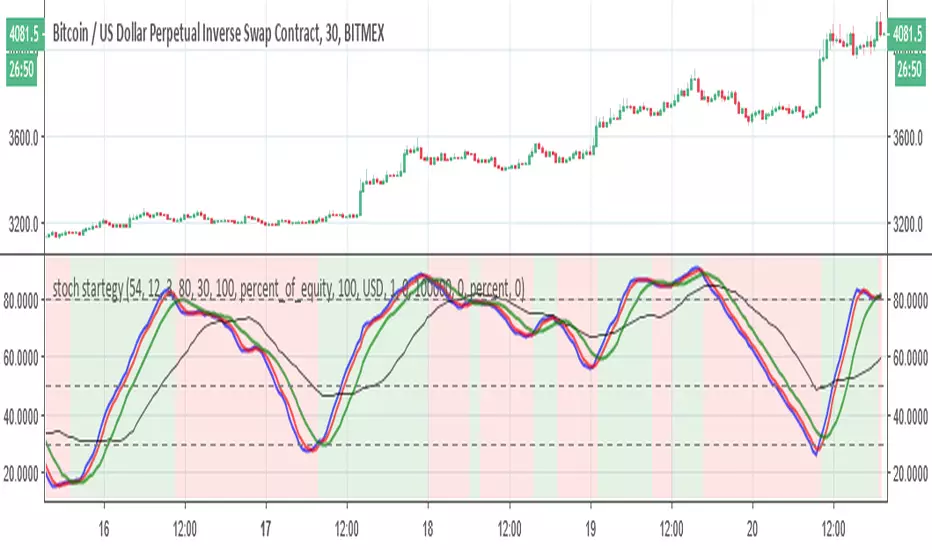
stoch startegyStoch strategy that try to buy in uptrend and to sell in low trend
the bearish and bullish zones are based on regular K stoch over MTF D (3X or timeX3) and vice versa .
The buy and sell rule based on conditions
2- when mtf stochastic cross above 50 and current is rising, buy
3- when mtf stochastic cross bellow 50 and current isfalling, sell
the main script was written by
03.freeman
I just change some settings to improve it
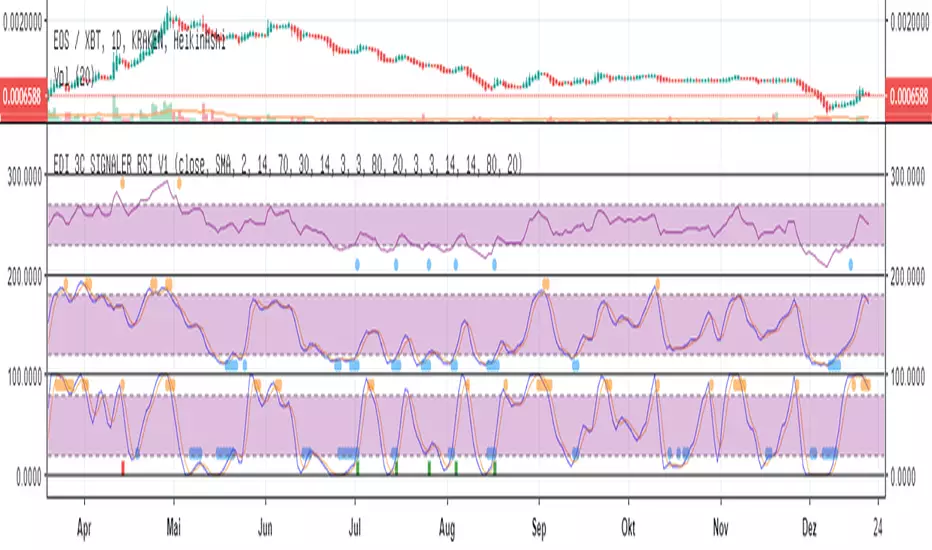
Eds Bot Signaler on Basis of RSI Stoch StochRSIEDS AWESOME BOT SIGNALER
Specially for use with e.g. 3commas or autoview
But can also be used just in normal manual (visual) mode
This Script is very early Beta. Works for visual manual use....
and also for 3Commas Bot as "Signaler" (how to connect with Bot, see the docu on 3commas).
... but can use as Signaler for any Bot who is able to get Tradingview sms-mails. (e.g. autoview)
It combines RSI, Stoch and Stoch-RSI.
You can choose normal RSI, or " returning RSI " (signals when leaving the sell/buy-zone. much higher profits with this)
You can choose how many of the indicators are needed to "fire".
You can choose if one of the indicators is a "must"
For Stoch & Stoch-RSI you can Choose sma or ema calculations of the moving average.
All the Values speak for themselves, if you are used to technical analyses (stay away in the moment, if you dont know, what rsi, stoch etc is used.
The Signals are also shown in the chart, the single ones, but also the combined which fires the Bot-Signal (shown as green and red column-candle at bottom)
Enjoy !! Free use in the moment.
More detailled Explanation in the future. Just play around!
If you wanna give something back:
BTC: 15buigKjh4JYnuVwcEWiYMpYvP3Lbp4ypL
RSI_EMAx3_Stoch_SushiBased on the RSI + EMAx3 script, I further added the Stochastics to it, to create the all in one indicator for my current style of trading. It's more convenient to have just one indicator, imo, instead of two at the bottom.
Like I mentioned in the RSI_EMAx3 script, the EMAs can be used similar to the "Williams Alligator" and as Support & Resistance for the RSI, or any other way one can utilize them.

EMA Cross Daily timeframe w/ Slo_StoUse it to play both sides of the market... Buy If STO line c/o the 20 and overall trend is up or Short if STO drops below 80 and overall trend is lower. DAILY TIME FRAME!!

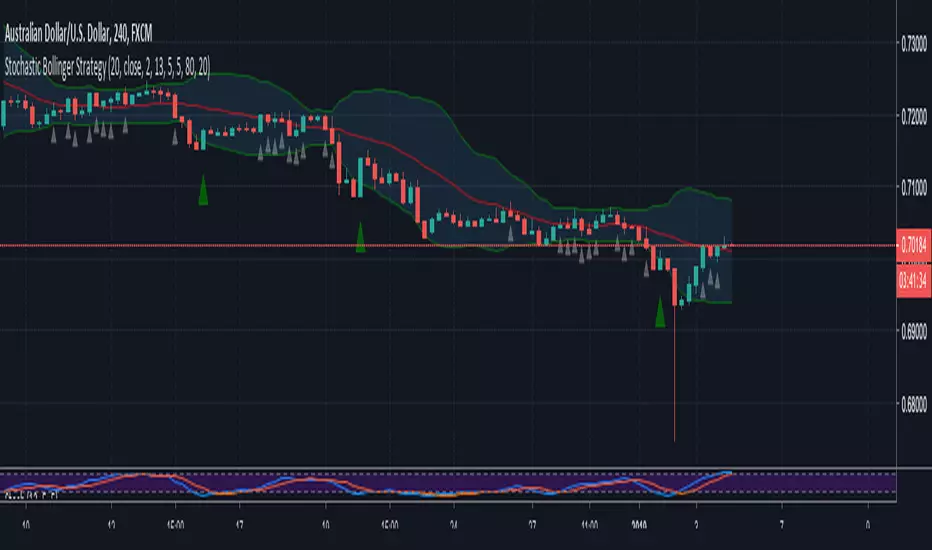
Stochastic Bollinger StrategyBollinger defaults = 20, close, 2
Stochastic defaults = 13, 5, 5
Buy Signal (GREEN triangle):
BULLISH candle formed
Candle OPEN is LESS than LOWER Bollinger Band
Stochastic (K) is LESS than 20
Sell Signal (RED triangle):
BEARISH candle formed
Candle OPEN is GREATER than UPPER Bollinger Band
Stochastic (K) is GREATER than 80
Read more about the strategy and where to set buy stops and sell stops here: swing-trading-strategies.com
CS Basic Scripts - Stochastic Special (Strategy)This Stochastic Special Strategy features inputs for:
- Custom Backtesting Date Range
- Long and Short Strategy Discinctions
- Utilize SMI, RSI, Martingale, and Body-Filter Strategy
- Adjust the SMI Percent Lengths and Limit
- Automate with the Autoview Trading Bot
Strategy script may be tested by favoriting and adding to any chart.
Study script is available for automated trading at www.cryptoscores.org


[Delphi] Power Tools OscillatorsFEATURES
- RSI
- Stochastic
//******************************************************************************
// Power Tools Oscillators
// Inner Version 1.0 04/12/2018
// Developer: iDelphi
//------------------------------------------------------------------------------
// 04/12/2018 Added RSI
// 04/12/2018 Added Stochastic
//******************************************************************************

Color CandlesUses 6 most common indicators to color candles when they give buy/sell signals.
Use line view to see candle colors.
Purple = 6 buy signals
Teal = 5 buy signals
Navy = 4 buy signals
Lime = 3 buy signals
Green = 2 buy signals
Pale Green = 1 Buy signal
White = neutral
Gray = 1 sell signal
Yellow = 2 sell signals
Orange = 3 sell signals
Red = 4 sell signals
Firebrick = 5 sell signals
Black = 6 sell signals
Parabolic SAR calculated as .02, .02, .2. Traditional Buy/Sell. Green/Red Dots.
Bollinger Band calculated as 20, 1. Buy/Sell when above or below band. Aqua filled band.
MACD calculated with emas 12, 26, 9. Traditional MACD/Signal cross Buy/Sell. Filled Blue/Orange band.
RSI length 14. Traditional Buy/Sell below 30 and above 70. Green/Yellow/Red line below price.
ADX/DI len 14. Traditional crossover Buy/Sell. Filled Lime/Green above price.
Stochastic 14/3/3. Traditional 20/80 Buy/Sell. Filled teal/orange above price.

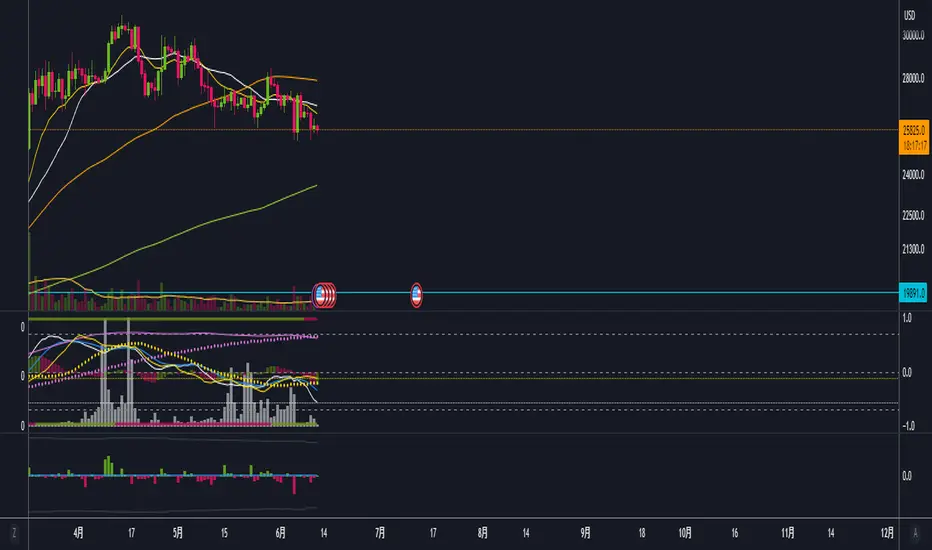
MBY_BTC_Long&ShortThis indicator based on 15Min Bitfinex BTC chart.
Can help you watching short/long position on your sheet.
이 인디케이터는 비트파이넥스 15분 봉 비트코인 차트가 기본이 됩니다.
수정하실 수 없습니다.
이 지표는 비트코인 롱/숏 포지션을 사용자의 차트에 표시해줍니다.
감사합니다.
사용을 희망하는 분은 관심과 좋아요 부탁드리겠습니다.

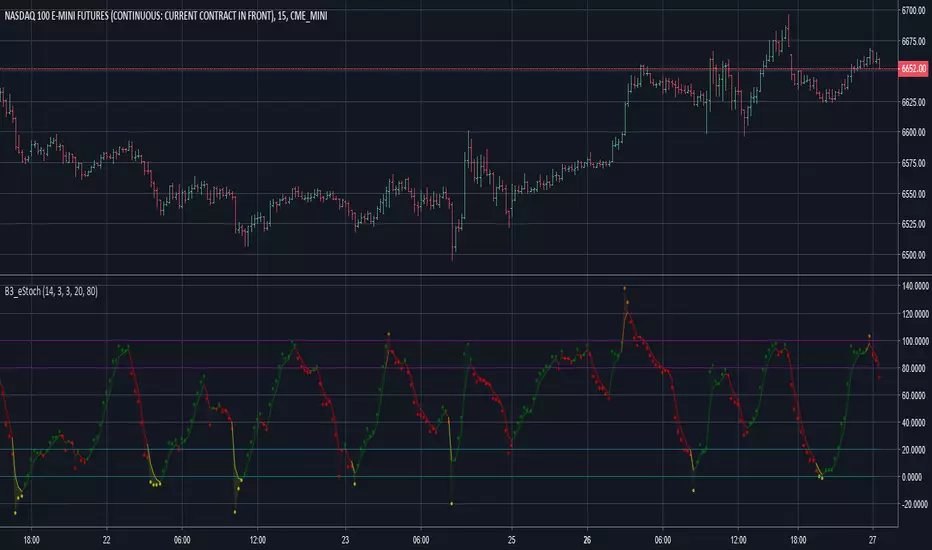
B3 Extended StochasticB3 Extended Stochastic ~ This is my personal take on the standard "Stochastic Full" study that most platforms natively carry. However, this is slightly more powerful. The simple difference is that in a normal stochastic indicator, 0 and 100 are the minimum and maximum values. Here there is no min/max, hence the title "Extended Stochastic." When extended beyond 0 or 100, this tells you if you're expanding range (breaking out), and often the stochastic turns that are beyond the 0 or 100 lines tend to be more juicy than normal stochastic overage turns. There is still the classic 20/80 over-lines, and they still carry their full validity in this script. Think of extended range as additional information and not a remaking of the indicator. You will find it quite successful in oscillation, but as always, oscillators struggle in long running trends.
~B3
Check out my Tview page for more scripts. :)
www.tradingview.com

Anwar - Stoch vs RSIStochastic vs RSI:
Green is upper than red : long
Red is upper than green : short
