Vera Support Resistance FinderVera Support & Resistance Zones is an educational technical analysis tool that automatically detects potential support and resistance levels based on pivot highs and lows.
Key Features:
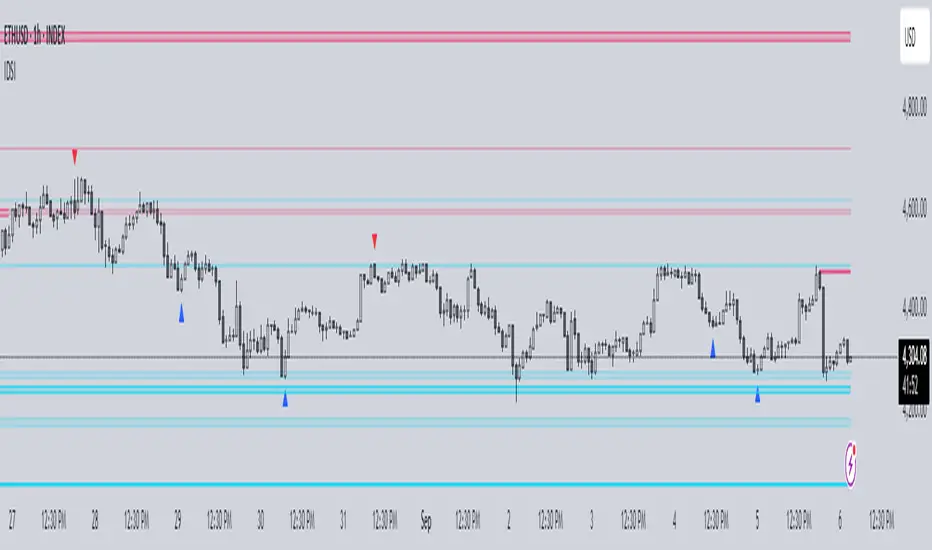
Identifies support and resistance zones using pivot structures.
Marks previously broken levels and displays how many times each level has been broken. (This feature can be toggled on or off.)
Shows the distance from current price to each level with dynamic labels.
Groups nearby levels within a user-defined percentage range and shows how many points are merged into each zone. (This percentage is adjustable and the feature can be enabled/disabled.)
Optimization is possible through adjustable depth and level count parameters.
Each timeframe and each chart may require different settings. It’s recommended to adjust the depth, point count, and percentage settings depending on the structure of the asset and timeframe being analyzed.
Color Coding:
Green: Support
Red: Resistance
Navy Blue: Levels acting as both support and resistance
Important Note:
This indicator is developed for educational and visual assistance purposes only.
While it helps identify price reaction zones, manual drawing and validation are strongly recommended.
Since it works based on a defined algorithm, it may not capture critical levels as precisely as the human eye and experience can.
— Developer: C. İnanç ÖZYALIM | Dedicated to Vera 💜
مؤشر Pine Script®