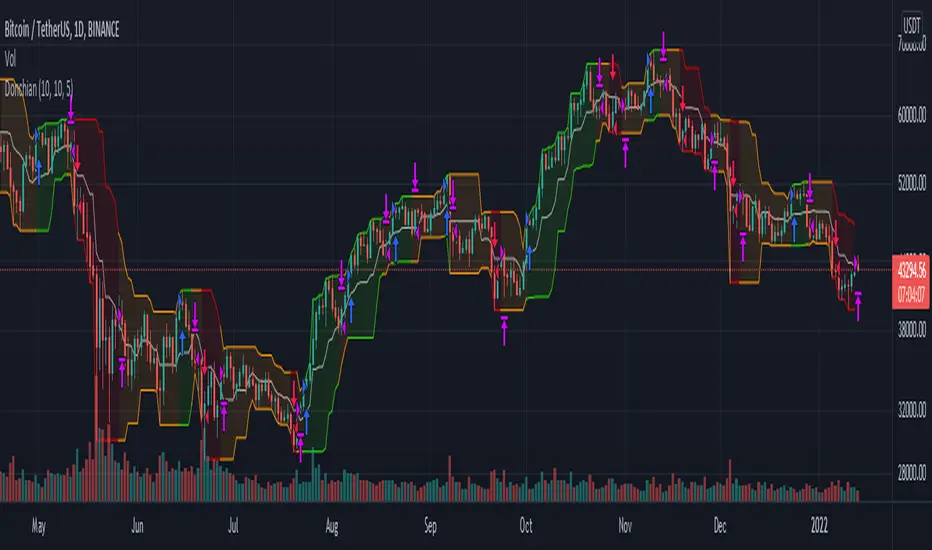
Donchian Channel Strategy IdeaThis strategy idea is a variation of the "Donchian Channel" trading strategy. It is built with a highest-high band, a lowest-low band, and a baseline which is average the highest-high and the lowest-low bands. This strategy is very useful in trending instruments on 1W and 1D timeframes. This is the implementation used in the QuantCT app.
You can set the operation mode to be Long/Short or long-only.
You also can set a fixed stop-loss or ignore it so that the strategy acts solely based on entry and exit signals.
Trade Idea
When the close price breaks up the previous highest-high, it is a long signal, the market is considered rising (bullish), and the plotted indicator becomes green. Long positions are held until the close price crosses under the baseline.
When the close price breaks down the previous lowest-low, it is a short signal, the market is considered falling (bearish), and the plotted indicator becomes red. Short positions are held until the close price crosses above the baseline.
Otherwise, if we have no position in the market, the market is considered ranging, and the plotted indicator becomes orange.
Entry/Exit rules
Enter LONG if the close price breaks up the previous highest-high (i.e. when the plotted indicator becomes green).
Exit LONG if the close price crosses under the baseline (i.e. when the plotted indicator becomes orange).
Enter SHORT if the close price breaks down the previous lowest-low (i.e. when the plotted indicator becomes red).
Exit SHORT if the close price crosses above the baseline (i.e. when the plotted indicator becomes orange).
CAUTION
It's just a bare trading idea - a profitable one. However, you can enhance this idea and turn it into a full trading strategy with enhanced risk/money management and optimizing it, and you ABSOLUTELY should do this!
DON'T insist on using Long/Short mode on all instruments! This strategy performs much better in Long-Only mode on many (NOT All) trending instruments (Like BTC, ETH, etc.).
Trendfollowing
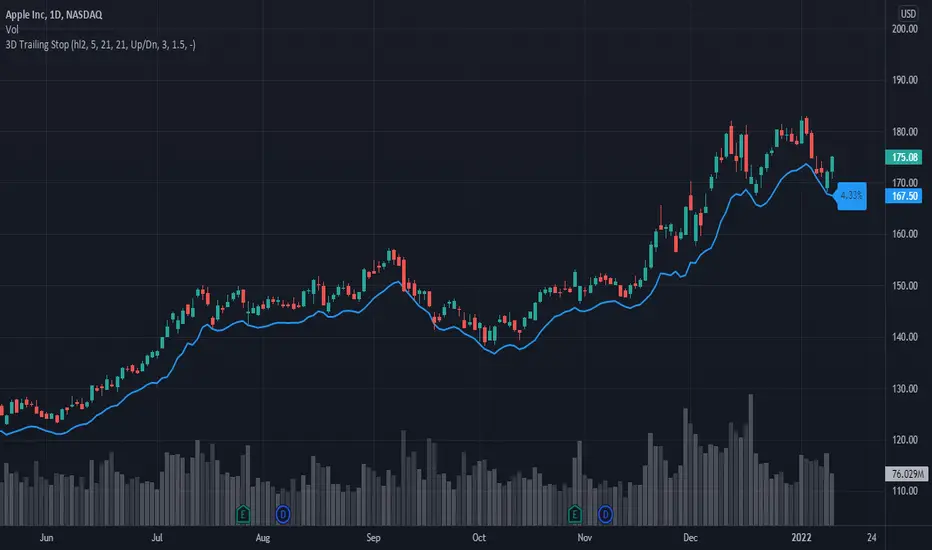
3D Trailing Stop3D Trailing Stop is an indicator designed to keep you in trend trades and let you know when it may be a good time to exit. It's calculation is based on the Trend, Volatility and Volume pattern of the instrument. Instead of most trailing stops which are based on 1 measurement, it's based on 3 measurements, hence it's name 3D Trailing Stop, which is short for 3-Dimensional.
For example when looking at a long-only trade, the more up days and the more volume on those up days, the wider the trailing stop will be. However when the trend changes, and there's more down days with more volume then the trailing stop will tighten. The idea is to try and keep us in good trends for longer and get out of reversing trends earlier.
The default distance the trailing stop will be from the EMA (5) is always a multiple of 1.5 - 3x the ATR (21) and all of these settings are changeable by the user. To change the trailing stop from the default long trend to short trend change the ATR Offset setting from - to +. If you wish to display both a long and short trailing stop, simply add the indicator again to your chart with the ATR Offset + setting enabled. The indicator also shows how far the trailing stop price is from the last price, expressed as a % on the chart so you can easily see how far away the trailing stop is.
There are a few ways it can be used, for example one may wish to enter on a 50 or 100 bar high/low breakout and use the 3D Trailing Stop as a indicator when to get out of the trade. You could exit once price goes below the trailing stop, or use the previous bar trailing stop value as the level for a quicker exit.
This indicator can be used on any market and any timeframe, for both long and short trades. We have found it to work best on stocks long-only using the daily timeframe as stocks tend to have good up-trends over time. You could also use it on smaller timeframes in conjunction with other indicators and signals to enhance your win rate.
To get access PM or email me to my address shown below.
Enjoy :)
Disclaimer: All my scripts and content are for educational purposes only. I'm not a financial advisor and do not give personal finance advice. Past performance is no guarantee of future performance. Please trade at your own risk.
8X Trend ATR SAR Dingue V58X Trend ATR SAR Dingue V5 - This is the updated version for Pine Script 5.
8x indicator into 1 :
2x ATR indicator - 3x Trend indicator - 3x SAR indicator
Trends are helpful to spot reversal and support resistance, especially on bigger time frames.
This indicator gives you a global view of various trends all at once. You can easily turn them On or Off as to not clog the screen.
Each trend is also color-coded to visualize quickly the position of the price compared to it.
You can customize lengths, adjust line sizes, have the start of a new trend marked with a circle, fill in colors.
'Tool tips' explain other settings and if you have any questions, feel free to ask in the comments below.
Thank you for the feedback and check all my ‘Dingue’ indicators.

Retail Insider Trend Following (HTF ONLY)Before I begin, here is a disclaimer: None of this is financial advice, and I'll recommend you to do your own research or talk to your financial advisor, if you want to use this. And also make sure you understand the risks properly before taking any trades. This particular indicator is a work of experiment, and I am publishing the optimized code. Please leave a comment below if you have any queries.
As per the logic, I am taking the highest point in a particular time window (used the in built ta.highest function) , and the lowest point in a particular time window (used the ta.lowest), and averaged it using the in built function (
RMA(which is the B33 Mean.)
For the offset, I am simply calculating and adding some values (which can also be input by the user.)
and this user input is in percentage.
So if you observe the lines, the Red line in between is the mean, and the Yellow lines are the offsets. (Everything can be changed in settings)
In simple layperson terms, if the price goes above the Red line, it's an uptrend,
and if the price goes below the Red line, it is in a downtrend.
Now I just wanted to keep the offset because I wanted more confirmation before actually entering a trade. (the offset can be changed again, from the settings, and the offset is in percentage)
A lot of times, you will see that the price is kind of going sideways, where, a lot of traders get trapped, as there is no clear trend.
So in order to eliminate that choppy price action and stay out, I'm using this offset. This should probably save a lot of bad trades.
So basically, if the price goes and closes above the higher offset, it will confirm a trend change, and a possible bull market.
Similarly, if the price goes and closes below the lower offset, it will confirm the end of the bull market, or a corrective phase, or a bear market.
A few things to note, however...
If you change the timeframe, you will see that the lines are not shifting/changing that much. This is because, it will consider the highest and the lowest points and average it.
So, basically, if you do the math, you will understand why,... and this logic is purely for a higher timeframe analysis/confirmation.
I'll personally recommend this kind of a setup for swing trading/confirmation on the daily or the 4H charts, mostly for longer timeframes. (If you are on the pro/pro+ or premium, you can try out 6H or 12H timeframes as well)
If you are looking for scalping, setups and indicators, this is not the right one.
If you liked it, don't forget to give a follow :)

ZigZag WavesHello All,
I am here with a new idea and script, " Zigzag Waves ". This indicator creates 3 Zigzags with different lengths, keeps the lengths of each zigzag wave and calculates/draws average waves for each zigzag. optionally it can reset the wave when zigzag direction changes and new highest/lowest found. And optionally it draws Exponential Moving Average(EMA) of the sum of waves. This idea is very new and at the moment there is no optimization for the Zigzag Periods. Maybe we altogether can improve the idea and find the best zigzag periods for different symbols and time frames.
Using the options You can play with the periods, add/remove EMA, set its color and reset the waves on new Highest/Lowest. As far as I see resetting the waves on new Highest/Lowest may bring better results.
if we enable "Reset the waves on new Highest/Lowest":
Using different periods and EMA length:
P.S. if you have ideas to improve this script, drop a comment under the script please.
Enjoy!

ROC PercentileRate Of Change Percentile calculates the current ROC (user defined length) as a percentile rank.
We use 2 separate arrays, one for all positive ROC values and one for all negative values within a defined lookback period. Then the current ROC value is compared to those arrays to find it's percentile ranking.
For example, a ranking of 75 means the ROC is in the 75th percentile of all POSITIVE ROC values over the lookback period.
A ranking of -80 is in the 80th percentile of all NEGATIVE ROC values over the lookback period.
Most ROC scripts use raw ROC values (or smoothed or otherwise altered), or have stochastic formula applied to them, I've not seen one that displays ROC as percentile ranking of previous positive/negative values.
What is the advantage?
Raw ROC data only gives half the picture. What we want to do is compare the ROC to previous ROC values, to give a sense of scale. Raw ROC values don't give you that context and you can only compare visually, usually limited to the number of bars you can see on your screen.
Using a percentile ranking gives us the context of current Rate of Change relative to the previous Rate of Change over a large lookback period, and not just visually but mathematically.
Why not using a long stochastic ROC? The problem with stochastics in general is that an outlier data point can ruin the data for the rest of the lookback period.
For example, imagine a huge outlier 8% ROC. The 2nd largest ROC is 4% and the 3rd largest is 2%, with all other values below this.
In this example, a stochastic ROC would display the 8% outlier as 100, the 4% as 50, the 2% as 25 and all other data would be squeezed down between 0-25.
Additionally, a value of 60 may have vastly different meaning depending on whether the lookback period contains a large outlier or not.
With a percentile ranking, that 8% outlier would still have a value of 100. But the 4% and 2% would be 99 and 98 respectively (this assumes 100 data points in the series, in reality values will usually be decimals).
This effectively flattens the curve and gives a more consistent and dependable experience, allowing you to more accurately assess the relative importance of the current ROC.
The line of circles is set at the 50 and -50 values for quick comparison.
Values > 50 represent ROC greater than 50% of previous positive ROC values.
Values < -50 represent ROC greater than 50% of previous negative ROC values.

Commitment of Traders ~ INDEXESMy intention was to create 1 script for the Commitment of Traders report but I wasn't not aware there is a limit on how many instrument calls can be made in PineScript so I had no choice but to divide the script into instrument categories. So far I have created 4 of them: Forex, Metals/ Commodities, Treasuries & Indexes which is the one presented here. If you are interested in the other ones, feel free to do a search.
Available Instruments: Mini S&P, VIX, Mini NASDAQ, Mini RUSSELL, EAFE Index (Global Developed Markets & EMRG Index (Global Emerging Markets)
The script calculates and plots the ZScore of both Net Long (Money Managers / Asset Managers) and Net Long (Dealers / Swap). In some instrument categories you will also see Open Interest. It depends on whether I was maxed out or not on making security calls.
If you are not familiar with ZScore, it basically calculates the distance of price from a mean average in units of Standard Deviation. In theory when price reaches +2 it signifies overbought while if it reaches -2 is oversold. However just because it's hitting an extreme in one particular average doesn't necessarily mean it will reverse as the position of price in relation with the next longer average might not be so out of range.
Must be attached to weekly chart.
If you have any questions/suggestions, feel free to add them in the comments below

Commitment of Traders ~ TREASURIESMy intention was to create 1 script for the Commitment of Traders report but I wasn't not aware there is a limit on how many instrument calls can be made in PineScript so I had no choice but to divide the script into instrument categories. So far I have created 4 of them: Forex, Indexes & Metals/ Commodities & Treasuries which is the one presented here. If you are interested in the other ones, feel free to do a search.
Available Instruments: Ultra(25-35yrs), Bonds(15-25yrs), 10yrs, 5yrs, 2yrs & 3 Month EuroDollar
The script calculates the ZScore of both Net Long (Money Managers / Asset Managers) and Net Long (Dealers / Swap) In some instrument categories you will also see Open Interest. It depends on whether I was maxed out or not on making security calls.
If you are not familiar with ZScore, it basically calculates the distance of price from a mean average in units of Standard Deviation. In theory when price reaches +2 it signifies overbought while if it reaches -2 is oversold. However just because it's hitting an extreme in one particular average doesn't necessarily mean it will reverse as the position of price in relation with the next longer average might not be so out of range.
Must be attached to weekly chart.
If you have any questions/suggestions, feel free to add them in the comments below

Commitment of Traders ~ COMMODITIES/METALSMy intention was to create 1 script for the Commitment of Traders report but I wasn't not aware there is a limit on how many instrument calls can be made in PineScript so I had no choice but to divide the script into instrument categories. So far I have created 4 of them: Forex, Treasuries, Indexes & Metals/ Commodities which is the one presented here. If you are interested in the other ones, feel free to do a search.
Available Instruments: Bloomberg Commodities Index, GOLD , SILVER , CRUDE OIL & NATURAL GAS
The script calculates the ZScore of both Net Long (Money Managers / Asset Managers) and Net Long (Dealers / Swap) In some instrument categories you will also see Open Interest. It depends on whether I was maxed out or not on making security calls.
If you are not familiar with ZScore, it basically calculates the distance of price from a mean average in units of Standard Deviation. In theory when price reaches +2 it signifies overbought while if it reaches -2 is oversold. However just because it's hitting an extreme in one particular average doesn't necessarily mean it will reverse as the position of price in relation with the next longer average might not be so out of range.
Must be attached to weekly chart.
If you have any questions/suggestions, feel free to add them in the comments below

Heikin Ashi Trailing Stoploss ActivationThe Basics
This indicator should be used on regular candle sticks. It is possible to trigger an alert, when the block flips from red to green bar. Or vice versa.
Red block represents a red Heikin Ashi candle.
Green block for green Heikin Ashi candle.
It can be used as a trailing stoploss for (DCA/ TV) bots, when riding trends.
What Makes It Different
The user can preset the price (of the asset e.g. BTC), where it will start looking for Heikin Ashi flips. Every Heikin Ashi flip before this preset price will be ignored. Preset prices could be chosen tactically at resistance levels.
Different time frames of Heikin Ashi flips can be used together. E.g. 10 min, 3 hour or 2 Day time frames. If this is possible within your Tradingview subscription.
Example
The user has a long position (bought at the green arrow.) The user wants to start trailing at price 88 USDT (blue line).
The indicator will only trigger when the following conditions are met:
Cross of red block on the indicator (representing red Heikin Ashi candle)
Price has crossed 88 USDT
If the candlestick turns from a green to a red block, before crossing 88 USDT. It will NOT trigger the alert. Visible as the orange down arrows. In the indicator below it is displayed as a red block.The alert will go off at the red down arrow on 10th Nov (if chosen for Once per bar close). The price condition of 88 USDT was already met at 7th Nov.
Final Words
Disclaimer: Please use it with care and at own risk. The owner of this indicator is not liable for any financial losses.
Past performance is no guarantee of future returns.

Trailing Stoploss Bottom ActivationThe Basics
The indicator is visible on the chart as circles above and below the bar.
It will trigger an alert when the current price goes below, the low of the previous candle.
Or an alert when current price goes above, the high of the previous candle.
The indicator can be used as a trailing stoploss for (DCA/ TV) bots.
The distance between the circles and candlesticks can be adjusted. If the user prefers to set an alert e.g. a few ticks lower than the candle bottom.
What Makes It Different
The user can preset the price (of the asset e.g. BTC), where it will start looking for the condition: current price is below previous candle low (when in long position). Current price is above previous candle high (when short).
Example
In the chart above MATIC/BUSD the user has drawn a blue line at 1.70. Since there is where he expects resistance.
The user has a long position (bought at the green arrow.) The user wants to start trailing at price 1.70.
The alert will only trigger when the following conditions are met:
Condition 1 - Crossed 1.70
Condition 2 - Current candle price is below previous candle low.
In the chart above price crossed above 1.70 on 26th Oct. Current candle price (at that moment) went below previous candle low on 27th Oct, indicated with a red arrow. Here the alert will go off at 1.659 BUSD (indicated in pink).
It ignores the other two lows, indicated with orange arrows. Because condition 1 is not met.
It is possible to use multiple time frames at the same time. Some time frames might not be available depending on your Tradingview subscription.
Final Words
Disclaimer: Please use it with care and at own risk. The owner of this indicator is not liable for any financial losses.
Past performance is no guarantee of future returns.

Supertrend NinjaSupertrend Ninja
The Basics
The Supertrend Ninja is a trend-following indicator. The indicator is optimised for daily, 2 days and 3 days candlesticks and can be used on varying trending markets.
Supertrend Ninja using 2 days candlesticks only gave 7 bullish signals in 2020 and 2 in 2021 for Bitcoin/USDT (based on Binance charts). Greatly reducing false signals. It can be used on lower time frames as well, although you will encounter more noise.
This indicator could be used as a compass for DCA or TV bots as well.
What To Look For
When the background of the candlestick closes green with an upwards pointing pink arrow. It indicates a possible bullish (up)trend. To enter a trade its best to place an order a few ticks above the candle high. This way we only enter a position, when there is trend continuation.
When the background of the candlestick closes red with a downwards pointing black arrow. It indicates a possible bearish (down)trend. To enter a trade its best to place an order a few ticks below the candle low.
Exits can be determined by Fibonacci extensions, orderblocks or other resistances to name a few. Or exit the trade when the opposite background color appears.
Final words
Disclaimer: Please use it with care and at own risk. The owner of this indicator is not liable for any financial losses.
Past performance is no guarantee of future returns.

High-Low IndexHello All,
High-Low Index is a breadth indicator based on Record High Percent (RHP). RHP is based on new 52-week highs and new 52-week lows. RHP => 100 * (new highs) / (new highs + new lows). High-Low Index is a 10-day Simple Moving Average of the RHP, which makes it a smoothed version of RHP. You can find many articles about High-Low Index on the net.
High-Low Index above 50 indicates that there are more new highs than new lows, and considered as Bullish.
High-Low Index below 50 indicates that there are more new lows than new highs, and considered as Bearish.
High-Low Index = 0 indicates there is no new highs (0% new highs).
High-Low Index = 100 indicates that there is at least 1 new high and no new lows.
and High-Low Index = 50 indicates that new highs and new lows is equal.
by default 40 cryptos are used in the script and shows High-Low Index for these cryptos. but you can change them as you wish. for example you can set all of them as stocks and see High-Low Index for these stocks.
You can set " Time frame " and the " Length " using the options. For example; if you set " Time frame " = 1 Week and the " Length " = 52 then it finds High-Low Index for 52weeks .
or another example; if you set " Time frame " = 1 Day and the " Length " = 22 the High-Low Indexn it finds High-Low Index for 22days.
You can enable/disable Record High Percent or Simple Moving Average of High-Low Index. Some traders use High-Low Index with its SMA, for example; High-Low Index generates a buy signal when it crosses above its moving average, and a sell signal when it crosses below its moving average.
Optionally you can see the securities in a table on the left bottom, you can change table size by usşng the options.
In the Table, for each security/cell;
=> if background is green then it has New High
=> if background is red then it has New Low
=> if background is gray then no New High, no New Low
=> if background is back then Data is not available for the security
As you can see in the screenshot below, the securities were changed and stocks are used instead of cryptos, so it calculates & shows High-Low Index for these stocks.
you can also find explanation in this screenshot:
Enjoy!

Classic Long Term Trend Following SystemThis is a classic long term trend following system.
The breakout period is 50 days instead of 20 and the moving average crossover are 40 and 120.
The moving averages are also exponential instead of simple.
The stoploss is 4 ATRs away from the price.
Recommendations:
Donchian Channels settings > 50 days
Moving Averages > 40 and 120, 80 and 140
Important to note:
My first strategy, DC Breakout System | This is simplicity at its finest, is best used on the crypto market and this one for stocks, commodities, currencies, etc. Those markets tend to trend a lot longer than crypto do.

Trend Following with Bollinger BandsThis is a trend following system which uses the Bollinger Bands instead of the Donchian Channels.
Long position:
* Price closes above the middle line.
* The fast EMA (in this case the 40) crosses over or is above the slow one (in this case the 120)
Short position:
* Price closes below the middle line.
* The fast EMA crosses under or is below the slow one.
Stoploss:
* 4 ATRs away from the price.

Trend Following with Donchian Channels and MACDThis is a trend following system based on the Donchian Channels. Instead of using a simple moving average crossover, this system uses the MACD as the trendfilter:
Long positions:
* Price makes a new 50 day high,
* The MACD-line crosses above or is above the Signal-line.
* Both the MACD and the Signal-lines are above the zero-line.
Short positions:
* Price makes a new 50 day low,
* The MACD-line crosses below or is below the Signal-line.
* Both the MACD and the Signal-lines are below the zero-line.
Stoploss:
The initial and the trailing stoploss are 4 ATRs away from the price.

DC Breakout Strategy | This is simplicity at its finest.As the title already describes: this is a Donchian breakout strategy. This strategy, as of now, only goes long. It goes long when the price close makes a new high and the 8 day moving average is above the 32 day moving average. The strategy exits the trade if the price breaks the atr trailing stop of * 3 or the 8 day moving average crosses below the 32 day moving average.
This is simplicity at its finest.

EneX SignalEneX is signal that give recommendation signals for entry and exit on spot market. This indicators not suitable for leverage trading in futures market.
EneX signal consider several indicators and has entry and exit rules.
EneX signal is suitable for investors who believe in trend following strategy (disclaimer on).
This script composed by Yohan Naftali for educational purpose only. Reader who will use this signal must do own research.
Indicator and Plot Involved
1. Williams Fractals with default periods = 2
2. William Alligator Indicators with default simple moving average 8, 13, and 21
3. Exponential Moving Averages with default value EMA 50, 100, and 200
4. Relative Strength Index with default overbought level = 80 and oversold level = 20
5. Williams Fractals are joined to create support and resistance line and fill area between support and resistance lines.
Entry signal conditions
1. Entry on Weakness when bullish fractal appear on n/2 period
2. Entry when price break resistance line
All entry condition must above EMA and alligator signal and not in overbought RSI
Exit signal conditions
1. Lowest price is below Exponential Moving Average
2. Lowest price is below William alligator lines
You can easily find entry and exit points by using Entry (E), Exit(X) signals
How to use
1. Monitor chart and wait until E or X signals
2. Entry if Entry Signal (E) appear (green colored label)
3. Exit if Exit Signal (X) appear (red colored label)
4. Change indicators setting when necessary
Best Practice
1. Entry only when entry signal (E) appear
2. Never entry when price below William alligator signal
3. Exit when exit signal (X) appear
4. Not exit when exit signal appear when you believe or you have information that price will be rebound
5. Exit if you believe that current price meet your target price
6. Always wise when use EneX signals
Disclaimer
Do your own research and consider fundamental price of asset.
The indicators provided on this script is for educational purposes only.
Author does not offer advisory or brokerage services, nor does it recommend or advise users to buy or sell particular stocks or securities.
Please examined script and give feedback for further improvement.

Higher Time Frame Chart OverlayHello All,
This script gets OHLC values from any security and Higher/Same time frame you set, then creates the chart including last 10 candles. it shows Symbol name, Time Frame, Highest/Lowest level of last 10 candles and Close Price at the right side of the chart as well. Closing price text color changes by the real-time candle of the related symbol and time frame. The all this was made using the Tables in Pine and the chart location doesn't change even if you change the size of main chart window.
Almost everything can be change as you want. You can change/set:
- Colors of Body and Top/Bottom Wicks separately
- The Height of each Cell
- The Width of Body and Wicks
- The Background and Frame color
- Enable/disable Status Panel (if you disable Status Panel then only candle chart is shown)
- Location of Status Panel
- Text color and Text size
- The Background color of Status Panel
Some examples:
The info shown in Status Panel:
You can change The Height of each Cell and The Width of Body and Wicks
You can change colors:
You can change location of the chart:
If you add the script more than once then you can see the charts for different symbols and time frames: (This may slow down your chart)
If you right-click on the script and choose "Visual Order" => "Bring to front" then it will be better visually:
P.S. Using this script may slow down your chart, especially if you add it more than once
Enjoy!

HAP Auto Trend Line [PRO]Hello Traders!
The trend line is among the most important tools used by technical analysts. Instead of looking at past business performance or other fundamentals, technical analysts look for trends in price action. A trend line helps technical analysts determine the current direction in market prices. Technical analysts believe the trend is your friend, and identifying this trend is the first step in the process of making a good trade, and it can tell Support/resistance is very good.
But when drawing Trend Lines, sometimes we're not sure where to start. From where is the starting point? And sometimes it can be drawn multiple lines with different support/resistance lines over time. This itself can be confusing, so I tried to create a tool that allows it to draw lines automatically. According to price movement.
Let's take a look at the variables you need to understand from our indicators.
For this indicator it works in two main parts:
Section of Trend Line
Trend Reversal section
Therefore, these two parts have separate functions. To be used as a component for easier decision-making.
Trend Line, as I said before, what it is. Next is Trend Reversal. I will simply say it is. A period of time when the candle tries to pump and dump. This will help point out the potential price reversal. And if there is a trend line area, it is an interesting point to consider. To identify possibilities.
Some variables from the settings page
Number of Bars to Check : It is the number of past candlesticks to consider. To identify the start of the Trend Line, if it meets the condition, it will automatically draw the Trend Line for you.
Trend Line Depth : It is the frequency. Of identifying the starting point Trend Line. If the value is large, it will find a low Trend Line, and if it is low, it will find more Trend Line. This is flexible. So you have to try it yourself. On demand.
Overview
You can turn it on or off. Support/resistance position either.
Select Emoji Support/resistance. Freely
Line style you want
your favorite color
customizable line intensity
the script is fast enough to run on 1sec chart:
fun !

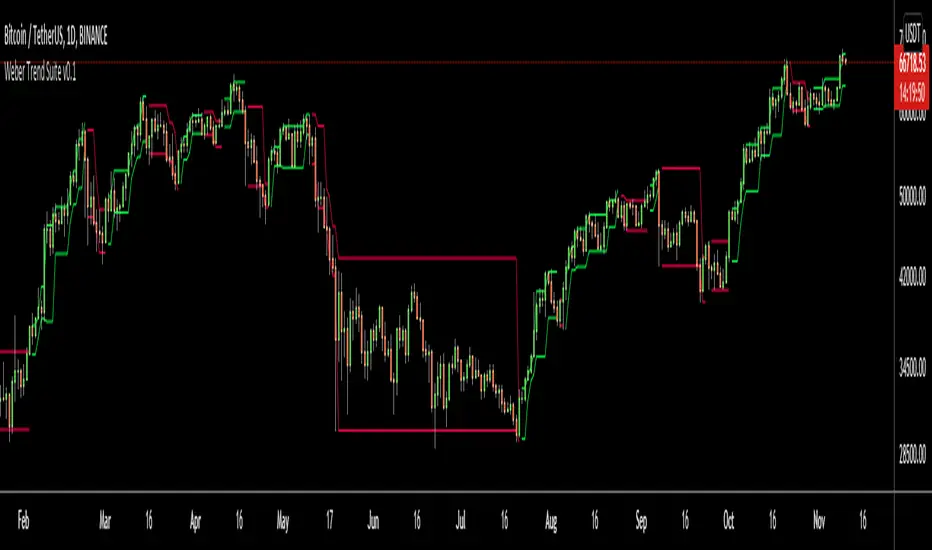
Weber Trend SuiteThe Weber Trend Suite (WTS) supports trend trading over longer timeframes.
Identification of the trend direction
Automatic identification of support and resistance level
Multi-Timeframe
Designed as a decision making framework for trading trending growth assets such as tech stocks and cryptocurrencies
The support and resistance lines are derived from the high, low and direction (bearish/bullish) from the latest outside bar at a time. The timeframe on which outside bars are detected can be chosen freely by the user. The importance of an outside bars tends to increase with the timeframe. Outside bars can play an important role in price action trading by providing support and resistance levels as well as the currently predominant trend direction. So this indicator enables a trader to automatically display the high, low and direction of the current outside bar from two different (usually higher) timeframes and therefore gives rationally and automatically derived support and resistance levels as well as the predominant trend direction from the chosen timeframes. The adjustable crossing EMA with its volatility noise filter gives further guidance on the current trend direction and strength.
The WTS can help traders and investors following a rule based system by providing a measure of trend strength and consistency as well as specific support and resistance levels.
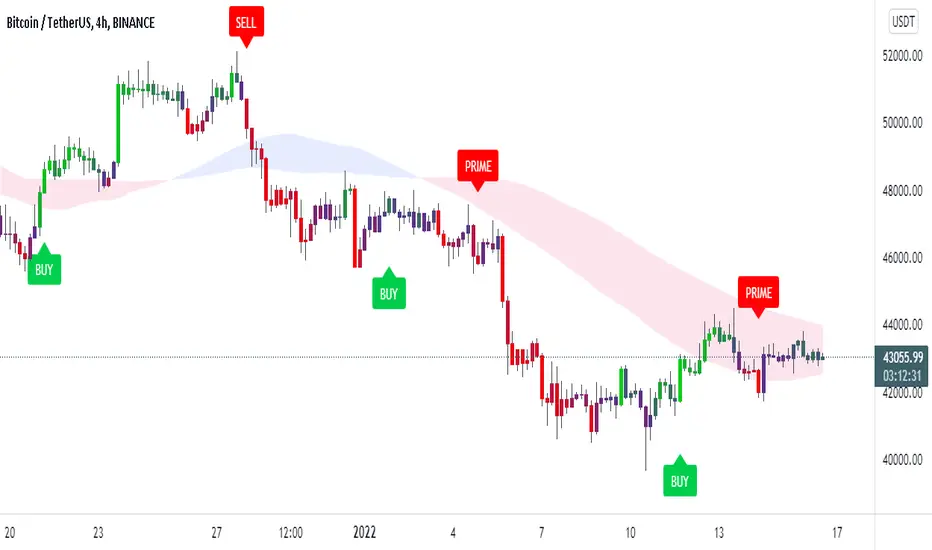
Trendorithm PrimeTrendorithm Prime is a toolkit made up of several different innovative indicators, designed by our team of developers. Get access now and create your own, unique trading strategies using our - all in one algorithm.
Our algorithm works in any market and focuses on finding the direction of the trends and remove noise from the price, for smooth understanding of the market.
Extra Confirmation
Using binomial distribution, the past values are processed to interpret the direction of trend.
After that, the signals are triggered based the volatility of the market,which is derived from the averages of candle size. All of these signals were optimised for each timeframe using timeframe multiplier.
Setting a lesser value on quotient adjusts the lookback length and volatility conditions, thus producing more number of signals that supports scalping trades. Higher the number in quotient, the frequency of trades reduce which helps the trader to hold trades for longer time.
Our Confirmation Signals helps to analyze the direction of trends for all markets and all timeframes, it boosts Trader’s confidence prior taking trades.
We made our Confirmation Signals flexible in order to suit any kind of trading style.
By adjusting the Quotient value in the settings, Traders can control the frequency of signals generated easily.
The Confirmation Signals includes a special type of signal called "Prime" which includes candle coloring to see the strength of the trend.
Our Candle-system is designed in 3 different colorings.
Green ( Bullish )
Red ( Bearish )
Purple (possible reversal or the possible formation of a new trend)
Trendo Cloud
The power of moving averages is always ultimate. This cloud made up of multiple moving averages acts as a dynamic support and resistance. The color and width of the cloud is used to find potential entry and exit points for trades.
Trend Catcher and Trend Chaser
The trend catcher is a trend-following indicator moves close to the price that aims to estimate the recent trend of price. It indicates green in uptrend and red in case of a downtrend.
The trend chaser is similar to the previous Trend Catcher, but it aims to chase long-term trends.
They are specially calculated from the highs and lows of price. Acts as a filter for confirmation signals and provides clarity for the direction of trend.
All of these functionalities tend to help users understand the market conditions as trending or ranging.
If you are using this script, you acknowledge that past performances are not indicative of future results and that there are a lot of factors required that go into being a profitable trader.
You can see the Author’s instructions below to get access to this prime indicator.
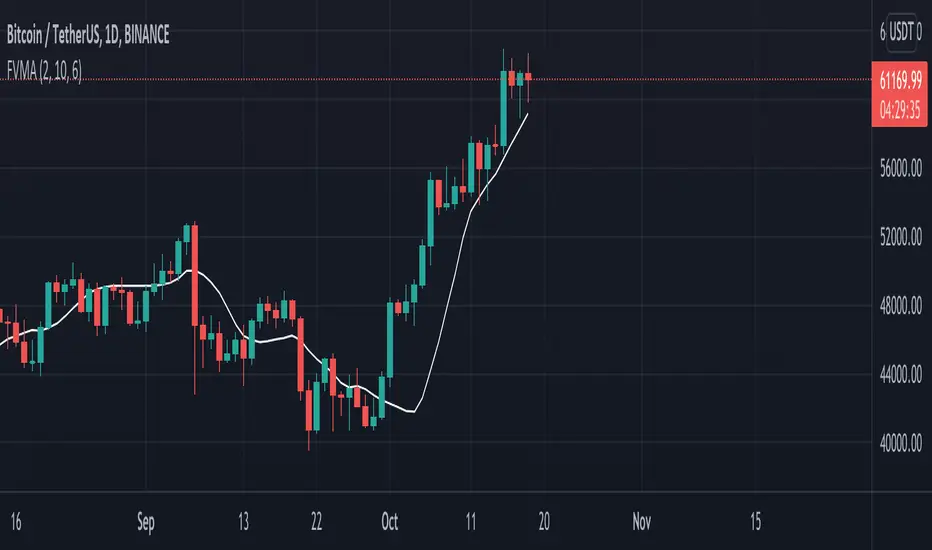
Bixord: FantailVMAThis indicator is a combination of moving average and ATR indicators. The indicator stays pretty close to price and at the same time shows clear trend of asset/stock. It shows you when price is above the FantailVMA it indicates an uptrend and when price is below it indicates a downtrend otherwise.
Hope you find this indicator useful!
Happy trading..