Improved Trend Shot | JeffreyTimmermansImproved Trend Shot
The "Improved Trend Shot" is an advanced trend-following tool that integrates cutting-edge features and the principles of John Ehlers’ SuperSmoother Filter to provide traders with more accurate trend detection and better decision-making. This enhanced version includes multiple smoothing types, customizable lengths, dynamic alerts, and a comprehensive dashboard to help traders quickly interpret market conditions.
This script is inspired by "TRW" . However, it is more advanced and includes additional features and options.
Key Features and Improvements
Smoothed Lines and Trend Detection
The core of the Improved Smooth Trend Shot relies on three key lines to capture market momentum:
Fast Line: Highly sensitive to short-term price changes, offering rapid responsiveness to market movements.
Middle Line: Provides a medium-term view of market trends, acting as a more stable reference.
Slow Line: Focuses on long-term trends, offering a broader perspective on market direction.
These three smoothed lines interact dynamically to create a visual color-coded cloud that helps traders easily interpret market conditions:
Green Cloud: Indicates an upward trend when the Fast line is above the Slow line.
Red Cloud: Signals a downward trend when the Fast line is below the Slow line.
The cloud color adjusts based on the relative positioning of the Fast, Middle, and Slow lines, helping traders to identify bullish or bearish trends with ease.
Dynamic Cloud Visualization and Alerts
The cloud and trend lines adapt to market conditions, updating in real-time to reflect changes in trend strength and momentum. Traders can also set up real-time alerts to notify them of important trend shifts, such as:
Fast and Slow Crossovers: Alerts when the Fast line crosses the Slow line.
Middle and Slow Crossovers: Alerts when the Middle line crosses the Slow line.
This makes it easier to capture trading opportunities and respond promptly to market changes.
Enhanced Smoothing Options
Traders can now choose from multiple smoothing types, including:
EMA (Exponential Moving Average)
SMA (Simple Moving Average)
DEMA (Double Exponential Moving Average)
WMA (Weighted Moving Average)
Each smoothing type has different properties, allowing traders to select the best fit for their trading style. The smoothing length can also be customized, offering flexibility in fine-tuning how sensitive or stable the trend lines should be.
Improved Signal Logic and Precision
The signal logic has been optimized for better precision. Now, the system provides more accurate buy and sell alerts based on:
Trend Detection: The color-coded cloud and the relative positions of the Fast, Middle, and Slow lines help visualize whether the trend is bullish or bearish.
Rising and Falling Indicators: The indicator also checks if each line is rising or falling over the last three bars, offering early signals of momentum shifts.
Dashboard Insights
The dashboard provides real-time updates on the positions and movements of the smoothed lines:
Line Positions: Displays the positions of the Fast, Middle, and Slow lines.
Trend Direction: Shows whether each line is rising or falling.
Price Levels: Displays the price levels for each of the smoothed lines, offering clear reference points for market evaluation.
These features help traders better understand the state of the market, offering valuable insights for both trend-following and reversal-based strategies.
Crossovers and Signal Triggers
The Improved Smooth Trend Shot focuses on crossovers between the different smoothed lines as primary trading signals. There are two types of crossovers:
Fast Shots: This occurs when the Fast line crosses the Slow line.
Slow Shots: This occurs when the Middle line crosses the Slow line.
These crossovers serve as key entry or exit points for traders, helping them spot potential trend reversals. The improved logic ensures that crossovers are accurately detected, reducing the chances of false signals.
Customization Options
The Improved Smooth Trend Shot offers a high degree of customization:
Smoothing Length: Adjust the smoothing period to balance between fast responses and stable trends.
Source Selection: Default to the average of high and low prices (hl2), or choose other price sources.
Smoothing Type: Select from EMA, SMA, DEMA, or WMA for personalized trend analysis.
Signal Type: Choose between Fast Shots or Slow Shots based on the type of crossover you want to focus on.
Long, Medium, and Short-Term Applications
Although the default settings are optimized for long-term trend analysis, the Improved Smooth Trend Shot is highly adaptable. By adjusting the smoothing length and selecting different smoothing types, traders can use the tool for:
Short-Term Trading: Focus on fast responses to market shifts using shorter smoothing periods.
Medium-Term Trading: Tailor the settings to capture intermediate trends.
Long-Term Trend Analysis: Use longer smoothing periods for a more stable and comprehensive view of market dynamics.
Advanced ATR Filtering and Alerts
The inclusion of ATR (Average True Range) filtering helps ensure that signals are triggered only when significant price movements occur. This helps reduce noise and false signals, ensuring traders only act on meaningful market shifts.
Conclusion
The Improved Smooth Trend Shot is a powerful and versatile tool that enhances the original SuperSmoother Filter with advanced features like customizable smoothing options, real-time alerts, and an intuitive dashboard. Whether you're a day trader, swing trader, or long-term investor, this enhanced indicator provides a comprehensive and actionable view of market trends.
The combination of enhanced signal accuracy, dynamic trend visualization, and in-depth customization ensures that the Improved Smooth Trend Shot is an indispensable tool for traders across all market conditions.
-Jeffrey
Trendfollowing

Trend Reversal Probability [Algoalpha]Introducing Trend Reversal Probability by AlgoAlpha – a powerful indicator that estimates the likelihood of trend reversals based on an advanced custom oscillator and duration-based statistics. Designed for traders who want to stay ahead of potential market shifts, this indicator provides actionable insights into trend momentum and reversal probabilities.
Key Features :
🔧 Custom Oscillator Calculation: Combines a dual SMA strategy with a proprietary RSI-like calculation to detect market direction and strength.
📊 Probability Levels & Visualization: Plots average signal durations and their statistical deviations (±1, ±2, ±3 SD) on the chart for clear visual guidance.
🎨 Dynamic Color Customization: Choose your preferred colors for upward and downward trends, ensuring a personalized chart view.
📈 Signal Duration Metrics: Tracks and displays signal durations with columns representing key percentages (80%, 60%, 40%, and 20%).
🔔 Alerts for High Probability Events: Set alerts for significant reversal probabilities (above 84% and 98% or below 14%) to capture key trading moments.
How to Use :
Add the Indicator: Add Trend Reversal Probability to your favorites by clicking the star icon.
Market Analysis: Use the plotted probability levels (average duration and ±SD bands) to identify overextended trends and potential reversals. Use the color of the duration counter to identify the current trend.
Leverage Alerts: Enable alerts to stay informed of high or extreme reversal probabilities without constant chart monitoring.
How It Works :
The indicator begins by calculating a custom oscillator using short and long simple moving averages (SMA) of the midpoint price. A proprietary RSI-like formula then transforms these values to estimate trend direction and momentum. The duration between trend reversals is tracked and averaged, with standard deviations plotted to provide probabilistic guidance on trend longevity. Additionally, the indicator incorporates a cumulative probability function to estimate the likelihood of a trend reversal, displaying the result in a data table for easy reference. When probability levels cross key thresholds, alerts are triggered, helping traders take timely action.

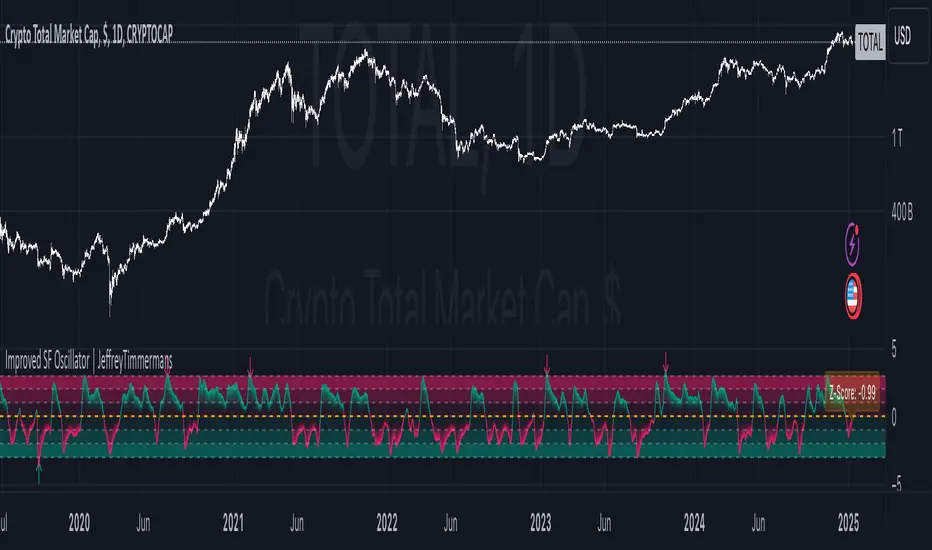
Improved SF Oscillator | JeffreyTimmermansImproved SF Oscillator
The "Improved SF Oscillator" is an advanced and versatile technical indicator designed to transform any moving average (MA) into a dynamic oscillator. This cutting-edge tool incorporates up to 13 different moving average types, including specialized indicators like Kaufman’s Adaptive Moving Average (KAMA), Tillson's Exponential Moving Average (T3), and the Arnaud Legoux Moving Average (ALMA). The oscillator offers traders a powerful tool for both trend-following and mean reversion strategies, significantly enhancing their ability to analyze market movements, identify potential entry and exit points, and make informed trading decisions.
This script is inspired by "EliCobra" . However, it is more advanced and includes additional features and options.
Core Functionality and Methodology
The Improved SF Oscillator leverages user-defined parameters to calculate the selected moving average type. Key inputs, such as the length of the MA and smoothing factors, offer traders extensive customization. Additionally, the indicator utilizes a unique process of deriving both the mean and standard deviation of the moving average over a defined normalization period. This method is crucial for normalizing the moving average and standardizing its behavior. The final step in this calculation involves deriving the Z-Score, which is computed by subtracting the moving average's mean from its current value and then dividing the result by the standard deviation.
This normalization allows the oscillator to display a standardized value that highlights the relative position of the moving average, offering a clear view of market volatility and potential trend shifts. By incorporating this statistical approach, the Improved SF Oscillator helps traders assess price behavior in relation to its typical fluctuations, providing vital insight into whether the price is overbought, oversold, or near a turning point.
The Moving Average Types
One of the standout features of the Improved SF Oscillator is its support for a wide variety of moving average types. Each MA type has its own unique methodology and behavior, allowing traders to choose the best fit for their trading strategy:
KAMA (Kaufman’s Adaptive Moving Average):
KAMA is designed to adapt its smoothing period dynamically based on market volatility. When market conditions are more volatile, KAMA responds quickly, while during calmer periods, it smooths price action more effectively. This characteristic allows KAMA to capture trends with minimal noise, providing traders with a smoother and more adaptive moving average.
T3 (Tillson's Exponential Moving Average):
The T3 MA is a refined version of the traditional EMA. By applying additional smoothing to the moving average, it significantly reduces lag and increases responsiveness. This allows traders to capture trends more accurately while maintaining the benefit of smooth price tracking.
ALMA (Arnaud Legoux Moving Average):
ALMA combines both linear regression and exponential smoothing techniques. Its unique formula allows for reduced lag and noise, providing a smoother representation of price trends. ALMA is particularly useful in detecting trend changes and is highly favored for its precision and ability to identify entry and exit points with minimal delay.
Z-Score and Normalization
The Z-Score is central to the functionality of the Improved SF Oscillator. By calculating the standard deviation and mean of the moving average over a defined period, the Z-Score standardizes the values of the MA. This transformation allows traders to assess the relative position of price in terms of how far it deviates from its mean, taking market volatility into account.
The Z-Score provides the following key benefits:
Overbought/Oversold Conditions: By assessing the Z-Score, traders can identify whether the price is approaching overbought or oversold conditions. Extreme positive or negative Z-Score values indicate potential reversals.
Volatility Adjustments: The Z-Score allows traders to understand market volatility in a normalized way, facilitating more accurate readings of price movements in relation to their typical behavior.
Enhanced Utility and Features
The Improved SF Oscillator is built for use in both trend-following and mean-reversion strategies. Traders can analyze the position of the oscillator relative to its midline to confirm trends. The oscillator’s deviation from the midline can indicate potential reversals, while extreme values can serve as signals for mean-reversion trades.
Additional features include:
Custom Alerts: The Improved SF Oscillator comes with real-time alerts for significant events such as trend reversals or when the oscillator crosses important thresholds. Traders can set alerts for when the oscillator exceeds a specified Z-Score, signaling overbought or oversold conditions.
Reversal Bubbles: To further aid in identifying turning points, the oscillator provides visually distinctive bubbles on the chart that highlight potential reversal points. These bubbles mark instances when the oscillator reaches an extreme value and then begins to reverse, offering valuable signals for potential entry or exit points.
Bar Coloring Options: The oscillator features a variety of bar coloring options, including:
Trend (Midline Cross): Bar colors change when the oscillator crosses its midline, signaling potential shifts in market momentum.
Extremities: Bars are colored based on extreme values, helping traders quickly identify periods of high volatility or potential trend reversals.
Reversions: Bar colors change when reversal conditions are met, such as when the oscillator shows signs of turning from overbought to oversold or vice versa.
Slope: Bars are colored based on the slope of the oscillator, providing insights into the underlying momentum of the market.
Recent Improvements and Features
After its initial release, the Improved SF Oscillator underwent several significant updates aimed at enhancing its usability and providing traders with more advanced tools:
Reversal Point Alerts: The addition of alerts for potential reversal points adds a crucial layer of functionality. These alerts notify traders in real time when the oscillator signals an overbought or oversold condition, or when it reaches a reversal point that could mark a shift in market direction.
Dashboard Integration: A dashboard feature was introduced to provide an overview of the oscillator’s readings. This allows traders to quickly assess the market conditions and oscillator behavior across multiple timeframes or instruments, ensuring that they are always aware of potential opportunities or risks.
Visual Enhancements: Several visual improvements were made to the bar coloring system, making it easier for traders to quickly interpret market conditions at a glance. The addition of customized bar color schemes for trends, extremes, and slopes helps traders make faster decisions based on clear visual cues.
Revised Inputs and Customization: The user interface was improved to offer more flexibility in customizing the indicator’s inputs. Traders can now fine-tune the oscillator's behavior to match their trading style, adjusting factors such as the length of the moving average, the type of smoothing, and the threshold values for overbought and oversold conditions.
Use Cases and Practical Application
The Improved SF Oscillator is ideal for a wide range of trading strategies, from long-term trend-following techniques to short-term mean-reversion approaches. Here are some practical use cases:
Trend Confirmation: Traders can use the oscillator to confirm existing trends. When the oscillator is above the midline and moving upward, it may confirm a bullish trend. Similarly, a downward slope below the midline may indicate a bearish trend.
Mean Reversion Trading: By observing the oscillator’s movement beyond certain Z-Score thresholds, traders can identify potential mean-reversion opportunities. Extreme readings above or below the midline signal that price may be ready to revert to its average.
Reversal Detection: The reversal bubbles and alerts provide early warnings of potential trend reversals, making the Improved SF Oscillator an effective tool for spotting turning points before they fully manifest.
Volatility Assessment: The Z-Score and different MA types allow traders to assess market volatility, adjusting their trading approach based on the current market conditions. For instance, during periods of low volatility, slower MAs like KAMA may be more suitable, while during high volatility, faster MAs like T3 or ALMA can offer more responsiveness.
Key Features Recap
13 moving average types to suit different market conditions and trading strategies.
Z-Score normalization for accurate assessments of market volatility and overbought/oversold conditions.
Alerts for reversal points, extreme Z-Score values, and trend changes.
Dashboard to monitor oscillator values and conditions across timeframes and instruments.
Reversal point bubbles to visually highlight potential turning points.
Customizable bar coloring for trend, extremity, reversal, and slope visualization.
The Improved SF Oscillator offers a comprehensive, flexible, and user-friendly tool for traders looking to enhance their analysis and make better-informed decisions in a constantly evolving market. Whether used for trend-following, mean-reversion, or volatility analysis, this indicator is designed to provide valuable insights that can help traders navigate even the most challenging market conditions.
-Jeffrey
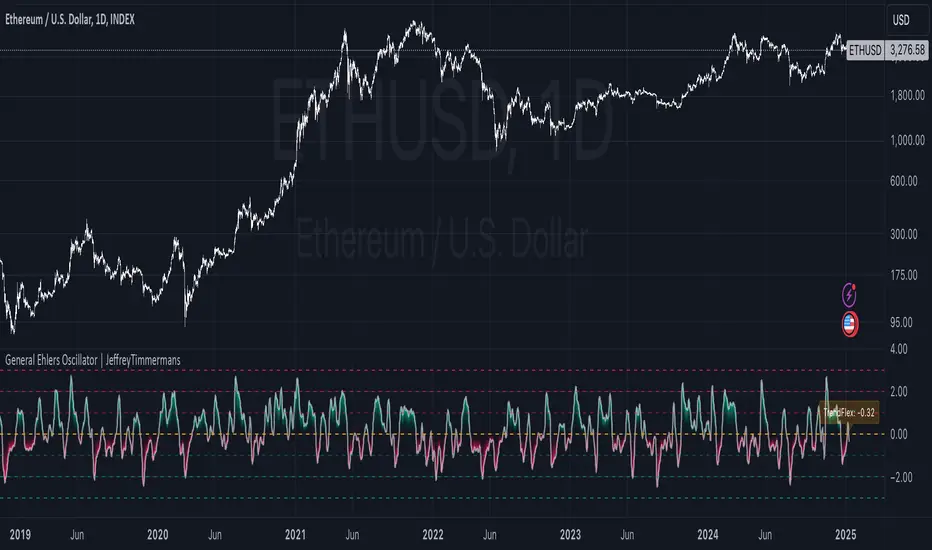
General Ehlers Oscillator | JeffreyTimmermansGeneral Ehlers Oscillator
The "General Ehlers Oscillator" is a powerful, technical indicator designed to provide traders with precise insights into market trends, reversals, and momentum. Built upon Dr. John Ehlers' innovative methodologies, this tool leverages advanced signal processing techniques to deliver near-zero lag with exceptional sensitivity to trend changes. Contact us via direct message to request access to this exclusive indicator.
Designed for multi-timeframe usability, the oscillator operates seamlessly across all intervals, from 1-second candles to monthly charts. Its outputs are normalized within a consistent range of -3.0 to +3.0, ensuring clarity and uniformity in identifying overbought, oversold, and midline conditions. With enhancements and added functionality, the General Ehlers Oscillator is a comprehensive tool for traders seeking to refine their analysis and improve trade timing.
This script is inspired by the Wizard: "ImmortalFreedom" . However, it is more advanced and includes additional features and options.
Core Methodology
The General Ehlers Oscillator employs cutting-edge techniques to enhance trend-following and reversal detection:
TrendFlex Calculation: Retains trend information while being highly responsive to reversals.
Zero-Lag Averaging: Near-zero lag processing ensures that signals are timely and reliable.
Bounded Output: Oscillator values are normalized between -3.0 and +3.0, allowing consistent interpretation across all timeframes.
Key Features
The General Ehlers Oscillator combines advanced calculations with user-friendly customization options to meet the needs of diverse trading strategies.
Adjustable Thresholds
Additional threshold levels have been introduced, offering more granular insights into overbought and oversold conditions.
Enhanced Threshold Coloring
Improved visual cues allow traders to quickly interpret the oscillator's position relative to key thresholds, making it easier to identify significant market conditions.
Dynamic Alerts
Real-time alerts provide notifications for critical events, such as midline crosses, extreme values, and reversal points, ensuring you never miss an important signal.
Dashboard Integration
The oscillator now features an integrated dashboard that displays key information at a glance. Traders can monitor critical metrics and oscillator conditions across multiple timeframes, ensuring comprehensive situational awareness.
Dynamic Label for TrendFlex
A dynamic label overlays the chart, providing immediate feedback on the oscillator’s TrendFlex readings and reinforcing its usability as a trend-confirmation and reversal tool.
Practical Applications
The General Ehlers Oscillator supports a variety of trading strategies, including:
Trend Confirmation: Use midline crossings and the slope of the oscillator to confirm ongoing trends.
Reversal Detection: Identify key turning points in the market with high sensitivity to reversals.
Mean-Reversion Strategies: Spot overbought and oversold conditions using oscillator extremes, signaling potential reversion opportunities.
Enhanced Utility
Reversal Sensitivity
The oscillator’s ability to detect reversals is enhanced by additional threshold levels and dynamic visual cues, helping traders act decisively at critical turning points.
Multi-Timeframe Consistency
With a bounded range of -3.0 to +3.0, the oscillator maintains consistent behavior across all timeframes, offering reliable insights for both intraday and long-term analysis.
Comprehensive Alerts
Set custom alerts for threshold breaches, midline crossings, and reversal signals to stay ahead of market movements.
Visual Enhancements
Improved threshold coloring and dynamic labels make interpreting market conditions faster and more intuitive, reducing analysis time and decision-making delays.
Recent Updates
The General Ehlers Oscillator has been significantly improved with the following updates:
Additional Thresholds: More thresholds have been added, providing detailed insights into varying levels of market conditions.
Enhanced Threshold Coloring: Thresholds are now color-coded with improved clarity, making it easier to identify critical zones.
Dynamic Alerts: Real-time alerts for trading, reversal points, and threshold breaches ensure timely notifications of key events.
Integrated Dashboard: The new dashboard consolidates critical information, offering a clear overview of oscillator behavior across timeframes.
Dynamic TrendFlex Label: A dynamic label overlays the chart, displaying real-time TrendFlex values and reinforcing the oscillator’s analytical capabilities.
Why Use the General Ehlers Oscillator?
The General Ehlers Oscillator combines advanced methodologies with enhanced usability, making it an indispensable tool for traders.
Advanced Signal Processing: Built on Dr. John Ehlers’ innovative techniques.
Bounded Range: Consistent performance with a normalized range of -3.0 to +3.0.
Enhanced Alerts: Stay on top of critical market events with dynamic alerts.
Visual Improvements: Clear, intuitive visuals ensure faster interpretation and decision-making.
Customizable Features: Tailor the oscillator’s behavior to suit your trading style and market conditions.
Whether you’re focused on trend-following, mean-reversion, or volatility analysis, the General Ehlers Oscillator provides the tools and insights you need to navigate complex market conditions with confidence. However, the General Ehlers Oscillator works best in trend-following regimes.
-Jeffrey
Improved RSI Trend Sniper | JeffreyTimmermansImproved RSI Trend Sniper
This indicator, the "Improved RSI Trend Sniper" is a sophisticated tool designed to enhance market trend analysis by integrating customizable RSI thresholds with advanced moving average options and refined visual enhancements.
Key Features
Advanced Moving Average Options:
The indicator now supports multiple moving average types: SMA, EMA, SMMA, WMA, VWMA, LSMA, HMA, and ALMA, offering greater flexibility in trend analysis.
Users can customize the moving average length for precise momentum detection.
Enhanced Momentum Detection:
Upgraded to allow dynamic calculation of momentum based on user-selected moving averages.
Conditions for bullish or bearish momentum now consider changes in the chosen moving average rather than a fixed EMA, improving accuracy.
Visual Upgrades:
A gradient-based trend fill with multiple opacity layers provides a visually appealing representation of bullish and bearish trends.
New dashboard integration displays key market information, including the ticker, timeframe, and current trend (bullish or bearish).
Improved Signal Customization:
Customizable colors and labels for bullish and bearish signals ensure easy identification on the chart.
Enhanced settings for showing or hiding labels and trend fills
Refined Alerts System:
Alerts are now generated for bullish and bearish conditions with customized messages for better responsiveness.
Alerts can be triggered once per bar close, making them more reliable.
What's New:
RSI and MA Customization: Users can define thresholds and moving average settings, providing more control over trend analysis.
Dashboard Integration: Displays real-time updates directly on the chart for improved situational awareness.
Visual Enhancements: Introduced gradient fills for trend regions, making trends more distinct.
Expanded Moving Average Options: Allows for tailored strategies using various MA calculation methods.
Alert Messaging: Streamlined notifications for actionable insights.
How It Works
Momentum Analysis:
Bullish momentum is detected when the RSI crosses above the bullish threshold and the moving average is increasing.
Bearish momentum is flagged when the RSI falls below the bearish threshold, and the moving average is decreasing.
Trend Visualization:
Bullish trends are highlighted with gradient shades of green, while bearish trends use shades of red.
Labels appear on the chart to mark key turning points.
Tailored for Different Trading Styles
The Improved RSI Trend Sniper is versatile and adaptable, catering to traders with various time horizons:
Long-Term Adjustments: For traders focusing on long-term trends, increasing the RSI length and moving average period allows the indicator to smooth out minor price fluctuations and highlight sustained momentum. Selecting slower-moving averages like the SMA or LSMA further filters out short-term noise, ensuring signals align with broader market trends.
Medium-Term Adjustments: Swing traders can use a balanced RSI length (e.g., 14–20) and a medium moving average period (e.g., 20–50) to capture actionable signals within the mid-range market cycles. The inclusion of options like EMA or SMMA ensures quicker reactions to price changes while maintaining moderate sensitivity to reversals.
Short-Term Adjustments: For day traders or scalpers, using a shorter RSI period (e.g., 7–10) alongside faster moving averages such as the HMA or ALMA can provide quicker signals for high-frequency trading. These adjustments enhance the ability to react swiftly to immediate market shifts, ideal for fast-paced trading environments.
By customizing the indicator’s settings to align with your trading timeframe, the Improved RSI Trend Sniper ensures accurate and relevant insights, empowering traders to optimize their strategies across any market condition.
Dashboard Details
Provides an at-a-glance view of market data for the current ticker and timeframe.
The Improved RSI Trend Sniper takes the original tool to the next level, offering a more comprehensive, customizable, and visually intuitive approach to market trend analysis. Perfect for traders looking to refine their strategies with actionable insights.
-Jeffrey

Improved Target Oscillator | JeffreyTimmermansImproved Target Oscillator
The Improved Target Oscillator is a versatile technical indicator that identifies trends, reversals, and market momentum. Designed to work effectively across various markets, this oscillator excels at capturing longer-term market trends, making it ideal for traders focused on sustained price movements. By using advanced mathematical techniques and dynamic visualization, the oscillator provides actionable insights, helping traders navigate complex market environments with confidence.
Key features include:
A dynamic oscillator line to reflect market momentum and reversals.
Clear gradient-based coloring to distinguish between bullish and bearish conditions.
Signal highlights for potential entry and exit points based on trend shifts.
This tool is particularly useful for identifying extended trends and provides a clean, intuitive interface for assessing market dynamics.
Improvements in the Improved Target Oscillator
Smoothing Feature:
Added an optional smoothing toggle, allowing the use of SMA or EMA for reducing noise.
Provides flexibility through adjustable smoothing length, enhancing clarity in choppy markets.
Alerts for Trade Opportunities:
Built-in alert conditions for bullish and bearish signals.
Allows traders to receive notifications when critical trend changes occur, ensuring they never miss an opportunity.
Customizable to integrate seamlessly into trading workflows.
Enhanced Visualization:
Introduced dynamic gradients for bullish and bearish conditions with improved customization options.
Provides clearer differentiation of momentum changes, improving interpretability.
Signal Highlights:
Improved visual cues for bullish and bearish signals with precise dot indicators.
Offers better alignment with oscillator momentum shifts, ensuring actionable insights.
Adaptability:
Tuned for use in capturing longer-term market trends, emphasizing its effectiveness in identifying sustained movements.
Adjusted oscillator sensitivity with a levels multiplier for better scalability across various market conditions.
Level Markers:
Clearer delineation of key oscillator levels, including half and full normalized levels for improved context.
A neutral line explicitly plotted for easier trend and momentum identification.
Summary
The Improved Target Oscillator combines a sophisticated mathematical foundation with practical visualization enhancements to deliver a more intuitive and precise tool for market analysis. With added flexibility, improved signals, and tailored features for longer-term trends, this oscillator is an essential resource for traders looking to refine their strategies.
-Jeffrey

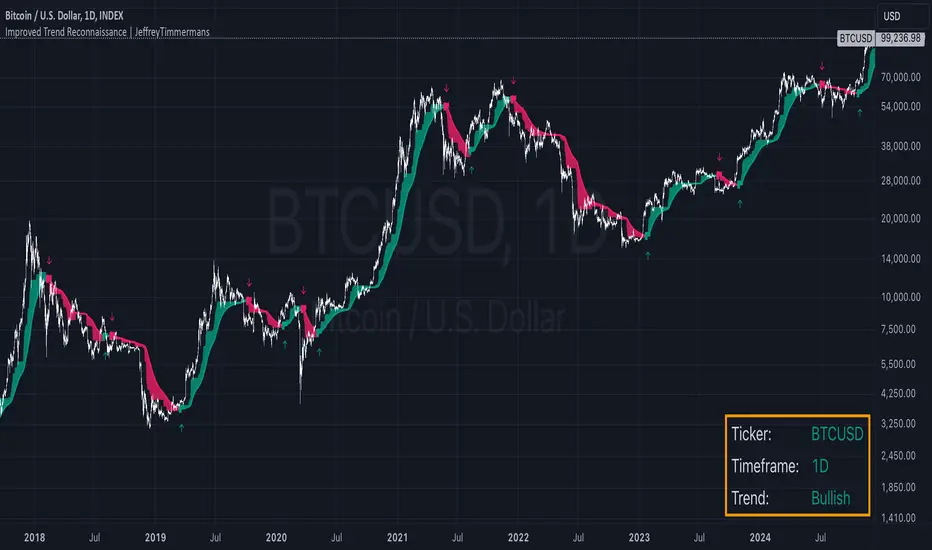
Improved Trend Reconnaissance | JeffreyTimmermansImproved Trend Reconnaissance
The Improved Trend Reconnaissance indicator is a robust tool designed to help traders identify and follow trends while avoiding market noise. It is especially effective for capturing longer-term trends and sustained price movements over extended time periods. By leveraging smoothed trend analysis and volatility-based consolidation detection, this indicator provides clear and actionable insights for traders focusing on significant market trends.
What Does This Indicator Do?
At its core, this indicator calculates a Half Trend value and applies advanced smoothing techniques to emphasize longer-term trends. Additionally, it incorporates volatility analysis using the Average True Range (ATR) to detect periods of consolidation, where trend signals are muted to prevent false signals.
Key Components Explained
Half Trend Calculation:
This indicator determines a Half Trend value based on the relationship between the Exponential Moving Average (EMA) of closing prices and the highest highs and lowest lows over a specified range.
The trend is further smoothed to minimize short-term fluctuations, ensuring the focus remains on sustained price movements.
ATR-Based Consolidation Detection:
By comparing the range of price highs and lows to a multiple of ATR, the indicator detects consolidation zones where the market is range-bound. During these periods, trend signals are suppressed to avoid false positives.
Trend Visualization:
Bullish Trends: Highlighted in green with upward markers and optional trend-colored candles.
Bearish Trends: Highlighted in red with downward markers and optional trend-colored candles.
Designed for Longer-Term Trends:
The default settings are optimized to capture longer-term trends, making this indicator particularly valuable for traders looking to identify and follow substantial market movements over extended periods.
Key Features
Optimized for Capturing Longer Trends:
With the default settings, the indicator is tailored to identify and follow longer-term price trends, reducing noise from minor fluctuations. This makes it ideal for traders focused on significant trends and extended price movements.
Customizable Inputs:
Parameters such as trend range, smoothing length, ATR calculation period, and consolidation threshold are fully customizable.
Visual settings, including trend colors and signal sizes, can be adjusted for personalized trading needs.
Dynamic Signal Generation:
Bullish Signals: Generated when the smoothed Half Trend crosses upward and the market is trending.
Bearish Signals: Generated when the smoothed Half Trend crosses downward and the market is trending.
Alerts can notify traders in real time when these conditions occur.
Enhanced Visualization:
Candle coloring based on trend direction provides an immediate visual representation of market momentum.
Plotted trend lines and filled regions between them emphasize the current trend's strength and direction.
Real-Time Dashboard:
Displays essential information, including the current ticker, trend direction, and status (bullish or bearish), directly on the chart.
How to Use This Indicator
Identify Longer-Term Trends:
Use the smoothed Half Trend line and trend-colored candles to identify and follow significant price trends.
The default settings are specifically designed to focus on extended trends, making it easier to spot major market moves.
Avoid Noise in Consolidation:
Pay attention to the consolidation detection feature, which suppresses signals during range-bound market conditions, aka mean-reverting markets.
This ensures that signals generated are more reliable and actionable.
Confirm Trend Signals:
Use the visual markers (flags) and dashboard status to validate bullish or bearish trends before making trading decisions.
Set Alerts:
Set alerts for bullish or bearish signals to stay informed about key market movements without constantly monitoring the charts.
Adapt for Your Strategy:
While optimized for longer-term trends, the customizable settings allow you to adapt the indicator for shorter-term strategies if needed.
What Makes This Indicator Unique?
Focus on Longer-Term Trends:
Unlike many indicators that respond to short-term fluctuations, this tool is tailored for longer-term trend-following systems, ensuring that traders capture the most meaningful price movements.
Noise Reduction:
By combining smoothing techniques and ATR-based consolidation detection, the indicator reduces market noise and focuses on actionable insights.
Clear Visual Representation:
The combination of trend-colored candles, plotted lines, and dashboard information simplifies the analysis of complex market trends.
Customizability:
Fully adjustable parameters ensure the indicator meets the specific needs of a wide range of trading styles.
Real-Time Feedback:
Alerts and dashboard integration keep traders informed, enabling timely and well-informed decision-making.
The Improved Trend Reconnaissance indicator is an essential tool for traders looking to focus on longer-term trends and sustained market movements. With its default settings optimized for capturing significant trends over extended periods, it offers clarity, precision, and actionable insights for successful trend-following trading.
-Jeffrey
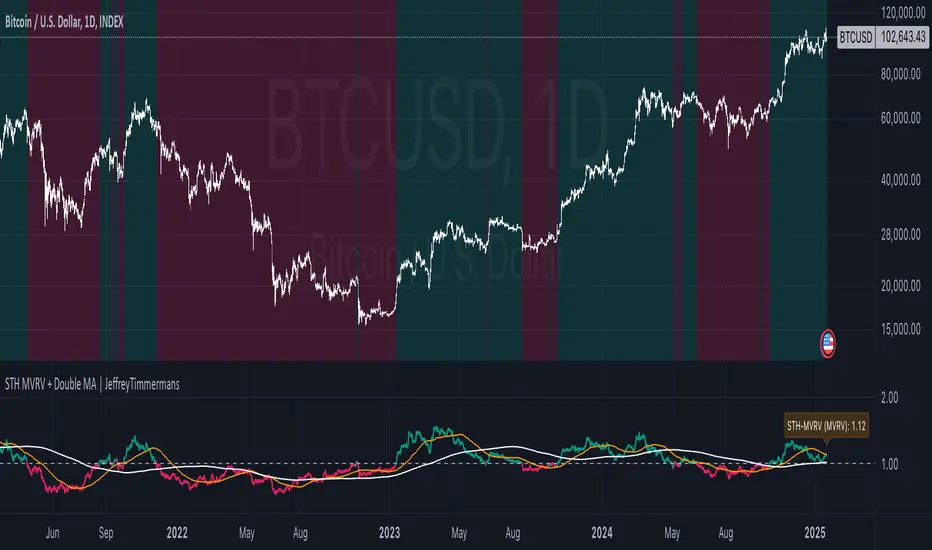
STH MVRV + Double MA | JeffreyTimmermansSTH MVRV + Double MA
This indicator combines blockchain analytics and technical analysis to provide traders with insights into market trends and cycles. At its core, it utilizes the Short-Term Holder (STH) Market Value to Realized Value (MVRV) ratio, a powerful metric in blockchain analysis, alongside Moving Averages (MA's) to offer a comprehensive view of market dynamics.
What Is the STH-MVRV Ratio?
The STH-MVRV ratio is a blockchain-based metric that compares the market value of Bitcoin held by short-term holders to its realized value.
Market Value: The current price of Bitcoin multiplied by the number of coins held by short-term holders.
Realized Value : The average price at which short-term holders acquired their Bitcoin, based on blockchain transaction data.
This ratio provides a unique perspective on market sentiment:
Above 1: Short-term holders, on average, are in profit. This often signals a bullish market.
Below 1: Short-term holders are, on average, at a loss, which can indicate bearish sentiment.
The STH-MVRV is particularly useful for identifying potential market tops or bottoms, as short-term holder behavior often reflects broader market trends.
How Does This Indicator Work?
The STH MVRV + Double MA indicator builds on the STH-MVRV ratio by integrating it with additional data and tools to enhance its practical use:
STH-MVRV Variations:
STH-MVRV (MVRV): The traditional ratio as described above.
Price-Based MVRV: A variation using Bitcoin price to measure similar dynamics.
Average MVRV: A hybrid metric combining the two for balanced insights.
Dynamic Moving Averages (MA's):
Primary SMA (STH-MVRV): Smooths out fluctuations in the STH-MVRV ratio over a default period of 155 days.
Extra MA: A faster-moving average for shorter-term trends (default: 50 days).
Second MA: A slower-moving average for longer-term trends (default: 200 days).
Visual and Alert Features:
Color-coded plots to highlight bullish or bearish conditions.
Alerts for key crossover events, such as when STH-MVRV crosses above/below critical levels or Moving Averages.
Key Features
STH-MVRV as a Sentiment Gauge:
Use the ratio to determine whether short-term holders are profiting (bullish) or losing (bearish).
Moving Average Integration:
Identify trends and reversals with customizable Moving Averages.
Crossovers between MA's and the STH-MVRV indicate actionable trading signals.
Customizable Parameters:
Tailor SMA and MA settings to align with your strategy.
Adjust colors and labels for clearer insights.
Real-Time Updates:
Dynamic labels display the current values of STH-MVRV, Price-based MVRV, or the Average, providing instant clarity.
How to Use This Indicator
Gauge Market Sentiment:
Use the STH-MVRV to understand whether the market is overvalued or undervalued based on short-term holder behavior.
Trend Identification with MA's:
Monitor crossovers between STH-MVRV and Moving Averages for potential buy or sell signals.
Analyze Market Cycles:
Use the Average MVRV to gain a broader view of market conditions, balancing short-term and long-term insights.
What Makes This Indicator Unique?
In-Depth Blockchain Metric: Builds directly on the STH-MVRV ratio, a key metric in blockchain analysis.
Integrated Analysis: Combines the STH-MVRV with Moving Averages for enhanced functionality.
Customizability and Practicality: Users can adapt the settings to fit their unique trading style, ensuring the tool is both flexible and powerful.
This combination of blockchain insights and technical tools makes the STH MVRV + Double MA indicator an essential addition to any trader’s arsenal. Use it to stay ahead of market trends and make informed decisions with confidence.
-Jeffrey
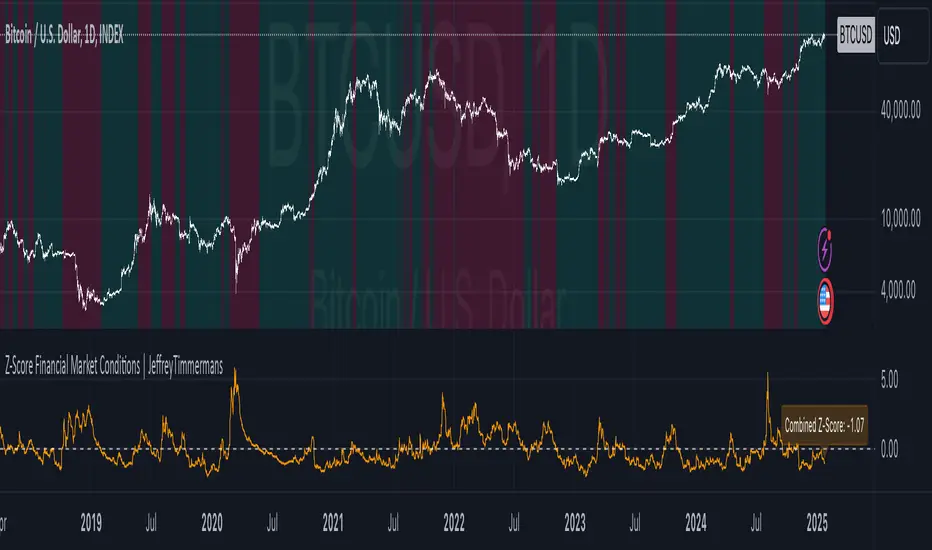
Z-Score Financial Market Conditions | JeffreyTimmermansZ-Score Financial Market Conditions
The Z-Score Financial Market Conditions indicator is a cutting-edge tool for measuring financial market stress and relaxation by combining eight critical financial metrics into a single composite Z-score. This dynamic indicator provides traders and analysts with actionable insights into the overall state of the financial markets, enabling informed decision-making across various trading and investment systems.
Purpose of the Indicator
This indicator serves as a comprehensive gauge of financial market conditions, offering a clear visualization of whether the markets are in a state of stress (elevated risks) or relaxation (normalized conditions). The Z-Score Financial Market Conditions tool is particularly effective for:
Macro-Level Risk Assessment: Identifying periods of high market stress or calmness.
Trend Following Systems: Gauging the market's underlying conditions to validate trends.
Mean Reversion Strategies: Using extreme Z-score levels to detect potential reversals.
Portfolio Risk Management: Adjusting asset exposure based on market-wide financial conditions.
This indicator works exclusively on the 1-day timeframe, as it is calibrated to analyze daily changes in the financial metrics that drive market behavior.
The Eight Key Components and Their Importance
The composite Z-score integrates the Z-scores of the following eight financial metrics. These metrics have been selected for their complementary insights into various aspects of financial market conditions:
VIX (S&P 500 Volatility Index)
Reflects implied volatility in the U.S. equity market.
High VIX values indicate increased uncertainty and risk aversion among market participants.
MOVE (US Treasury Bond Volatility Index)
Captures volatility in U.S. Treasury bonds.
Essential for understanding risk in fixed-income markets, which significantly impact broader economic conditions.
ICE BofA High Yield Option Adjusted Spread (BAMLH0A0HYM2)
Measures the risk premium for high-yield corporate bonds.
Rising spreads suggest increased credit risk and potential economic stress.
ICE BofA Corporate Index Option Adjusted Spread (BAMLC0A0CM)
Tracks credit spreads in the investment-grade bond market.
Helps evaluate the health of higher-quality corporate debt, a key indicator of financial stability.
ICE BofA US High Yield Index Spread (BAMLH0A0HYM2)
Focuses on high-yield U.S. corporate bonds.
Provides localized insights into U.S. credit conditions and risk levels.
CDS (Credit Default Swap Spreads)
Measures the cost of insuring against bond defaults.
Rising CDS spreads signal growing concern over creditworthiness, often a leading indicator of financial stress.
Global Bond Spread (AGG)
Represents global fixed-income spreads.
Offers a broader perspective on international financial conditions beyond the U.S. market.
TED Spread (Treasury-EuroDollar Spread)
The difference between interbank lending rates and short-term U.S. Treasury yields.
Widely regarded as an indicator of systemic risk in the banking sector.
Features and Improvements
This script builds upon the original concept by introducing advanced features to enhance its precision and usability:
Lookback Period Adjustment
A customizable lookback period for Z-score calculations (default: 160 days).
Allows for greater flexibility in adapting to different market conditions.
Moving Average (MA) Smoothing
Optional smoothing of Z-scores using an exponential moving average (EMA) for enhanced clarity.
Default smoothing length: 8 days.
Individual Component Visibility
Plots for individual Z-scores can be enabled or disabled to focus on specific metrics.
Dynamic Background Coloring
Visual cues to indicate bullish (green) or bearish (red) financial conditions based on the composite Z-score.
Custom Inputs
Toggle on/off for each financial metric to tailor the indicator to specific use cases.
Customizable parameters for smoothing and moving averages.
Applications
This indicator is versatile and can be effectively used in various trading systems and strategies:
Long-Term Investment Decision-Making: Assess macroeconomic trends for portfolio rebalancing.
Systematic Trading: Incorporate market conditions into algorithmic models to enhance robustness.
Volatility-Based Strategies: Use Z-score fluctuations to anticipate periods of market turbulence or calm.
Credits
This indicator was inspired by and builds upon the work of TomasOnMarkets . While incorporating significant enhancements, it acknowledges the foundational concepts provided by this original source. Thank you for sharing your input on this important indicator. We are honored to use it and to further improve upon it.
-Jeffrey
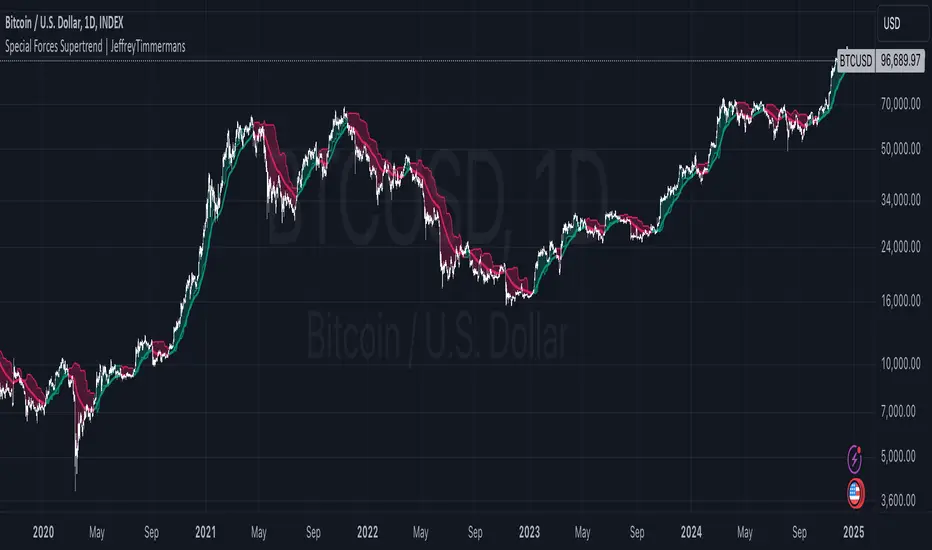
Special Forces Supertrend | JeffreyTimmermansSpecial Forces Supertrend Indicator
The "Special Forces Supertrend" is a cutting-edge trading indicator designed by Jeffrey Timmermans to provide traders with actionable insights into market trends. It combines advanced moving averages with dynamic range calculations to adapt to changing market conditions, ensuring clear and reliable trend identification.
Core Features
Trend Identification:
Integrates a customizable moving average (MA) with multiple types such as SMA, EMA, SMMA, WMA, VWMA, TEMA, DEMA, LSMA, HMA, or ALMA.
Employs a dynamic range calculation using the highest high over a user-defined period, modified by adjustable multipliers.
Offers the option to switch between average range and specific lookback periods for increased adaptability.
Signal Generation:
Scores are calculated based on price action relative to the moving average and dynamic range.
Generates bullish (long) and bearish (short) crossover signals using these scores.
Alerts for long and short conditions are integrated, ensuring traders never miss an opportunity.
Visual Indicators:
Candlestick Coloring: Trends are visually distinguished—greenish hues for bullish conditions and purplish hues for bearish conditions.
Moving Average Line: A semi-transparent, color-coded line dynamically adjusts to match the trend direction for improved clarity.
Range Visualization: A semi-transparent shaded area indicates potential support or resistance levels based on the average range calculation.
Customization Options
Range Settings:
Length: Determines the period for calculating the highest high.
Lookback Alpha & Beta: Enables varied lookback periods for range computation.
Multiplier Alpha & Beta: Fine-tune the range sensitivity using these multipliers.
Use Average Range: Toggle between average range or specific lookback periods for signal generation.
Source Input: Select a data source (e.g., close price) to adapt the range calculation for highly volatile assets.
Moving Average Settings:
Type MA: Choose from multiple moving average methods to suit different trading styles.
Length: Define the length for the moving average calculation.
Source: Specify the price source (default is close price).
Color Customization: Choose personalized colors for bullish and bearish trends to align with your trading environment.
Alerts:
Supertrend Long Alert: Notifies when a bullish crossover is detected.
Supertrend Short Alert: Notifies when a bearish crossover is detected.
How to Use
The Special Forces Supertrend indicator is a versatile tool that excels in identifying and confirming trends.
For optimal performance:
Use it in combination with other indicators or analysis methods to validate signals.
Adjust its parameters to align with specific market instruments or your trading strategy.
This indicator is tailored to meet the needs of both novice and experienced traders, providing flexibility, reliability, and clear visual cues for navigating complex market dynamics.
-Jeffrey
Support Resistance Major/Minor [TradingFinder] Market Structure🔵 Introduction
Support and resistance levels are key concepts in technical analysis, serving as critical points where prices pause or reverse due to the interaction of supply and demand. These foundational elements in price action and classical technical analysis assist traders in understanding market behavior and making better trading decisions.
Support levels are zones where demand is strong enough to prevent further price declines, while resistance levels act as barriers that hinder price increases.
Support and resistance levels are divided into two main types: static and dynamic. Static levels are fixed horizontal lines on charts, formed based on historical price points, and are crucial due to repeated price reactions in these areas.
Dynamic levels, on the other hand, move with market trends and are often identified using tools like moving averages and trendlines. These levels are particularly useful for analyzing dynamic trends and identifying potential reversal points in financial markets.
The importance of support and resistance in technical analysis lies in their ability to pinpoint price reversal or continuation points. Professional traders use these levels to determine optimal entry and exit points and combine them with tools such as Fibonacci retracements or moving averages for precise strategies.
Detailed analysis of price behavior at these levels provides insights into trend strength and the likelihood of price breaks or reversals. By understanding these concepts, technical analysts can forecast future price movements and optimize their trading decisions using tools such as indicators and price action. Support and resistance levels, as a cornerstone of technical analysis, form the foundation for many trading strategies.
🔵 How to Use
The Static Support and Resistance Indicator is a vital tool for identifying significant price zones in financial markets. It automatically detects major and minor support and resistance levels in both short-term and long-term intervals, enabling traders to analyze price behavior accurately and develop optimal entry and exit strategies.
🟣 Major Long-Term Support and Resistance
Major Long-Term Support : The lowest price points recorded over long-term intervals that prevent further declines.
Major Long-Term Resistance : The highest price points in long-term intervals that limit further price increases.
🟣 Minor Long-Term Support and Resistance
Minor Long-Term Support : Temporary halts in price decline within a downtrend over long-term intervals.
Minor Long-Term Resistance : Short-term zones within long-term intervals where prices react negatively in an uptrend.
🟣 Major Short-Term Support and Resistance
Major Short-Term Support : The lowest price points in short-term intervals that act as barriers against sharp price drops.
Major Short-Term Resistance : The highest points in short-term intervals that prevent further price surges.
🟣 Minor Short-Term Support and Resistance
Minor Short-Term Support : Temporary halts in price decline within short-term downtrends.
Minor Short-Term Resistance : Zones where price reacts quickly and reverses in short-term uptrends.
🔵 Settings
Long Term S&R Pivot Period : Defines the interval for identifying long-term support and resistance levels (default: 21).
Short Term S&R Pivot Period : Defines the interval for identifying short-term support and resistance levels (default: 5).
🟣 Long-Term Lines
Major Line Display : Enable/disable major long-term lines.
Minor Line Display : Enable/disable minor long-term lines.
Major Line Colors : Green for support, red for resistance (long-term major levels).
Minor Line Colors : Light green for support, light red for resistance (long-term minor levels).
Major Line Style : Choose between solid, dotted, or dashed lines for major long-term levels.
Minor Line Style : Choose between solid, dotted, or dashed lines for minor long-term levels.
Major Line Width : Adjust the thickness of major long-term lines.
Minor Line Width : Adjust the thickness of minor long-term lines.
🟣 Short-Term Lines
Major Line Display : Enable/disable major short-term lines.
Minor Line Display : Enable/disable minor short-term lines.
Major Line Colors : Gray-green for support, gray-red for resistance (short-term major levels).
Minor Line Colors : Dark green for support, dark red for resistance (short-term minor levels).
Major Line Style : Choose between solid, dotted, or dashed lines for major short-term levels.
Minor Line Style : Choose between solid, dotted, or dashed lines for minor short-term levels.
Major Line Width : Adjust the thickness of major short-term lines.
Minor Line Width : Adjust the thickness of minor short-term lines.
🔵 Conclusion
Static support and resistance levels are among the most critical tools in technical analysis, helping traders identify key reversal or continuation points.
This indicator simplifies and enhances the analysis process by automatically detecting major and minor levels in both short-term and long-term intervals. It allows traders to customize settings to suit their trading strategies and analyze different market levels effectively.
Using this indicator improves price action analysis, enhances market understanding, and identifies trading opportunities. Applicable to all trading styles, from day trading to long-term investing, it is an essential tool for technical analysis.
Combining this indicator with other tools like trendlines, Fibonacci retracements, and moving averages enables comprehensive analysis and allows traders to navigate financial markets with greater confidence.

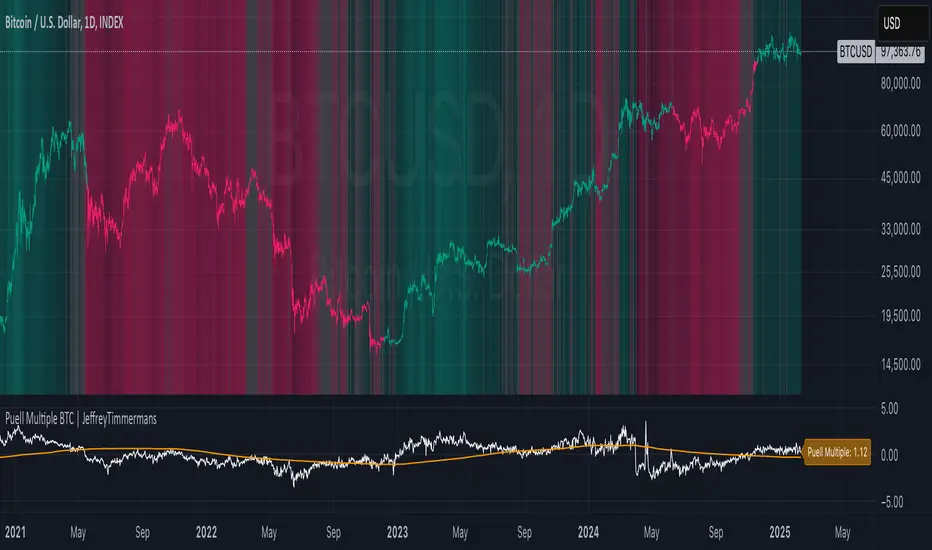
Puell Multiple BTC | JeffreyTimmermansThe Puell Multiple is a metric that assesses the relationship between mining profitability and market cycles. It is calculated by comparing the daily value of newly issued coins (USD) to the 365-day moving average of daily coin issuance (USD).
This indicator works best on the 1D BTC Chart. When interpreting the Puell Multiple, it can generally be understood as follows:
High values indicate that miner profitability is significantly higher than the yearly average. This may lead to an increased incentive for miners to sell off their holdings, putting additional selling pressure on the market.
Low values suggest that miner profitability is lower than the yearly average. In this case, miners might experience financial strain, causing some to reduce their hash power by shutting down mining rigs. This, in turn, can reduce the number of coins being sold into the market, as remaining miners need to liquidate fewer coins to maintain operations, thereby decreasing the impact on the liquid supply.
The Puell Multiple is a metric used primarily in the cryptocurrency space, specifically for Bitcoin, to assess whether Bitcoin is overvalued or undervalued in relation to its mining rewards. It helps to gauge the profitability of miners and, by extension, to assess market conditions.
Use:
This Puell Multiple is invented for Long-Term, Trend Following Systems.
The Puell Multiple trend can be visualized through the color of the bars, which represents the direction of the trend, while the background indicates the strength of that trend.
Bar Color: The color of the bars typically changes to reflect whether the trend is bullish or bearish. For example, green bars may indicate a strong bullish trend, while red bars signal a bearish or declining trend. The color coding helps to quickly interpret the market's overall movement in relation to mining profitability.
Background Color: The background of the chart is used to reflect the strength of the trend. A darker or more intense background may signify a stronger trend, indicating that the market conditions are more pronounced, while a lighter background can suggest a weaker or more uncertain trend, showing less certainty in the market’s direction.
Together, the combination of bar color and background provides a clearer picture of both the trend's direction and its strength, making it easier to assess potential market behavior based on miner profitability and market cycles.
Puell Multiple and Moving Average: They can be used as an extra tool to confirm the bullish or bearish trend. When the Puell Multiple is above the Moving Average, this will suggest and confirm that the trend is bullish.
How you score this for your own systems is up to you.
-Jeffrey

Range Channel by Atilla YurtsevenThis script creates a dynamic channel around a user-selected moving average (MA). It calculates the relative difference between price and the MA, then finds the average of the positive differences and the negative differences separately. Using these averages, it plots upper and lower bands around the MA as well as a histogram-like oscillator to show when price moves above or below the average thresholds.
How It Works
Moving Average Selection
The indicator allows you to choose among multiple MA types (SMA, EMA, WMA, Linear Regression, etc.). Depending on your preference, it calculates the chosen MA for the selected lookback period.
Relative Difference Calculation
It then computes the percentage difference between the source (typically the closing price) and the MA. (diff = (src / ma - 1) * 100)
Positive & Negative Averages
- Positive differences are averaged and represent how far the price typically moves above the MA.
- Negative differences are similarly averaged for when price moves below the MA.
Range Channel & Oscillator
- The channel is plotted around the MA using the average positive and negative differences (Upper Edge and Lower Edge).
- The “Untrended” histogram plots the difference (diff). Green bars occur when price is above the MA on average, and red bars when below. Two additional lines mark the upper and lower average thresholds on this histogram.
How to Use
Identify Overbought/Oversold Zones: The upper edge can serve as a dynamic overbought level, while the lower edge can suggest potential oversold conditions. When the histogram approaches or crosses these levels, it may signal price extremes relative to its average movement.
Trend Confirmation: Compare price action relative to the channel. If price and the histogram consistently remain above the MA and upper threshold, it could indicate a stronger bullish trend. If they remain below, it might signal a prolonged bearish trend.
Entry/Exit Timings:
- Entry: Traders can look for moments when price breaks back inside the channel from an extreme, anticipating a mean reversion.
- Exit: Watching how price interacts with these dynamic edges can help define stop-loss or take-profit points.
Because these thresholds adapt over time based on actual price behavior, they can be more responsive than fixed-percentage bands. However, like all indicators, it’s most effective when used in conjunction with other technical and fundamental tools.
Disclaimer
This script is provided for educational and informational purposes only. It does not guarantee any specific outcome or profit. Use it at your own discretion and risk.
Trade smart, stay safe.
Atilla Yurtseven

HOD/LOD/PMH/PML/PDH/PDL Strategy by @tradingbauhaus This script is a trading strategy @tradingbauhaus designed to trade based on key price levels, such as the High of Day (HOD), Low of Day (LOD), Premarket High (PMH), Premarket Low (PML), Previous Day High (PDH), and Previous Day Low (PDL). Below, I’ll explain in detail what the script does:
Core Functionality of the Script:
Calculates Key Price Levels:
HOD (High of Day): The highest price of the current day.
LOD (Low of Day): The lowest price of the current day.
PMH (Premarket High): The highest price during the premarket session (before the market opens).
PML (Premarket Low): The lowest price during the premarket session.
PDH (Previous Day High): The highest price of the previous day.
PDL (Previous Day Low): The lowest price of the previous day.
Draws Horizontal Lines on the Chart:
Plots horizontal lines on the chart for each key level (HOD, LOD, PMH, PML, PDH, PDL) with specific colors for easy visual identification.
Defines Entry and Exit Rules:
Long Entry (Buy): If the price crosses above the PMH (Premarket High) or the PDH (Previous Day High).
Short Entry (Sell): If the price crosses below the PML (Premarket Low) or the PDL (Previous Day Low).
Long Exit: If the price reaches the HOD (High of Day) during a long position.
Short Exit: If the price reaches the LOD (Low of Day) during a short position.
How the Script Works Step by Step:
Calculates Key Levels:
Uses the request.security function to fetch the HOD and LOD of the current day, as well as the highs and lows of the previous day (PDH and PDL).
Calculates the PMH and PML during the premarket session (before 9:30 AM).
Plots Levels on the Chart:
Uses the plot function to draw horizontal lines on the chart representing the key levels (HOD, LOD, PMH, PML, PDH, PDL).
Each level has a specific color for easy identification:
HOD: White.
LOD: Purple.
PDH: Orange.
PDL: Blue.
PMH: Green.
PML: Red.
Defines Trading Rules:
Uses conditions with ta.crossover and ta.crossunder to detect when the price crosses key levels.
Long Entry: If the price crosses above the PMH or PDH, a long position (buy) is opened.
Short Entry: If the price crosses below the PML or PDL, a short position (sell) is opened.
Long Exit: If the price reaches the HOD during a long position, the position is closed.
Short Exit: If the price reaches the LOD during a short position, the position is closed.
Executes Orders Automatically:
Uses the strategy.entry and strategy.close functions to open and close positions automatically based on the defined rules.
Advantages of This Strategy:
Based on Key Levels: Uses important price levels that often act as support and resistance.
Easy to Visualize: Horizontal lines on the chart make it easy to identify levels.
Automated: Entries and exits are executed automatically based on the defined rules.
Limitations of This Strategy:
Dependent on Volatility: Works best in markets with significant price movements.
False Crosses: There may be false crosses that generate incorrect signals.
No Advanced Risk Management: Does not include dynamic stop-loss or take-profit mechanisms.
How to Improve the Strategy:
Add Stop-Loss and Take-Profit: To limit losses and lock in profits.
Filter Signals with Indicators: Use RSI, MACD, or other indicators to confirm signals.
Optimize Levels: Adjust key levels based on the asset’s behavior.
In summary, this script is a trading strategy that operates based on key price levels, such as HOD, LOD, PMH, PML, PDH, and PDL. It is useful for traders who want to trade based on significant support and resistance levels.

Kalman Step Signals [AlgoAlpha]Take your trading to the next level with the Kalman Step Signals indicator by AlgoAlpha! This advanced tool combines the power of Kalman Filtering and the Supertrend indicator, offering a unique perspective on market trends and price movements. Designed for traders who seek clarity and precision in identifying trend shifts and potential trade entries, this indicator is packed with customizable features to suit your trading style.
Key Features
🔍 Kalman Filter Smoothing : Dynamically smooths price data with user-defined parameters for Alpha, Beta, and Period, optimizing responsiveness and trend clarity.
📊 Supertrend Overlay : Incorporates a classic Supertrend indicator to provide clear visual cues for trend direction and potential reversals.
🎨 Customizable Appearance : Adjust colors for bullish and bearish trends, along with optional exit bands for more nuanced analysis.
🔔 Smart Alerts : Detect key moments like trend changes or rejection entries for timely trading decisions.
📈 Advanced Visualization : Includes optional entry signals, exit bands, and rejection markers to pinpoint optimal trading opportunities.
How to Use
Add the Indicator : Add the script to your TradingView favorites. Customize inputs like Kalman parameters (Alpha, Beta, Period) and Supertrend settings (Factor, ATR Period) based on your trading strategy.
Interpret the Signals : Watch for trend direction changes using Supertrend lines and directional markers. Utilize rejection entries to identify price rejections at trendlines for precision entry points.
Set Alerts : Enable the built-in alert conditions for trend changes or rejection entries to act swiftly on trading opportunities without constant chart monitoring.
How It Works
The indicator leverages a Kalman Filter to smooth raw price data, balancing responsiveness and noise reduction using user-controlled parameters. This refined price data is then fed into a Supertrend calculation, combining ATR-based volatility analysis with dynamic upper and lower bands. The result is a clear and reliable trend-detection system. Additionally, it features rejection markers for bullish and bearish reversals when prices reject the trendline, along with exit bands to visualize potential price targets. The integration of customizable alerts ensures traders never miss critical market moves.
Add the Kalman Step Signals to your TradingView charts today and enjoy a smarter, more efficient trading experience! 🚀🌟

Santa's Adventure [AlgoAlpha]Introducing "Santa's Adventure," a unique and festive TradingView indicator designed to bring the holiday spirit to your trading charts. With this indicator, watch as Santa, his sleigh, Rudolf the reindeer, and a flurry of snowflakes come to life, creating a cheerful visual experience while you monitor the markets.
Key Features:
🎁 Dynamic Santa Sleigh Visualization : Santa's sleigh, Rudolf, and holiday presents adapt to price movements and chart structure.
🎨 Customizable Holiday Colors : Adjust colors for Santa’s outfit, Rudolf’s nose, sleigh, presents, and more.
❄️ Realistic Snow Animation : A cascade of snowflakes decorates your charts, with density and range adjustable to suit your preferences.
📏 Adaptive Scaling : All visuals scale based on price volatility and market dynamics.
🔄 Rotation by Trend : Santa and his entourage tilt to reflect market trends, making it both functional and fun!
How to Use :
Add the Indicator to Your Chart : Search for "Santa's Adventure" in the TradingView indicator library and add it to your favorites. Use the input menu to adjust snow density, sleigh colors, and other festive elements to match your trading style or holiday mood.
Observe the Market : Watch Santa’s sleigh glide across the chart while Rudolf leads the way, with snowflakes gently falling to enhance the visual charm.
How It Works :
The indicator uses price volatility and market data to dynamically position Santa, his sleigh, Rudolf, and presents on the chart. Santa's Sleigh angle adjusts based on price trends, reflecting market direction. Santa's sleigh and the snowstorm are plotted using advanced polyline arrays for a smooth and interactive display. A festive algorithm powers the snowfall animation, ensuring a consistent and immersive holiday atmosphere. The visuals are built to adapt seamlessly to any market environment, combining holiday cheer with market insights.
Add "Santa's Adventure" to your TradingView charts today and bring the holiday spirit to your trading journey, Merry Christmas! 🎅🎄
Quantum RSI Signals Suite [QuantAlgo]Introducing Quantum RSI Signals Suite 🎯💫
The Quantum RSI Signals Suite by QuantAlgo is a sophisticated technical indicator that combines statistical z-score analysis with enhanced trend following to identify market trends and reversals. This premium system integrates normalized RSI readings with multi-timeframe statistical measurements to help traders and investors identify trend direction and potential reversals. By evaluating both RSI dynamics and directional trend analysis together, this tool enables users to make data-driven trading decisions with statistical validation.
🌊 Indicator Architecture
The Quantum RSI Signals Suite provides a unique framework for assessing market trends through a blend of normalized RSI and dynamic trend-weighted z-score calculations. Unlike traditional RSI indicators that use fixed overbought/oversold levels, this system incorporates statistical measurements and directional trend analysis to adjust sensitivity automatically. By combining normalized RSI values with adaptive z-score zones and trend following analysis, it evaluates both current market conditions and historical context, while the statistical parameters ensure stable yet responsive signals. This quantum approach allows users to identify trending conditions while remaining aware of statistical extremes, enhancing both trend-following and mean-reversion strategies.
📊 Technical Composition and Calculation
The Quantum RSI Signals Suite is composed of several technical components that create a dynamic trending system:
RSI Normalization: Utilizes scaled RSI values (-1 to 1) for balanced momentum representation
Z-Score Analysis: Computes statistical significance of RSI movements to determine dynamic zones
Trend Following Analysis: Analyzes historical z-score movements to identify persistent trends
Signal Amplification: Combines z-score with trend analysis for enhanced signal generation
📈 Key Indicators and Features
The Quantum RSI Signals Suite utilizes normalized RSI with customizable length and z-score parameters to adapt to different trading styles. Advanced calculations are applied to determine statistical significance levels, providing context-aware boundaries for trend identification. The trend following component evaluates historical z-score movements to validate signals and identify potential reversals.
The indicator incorporates multi-layered visualization with:
Color-coded histogram and trend representation (bullish/bearish)
Combined statistical and trend-based signals
Dynamic trend-weighted scoring system
Mean reversion signals with distinct markers (⤻/↷)
Gradient fills for better visual clarity
Programmable alerts for trend changes
⚡️ Practical Applications and Examples
✅ Add the Indicator: Add the indicator to your TradingView chart by clicking on the star icon to add it to your favorites ⭐️
👀 Monitor Signals: Watch the final score's position relative to the zero line to identify trend direction and potential reversals. The combined histogram and line visualization makes trend changes clearly visible.
🎯 Track Signals: Pay attention to the mean reversion markers that appear above and below the price chart:
→ Upward triangles (⤻) signal potential bullish reversals when final score crosses above zero
→ X crosses (↷) indicate potential bearish reversals when final score crosses below zero
🔔 Set Alerts: Configure alerts for trend changes in both bullish and bearish directions, ensuring you can act on significant technical developments promptly.
🌟 Summary and Tips
The Quantum RSI Signals Suite by QuantAlgo is a sophisticated technical tool, designed to support both trend following and mean reversion strategies across different market environments. By combining normalized RSI analysis with statistical z-score measurements and trend following analysis, it helps traders and investors identify significant trend changes while measuring statistical extremes, providing validated signals. The tool's adaptability through customizable RSI length, z-score parameters, and trend analysis settings makes it suitable for various trading timeframes and styles, allowing users to capture opportunities while maintaining awareness of statistical market conditions.
Key parameters to optimize for your trading or investing style:
RSI Length: Adjust for more or less sensitivity to price changes (default: 14)
Z-Score Length: Fine-tune the statistical window for signal stability (default: 20)
Trend Analysis Range: Balance historical context with current market conditions
Source Data: Customize price input for specialized strategies

LRI Momentum Cycles [AlgoAlpha]Discover the LRI Momentum Cycles indicator by AlgoAlpha, a cutting-edge tool designed to identify market momentum shifts using trend normalization and linear regression analysis. This advanced indicator helps traders detect bullish and bearish cycles with enhanced accuracy, making it ideal for swing traders and intraday enthusiasts alike.
Key Features :
🎨 Customizable Appearance : Set personalized colors for bullish and bearish trends to match your charting style.
🔧 Dynamic Trend Analysis : Tracks market momentum using a unique trend normalization algorithm.
📊 Linear Regression Insight : Calculates real-time trend direction using linear regression for better precision.
🔔 Alert Notifications : Receive alerts when the market switches from bearish to bullish or vice versa.
How to Use :
🛠 Add the Indicator : Favorite and apply the indicator to your TradingView chart. Adjust the lookback period, linear regression source, and regression length to fit your strategy.
📊 Market Analysis : Watch for color changes on the trend line. Green signals bullish momentum, while red indicates bearish cycles. Use these shifts to time entries and exits.
🔔 Set Alerts : Enable notifications for momentum shifts, ensuring you never miss critical market moves.
How It Works :
The LRI Momentum Cycles indicator calculates trend direction by applying linear regression on a user-defined price source over a specified period. It compares historical trend values, detecting bullish or bearish momentum through a dynamic scoring system. This score is normalized to ensure consistent readings, regardless of market conditions. The indicator visually represents trends using gradient-colored plots and fills to highlight changes in momentum. Alerts trigger when the momentum state changes, providing actionable trading signals.

Resistance & SupportThis indicator combines multiple analytical methods to calculate potential support and resistance levels for the upcoming trading day, leveraging historical price data. The calculations are based on three key areas:
Pivot Points: These are calculated using the previous day's high, low, and close values to provide central price levels, along with first and second-level support and resistance (S1, S2, R1, R2). These levels are commonly used in technical analysis and can serve as reference points for market entries and exits.
3-Day Price Average (3DBP): This value provides a short-term trend signal by averaging the high, low, and close prices over the past three days. The indicator helps identify whether the market has been trading at higher or lower levels recently, which can signal bullish or bearish trends.
Trend Detection: The script also includes a short-term and long-term trend analysis:
Short-Term Trend: The prior day’s 3DBP is compared to the previous day’s 3DBP to gauge the market's short-term direction.
Long-Term Trend: The prior close is compared to the open from 50 days ago, offering an indication of the overall market trend.
These components work together to provide actionable insights on potential entry points. For example:
In a bullish market, support levels may act as potential entry points for long trades when the price retraces.
In a bearish market, resistance levels may act as potential entry points for short trades upon price rejection.
The Trend Table at the top right of the chart displays the short-term and long-term trend information for quick reference. It shows whether the trends are bullish or bearish based on the calculations above.
While originally optimized for the EUR/USD currency pair, this indicator can be applied to other forex pairs. However, results may vary depending on the instrument, and further testing is recommended for non-EUR/USD pairs.
Usage Notes:
Pivot points can often act as both support and resistance. While they provide useful reference levels, in volatile markets, these levels may not always hold. Tight stop-losses are recommended if trading near these levels.
The 3DBP offers insight into past market behavior, and although it’s not guaranteed to act as support or resistance, it can help identify zones of interest in the short term.
This indicator is designed to provide a structured approach to price action analysis, incorporating widely-recognized methods like pivot points and trend detection, while adding unique elements like the 3DBP to enhance its utility.
Linear Regression Intensity [AlgoAlpha]Introducing the Linear Regression Intensity indicator by AlgoAlpha, a sophisticated tool designed to measure and visualize the strength of market trends using linear regression analysis. This indicator not only identifies bullish and bearish trends with precision but also quantifies their intensity, providing traders with deeper insights into market dynamics. Whether you’re a novice trader seeking clearer trend signals or an experienced analyst looking for nuanced trend strength indicators, Linear Regression Intensity offers the clarity and detail you need to make informed trading decisions.
Key Features:
📊 Comprehensive Trend Analysis: Utilizes linear regression over customizable periods to assess and quantify trend strength.
🎨 Customizable Appearance: Choose your preferred colors for bullish and bearish trends to align with your trading style.
🔧 Flexible Parameters: Adjust the lookback period, range tolerance, and regression length to tailor the indicator to your specific strategy.
📉 Dynamic Bar Coloring: Instantly visualize trend states with color-coded bars—green for bullish, red for bearish, and gray for neutral.
🏷️ Intensity Labels: Displays dynamic labels that represent the intensity of the current trend, helping you gauge market momentum at a glance.
🔔 Alert Conditions: Set up alerts for strong bullish or bearish trends and trend neutrality to stay ahead of market movements without constant monitoring.
Quick Guide to Using Linear Regression Intensity:
🛠 Add the Indicator: Simply add Linear Regression Intensity to your TradingView chart from your favorites. Customize the settings such as lookback period, range tolerance, and regression length to fit your trading approach.
📈 Market Analysis: Observe the color-coded bars to quickly identify the current trend state. Use the intensity labels to understand the strength behind each trend, allowing for more strategic entry and exit points.
🔔 Set Up Alerts: Enable alerts for when strong bullish or bearish trends are detected or when the trend reaches a neutral zone. This ensures you never miss critical market movements, even when you’re away from the chart.
How It Works:
The Linear Regression Intensity indicator leverages linear regression to calculate the underlying trend of a selected price source over a specified length. By analyzing the consistency of the regression values within a defined lookback period, it determines the trend’s intensity based on a percentage tolerance. The indicator aggregates pairwise comparisons of regression values to assess whether the trend is predominantly upward or downward, assigning a state of bullish, bearish, or neutral accordingly. This state is then visually represented through dynamic bar colors and intensity labels, offering a clear and immediate understanding of market conditions. Additionally, the inclusion of Average True Range (ATR) ensures that the intensity visualization accounts for market volatility, providing a more robust and reliable trend assessment. With customizable settings and alert conditions, Linear Regression Intensity empowers traders to fine-tune their strategies and respond swiftly to evolving market trends.
Elevate your trading strategy with Linear Regression Intensity and gain unparalleled insights into market trends! 🌟📊
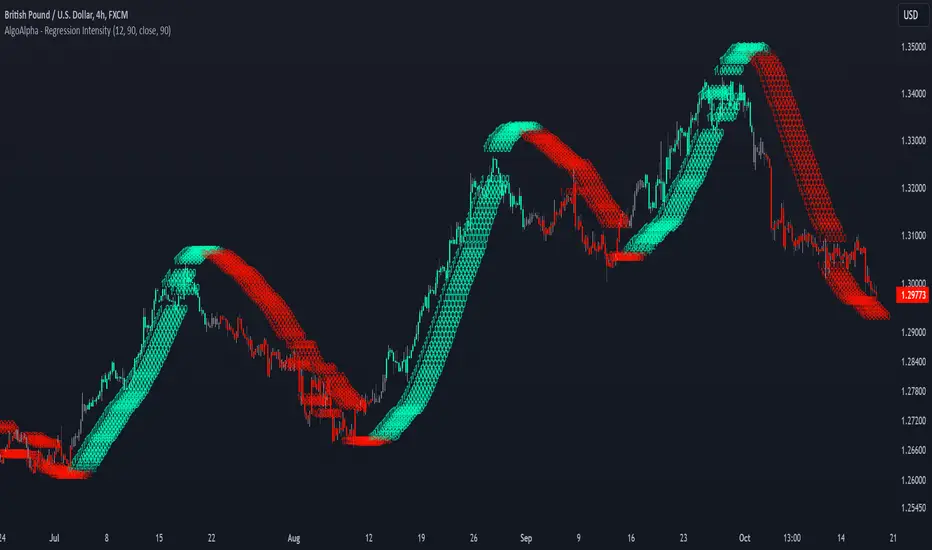
EMA Volatility Channel [QuantAlgo]EMA Volatility Channel 🌊📈
The EMA Volatility Channel by QuantAlgo is an advanced technical indicator designed to capture price volatility and trend dynamics through adaptive channels based on exponential moving averages. This sophisticated system combines EMA-based trend analysis with dynamic volatility-adjusted bands to help traders and investors identify trend direction, potential reversals, and market volatility conditions. By evaluating both price momentum and volatility together, this tool enables users to make informed trading decisions while adapting to changing market conditions.
💫 Dynamic Channel Architecture
The EMA Volatility Channel provides a unique framework for assessing market trends through a blend of exponential moving averages and volatility-based channel calculations. Unlike traditional channel indicators that use fixed-width bands, this system incorporates dynamic volatility measurements to adjust channel width automatically, helping users determine whether price movements are significant relative to current market conditions. By combining smooth EMA trends with adaptive volatility bands, it evaluates both directional movement and market volatility, while the smoothing parameters ensure stable yet responsive channel adjustments. This adaptive approach allows users to identify trending conditions while remaining aware of volatility expansions and contractions, enhancing both trend-following and reversal strategies.
📊 Indicator Components & Mechanics
The EMA Volatility Channel is composed of several technical components that create a dynamic channel system:
EMA Midline: Calculates a smoothed exponential moving average that serves as the channel's centerline, providing a clear reference for trend direction.
Volatility Measurement: Computes average price movement to determine dynamic channel width, adapting to changing market conditions automatically.
Smooth Band Calculation: Applies additional smoothing to the channel bands, reducing noise while maintaining responsiveness to significant price movements.
📈 Key Indicators and Features
The EMA Volatility Channel combines various technical tools to deliver a comprehensive analysis of market conditions.
The indicator utilizes exponential moving averages with customizable length and smoothing parameters to adapt to different trading styles. Volatility calculations are applied to determine channel width, providing context-aware boundaries for price movement. The trend detection component evaluates price action relative to the channel bands, helping validate trends and identify potential reversals.
The indicator incorporates multi-layered visualization with color-coded channels and bars to signal both trend direction and market position. These adaptive visual cues, combined with programmable alerts for channel breakouts, help traders and investors track both trend changes and volatility conditions, supporting both trend-following and mean-reversion strategies.
⚡️ Practical Applications and Examples
✅ Add the Indicator: Add the indicator to your TradingView chart by clicking on the star icon to add it to your favorites ⭐️
👀 Monitor Channel Position: Watch the price position relative to the channel bands to identify trend direction and potential reversals. When price moves outside the channel, consider potential trend changes or extreme conditions.
🔔 Set Alerts: Configure alerts for channel breakouts and trend changes, ensuring you can act on significant technical developments promptly.
🌟 Summary and Tips
The EMA Volatility Channel by QuantAlgo is a versatile technical tool, designed to support both trend following and volatility analysis across different market environments. By combining smooth EMA trends with dynamic volatility-based channels, it helps traders and investors identify significant price movements while measuring market volatility, providing reliable technical signals. The tool's adaptability across timeframes makes it suitable for both trend-following and reversal strategies, allowing users to capture opportunities while maintaining awareness of changing market conditions.
