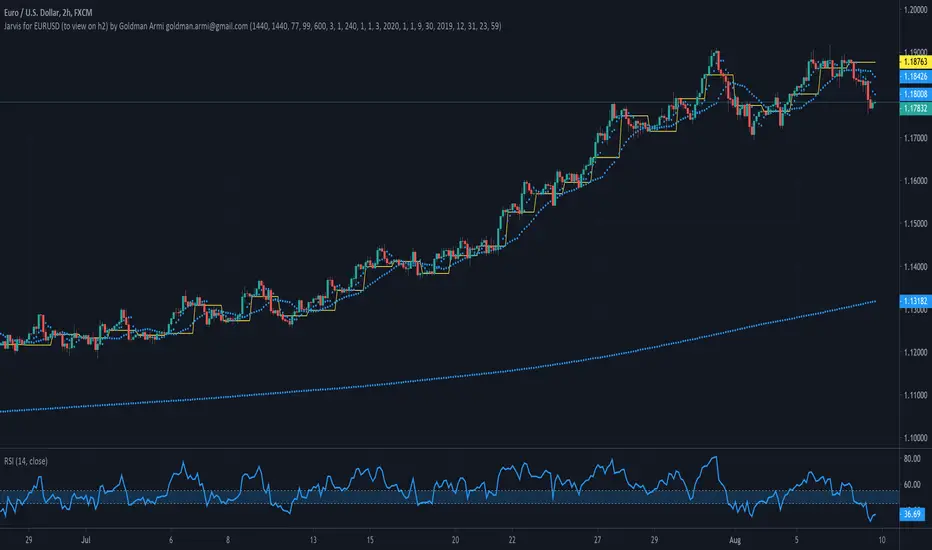
Jarvis for EURUSD by Goldman ArmiThis strategy is called JARVIS after the famous AI from the MARVEL movie Iron Man.
It is an improvement of the Copernicus Strategy to get better results. More exactly I was aiming to obtain over 50% of the number of trades profitable, for every pair provided (see the title).
The strategy tester does not include leverage trading, please keep that in mind and feel free to change the parameters of the volume for the position in the strategy settings to see the closer to reality results.
The setup for this strategy is more complicated because it includes 3 averages, all of them calculated with prices obtain by various formulas for each one of them and I call this: Sophisticated Moving Average (Copyright). Each of the 3 averages are applied to different timeframes and have different values. All of these parameters are configured separately for every trading pair and this is why I am publishing them separately.
There are not a lot of trades in this strategy, the average is around 3/month for EURUSD and the result you see in this strategy is from January 2020 to this date of publishing.
You can use the Tradingview alert services to configure this to execute (webhook) on your exchange/broker, because strategies have now the possibility to send alerts.
For other questions please send me a message.
دولار أمريكي
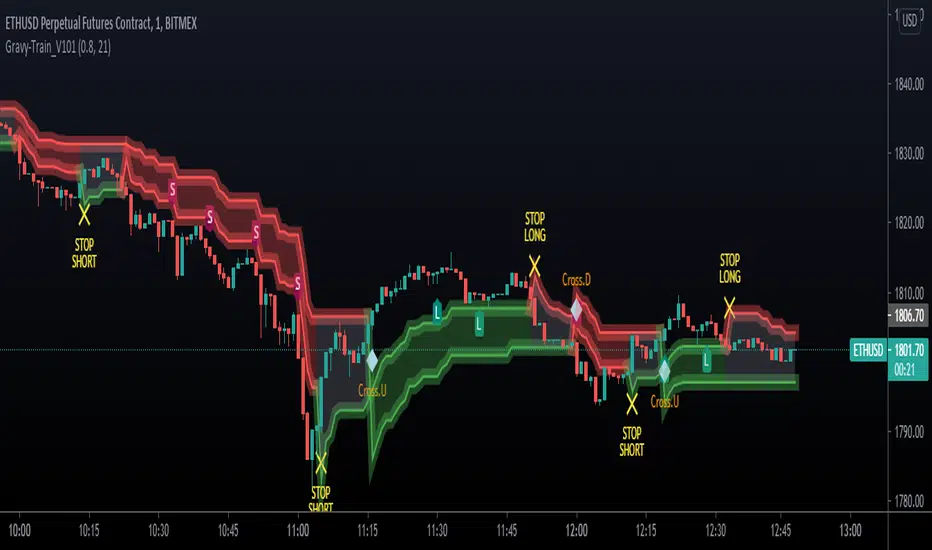
UTG - Gravy TrainThe most complex indicator we've ever developed.
Works on ALL MARKETS!
Gravy Train is a ALL IN ONE - ONE GLANCE indicator.
- It allows you to gauge trend, gives you appropriate LONG & SHORT identifiers
- It identifies when the trades should be over
- Cloud based support & resistance Zones drawn on the chart
- It keeps you OUT of the market in areas of indecision
- It works on ALL timeframes
- Takes the emotion out of trading various markets
- Gravy Train is Unity Trading Groups bread and butter for Scalping, Swing Trading, Position Trading & Day Trading
Unity Trading Group is proud to present Gravy Train!
To gain access to this script, you can find our details in our Signature, use the links below to find out!
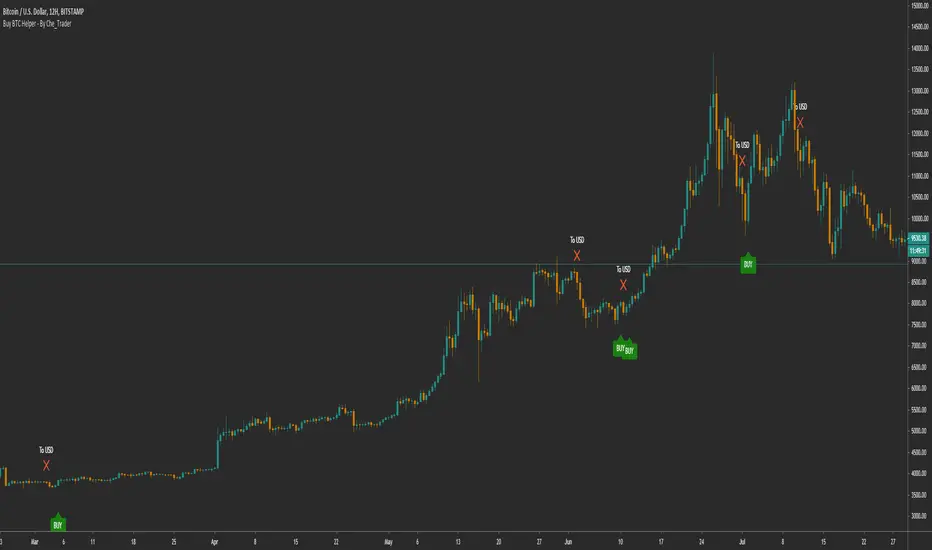
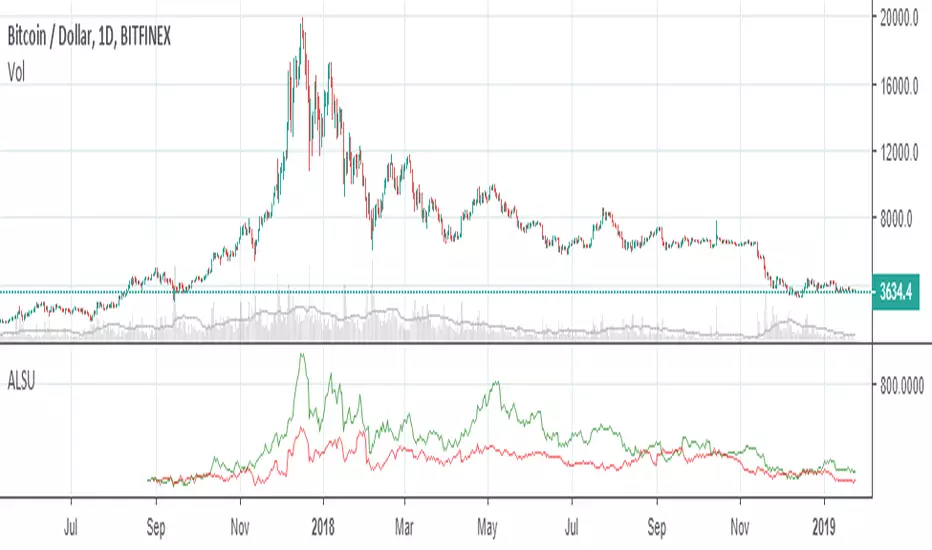
Buy BTC Helper - Buy SPOT, sell to USD (BTC-ETH) - By Che_TraderBuy BTC Helper - Buy SPOT, sell to USD (BTC-ETH) - By Che_Trader
The Buy Helper is specially designed for users who want to invest in BTC in the long term.
Usually you will make about 20-25 trades per year in spot trading.
You do not need a margin account or understand anything about trading.
Just follow the "BUY" and "To usd" signals to make sure you are on trend when BTC goes up but also take profit when BTC starts going down.
This simple tool has beaten the HOLD in all the years tested, also in bull trend or bear trend.
We'll develop this better.
*****************************************************************************************************************************************************************************
General stats from 2017 to 2020 are in the bottom, These are:
(**All data include 0.15% fees+slippage what is more than double the normal fees**)
- 8462% Gains (compound)
- 72 transactions
- 3.238 Profit Factor
- 18.58% Max drawdown
*****************************************************************************************************************************************************************************
The year-by-year analysis is very interesting:
*****************************************************************************************************************************************************************************
2017 HOLD result
+1254%
Buy helper 2017 results:
- +1214.5 % Gains
- 19 transactions
- 11% max drawdown
The 2017 profits are very similar, so you can expect similar win in next bull run.
This is something you'd expect, but it's hard to get in a bot.
*****************************************************************************************************************************************************************************
*****************************************************************************************************************************************************************************
2018 Hold Result
-71%
Buy helper 2018 results:
- +59% Gains
- 21 transactions
- 13.53% max drawdown
These results are particularly impressive. In a year in which BTC declined 72% and with a strategy of only LONG,
that is, without being able to take profit from the crashes,
we were able to finish the year with more than 59% of the money we made on the 2017 bull run.
*****************************************************************************************************************************************************************************
*****************************************************************************************************************************************************************************
2019 Hold Result
+94%
Buy helper 2019 results:
- +202% Gains
- 20 transactions
- 10.4% max drawdown
In 2019 with the buy helper you gained +100% the performance of hold BTC
*****************************************************************************************************************************************************************************
*****************************************************************************************************************************************************************************
2020 Hold Result (up to 04 may 2020)
+24.5%
Buy helper 2020 results:
- +39% Gains
- 11 transactions
- 15.43% max drawdown
In 2020 with the buy helper you gained +50% the performance of hold BTC
*****************************************************************************************************************************************************************************
*****************************************************************************************************************************************************************************
To get access, you can send me a PM here or at a link in the tradingview profile.
*****************************************************************************************************************************************************************************
Takashi Triangular Arbitrage | 2nd Gen | [Alerts]Spot discrepancies between three currencies: these opportunities are rare and usually benefit to traders using advanced programs. You can now set up alerts and discover those for yourself.
This indicator signals opportunities for executing triangular arbitrage. Triangular arbitrage is the result of a discrepancy between three different currencies that occurs when the currency's exchange rates do not exactly match up. These opportunities are more frequent at cryptocurrency markets. The trader would exchange an amount at one rate (Currency_B/Currency_A), convert it again (Currency_C/Currency_B) and then convert it finally back to the original (Currency_C/Currency_A), and assuming low transaction costs, net a profit.
Example:
As per standard inputs, the trader would use US dollars to buy BTC (BITFINEX:BTCUSD), use BTC to buy NEO (BITFINEX:NEOBTC), use NEO to buy US dollars back (BITFINEX:NEOUSD). Whenever the quantity of US dollars bought back is higher than 1% from the initial amount, the indicator will send an alert signaling an arbitrage possibility.
Disclaimer: triangular arbitrage requires advanced automation tools and is only possible if there is enough liquidity to quickly execute all 3 trades at prices used on the indicator.
Inputs
Symbol 1
Symbol input. First step currency to initiate triangular arbitrage. (Currency_B/Currency_A)
Symbol 2
Symbol input. Second step currency to continue triangular arbitrage. (Currency_C/Currency_B)
Symbol 3
Symbol input. Final step currency to finalize triangular arbitrage. (Currency_C/Currency_A)
Discrepancy %
Float input. Amount in percent of profit return after triangular arbitrage is finished. Transaction fees not included.
To get access to this and other scripts check links below.

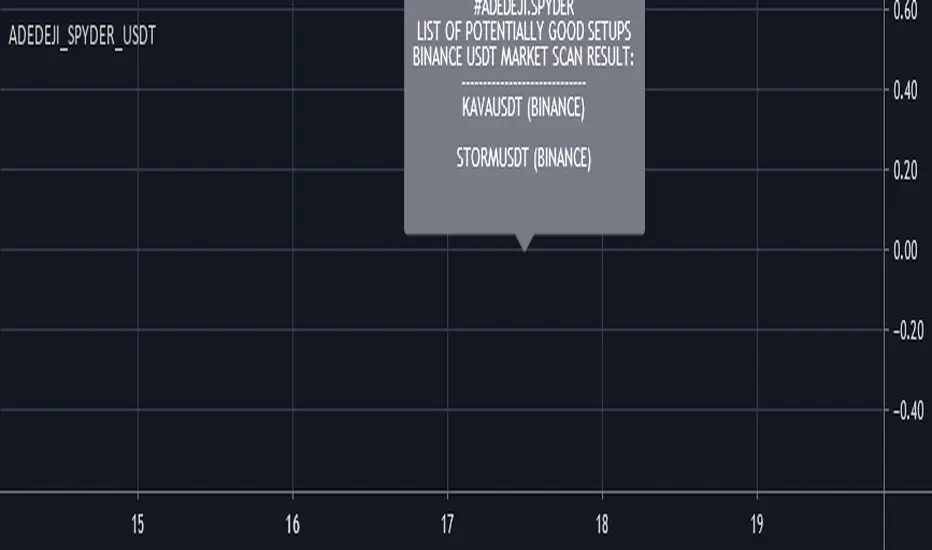
Adedeji_Spyder_USDTLike the previously published Adedeji.Spyder.v1.0 (), this indicator is a scanner; it scans only Binance USDT markets for tickers that meet certain conditions favorable for potential positive price action movements. It significantly and greatly reduces the time required for you to scan the market looking for great setups so you can focus on your entries.
It works efficiently for majority of the most commonly used time-frames (15m, 30m, 45m, 1H, 2H, 3H, 4H, 6H, 12H, 18H, 1D, 2D, 3D and 1W).
Tool is best used in conjunction with my other scripts:
1. Cynotronic Divergence tool (www.tradingview.com) or any other reliable momentum indicator
2. Adedeji_Edge (www.tradingview.com)
How to use:
Simply add the indicator to your chart, wait for the scan/search to be complete and the result displayed. Go to any of the pairs and as you normally would, time your entries by using Adedeji_Edge_v1.1
It's advised to keep a keen eye on demand and supply zones (draw relevant SUP, RES as well as dynamic trendlines on the charts) as targets and take profit zones. The suggested divergence tool gives reliable indication of areas where there is strength or weakness.
This tool scans only 40 tokens/coins on Binance USDT market. The list is not automatically generated; it will be updated regularly.
Development/improvement is a continuous thing!
Disclaimer:
Past performance does not guarantee future results. This tool/indicator is for educational purposes. As always you should fully understand there are high risks involved when trading cryptocurrencies and other digital instruments.
[astropark] Bullish Bearish Divergences for all OscillatorsDear Followers,
today a new great Scalper Tool , which works excellent on all timeframes and charts , both FOREX and Cryptocurrencies!
It alerts you when a new divergence has been spotted on the chart based on your preferred oscillator or set of oscillators ( yes, you can combine them! )
Here the list of currently supported oscillators (more in the future):
RSI (Relative Strength Index)
MACD
MACD Histogram
Stochastic
Stochastic RSI
CCI (Commodity Channel Index)
Momentum
Volume Oscillator
OBV (On Balance Volume)
VWmacd
Bollinger Bands %B
William %R
Chaikin Money Flow
Chaikin Oscillator
AO (Awesome Oscillator)
DPO (Detrended Price Oscillator)
Ultimate Oscillator
RVI (Relative Volatility Index)
Klinger Oscillator
This script will let you set all notifications you may need in order to be alerted on each triggered divergence (both regular and hidden).
This script:
works on all timeframes , starting from 1 minute: so you can enjoy high-frequency trading by using a 24/7 running bot and a proper money and risk management strategy if you like
shows you both bullish and bearish divergences, both regular and hidden , with a triangle up or down respectively
lets you activate more than one oscillator at the same time
lets you choose to be alerted only if all active oscillators agree on spotted divergence , so you will get only stronger and more secure ones (you can set both all or at least a configurable number of enabled oscillators)
lets you edit basic configuration settings of each oscillator
lets you disable or enable hidden divergences on chart
This is a premium indicator , so send me a private message in order to get access to this script.

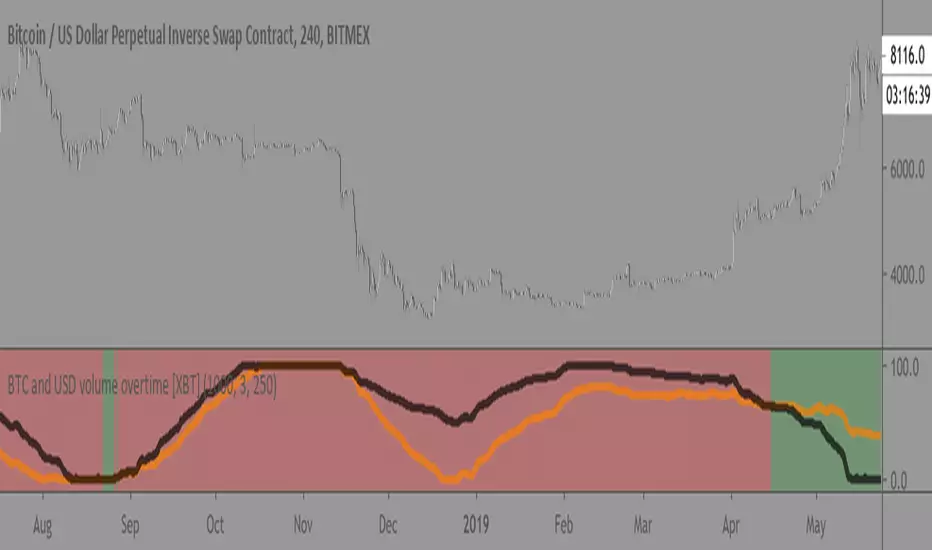
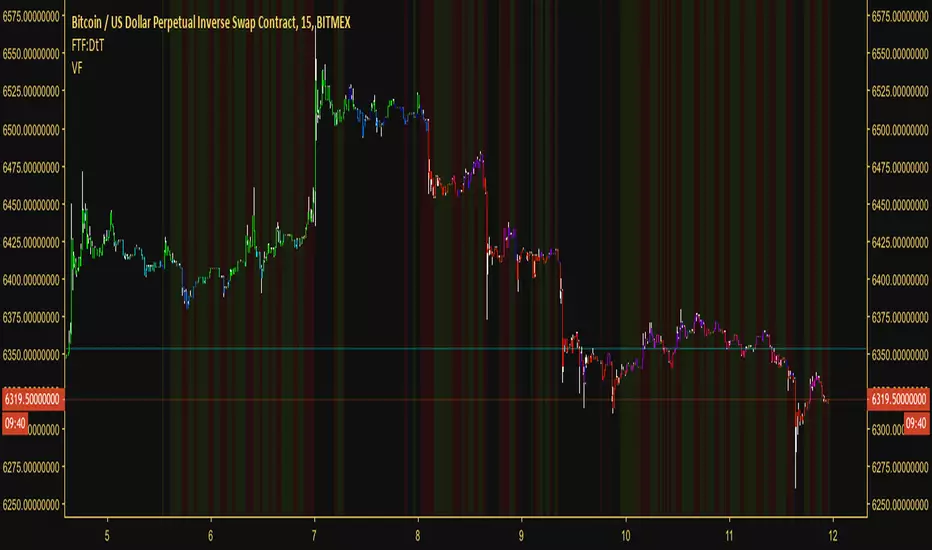
BTC and USD volume overtime [XBT]Compares BTC volume vs USD volume overtime
Best used on 4hr timeframe. Not really some crazy alpha but good overview/statistic to keep track of.
(make sure to use on XBTUSD pair since it isnt using security calls to call the data)
Enjoy!
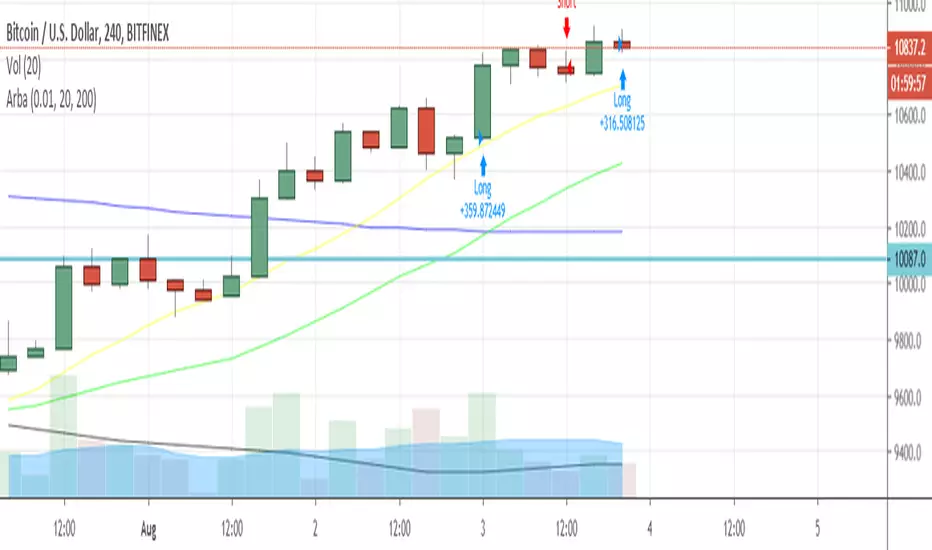
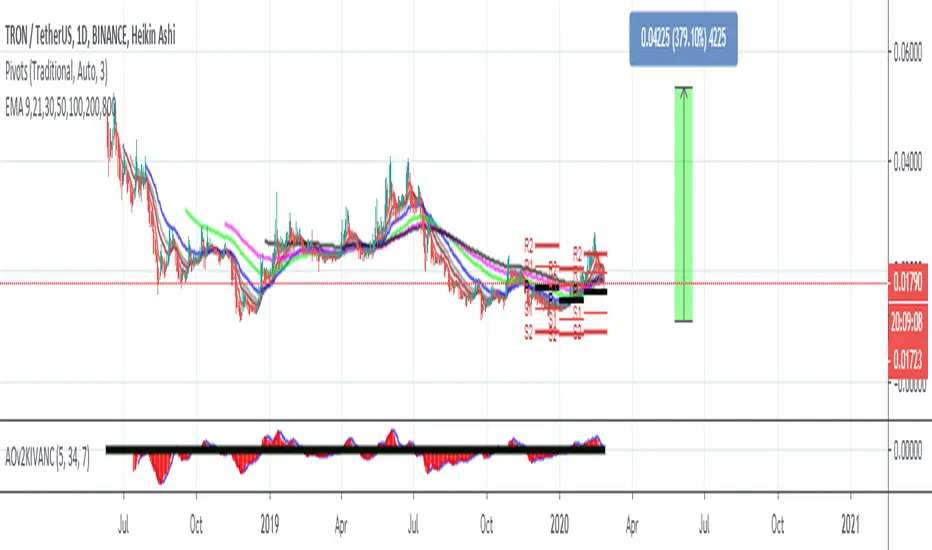
ArbaArba is a trading strategy automation to use in ranges of 4H and D and it may be configured by setting up the ranges of slow simple moving average and fast simple moving average.
The strategy filters in a number of possibilities for possible entries and exits for this specific pair.
You can use it connected to your Poloniex API keys to make automated trading in the above-mentioned timeframes.
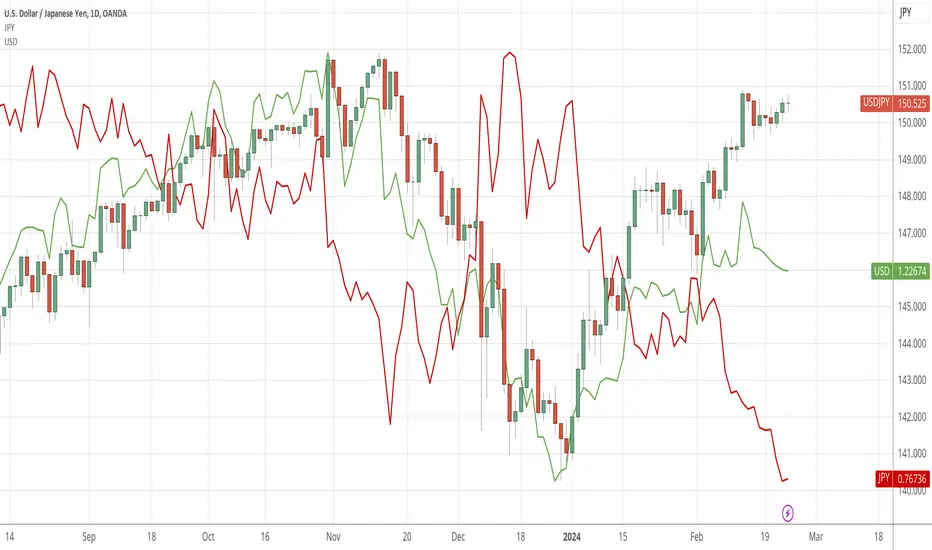
USD Relative Strength Comparison (RSC)Simple indicator implementing relative strength against the equally weighted basket of major currencies. Perhaps I will coin it the Equally Weighted Index (EWI) and trademark it like ICE did with DXY.
usd = (usdjpy/100 + usdcad + 1/gbpusd + 1/eurusd + usdchf + 1/audusd + 1/nzdusd)/7
DXY is hard to compare against other indices because of it's weightening. Secondly it does not compare against all majors and includes SEK which is not a major currency. Source: Wikipedia .
In this chart it becomes more clear why GU is in an uptrend. From April 25th USD has been consolidating against the basket of majors while GBP has gained in strength against the same basket.
gbp = (gbpusd + gbpjpy/100 + gbpcad + 1/eurgbp + gbpchf + gbpaud + gbpnzd)/7
ETHUSDSHORTS+ETHUSDLONGS - Bitfinex ETH Shorts & Longs & TotalBitfinex ETH Shorts & Longs & Total
There is "Shorts" & "Longs" & "Shorts + Longs" & "Shorts - Longs"

BTC Aggregate USD Volumeaggregated USD volume of BTC from Bittrex, Poloniex, OkCoin, Gemini, Binance, Bitstamp, Kraken, Bitfinex, Bitmex (leveraged), and Coinbase

All Longs Shorts USDSummary longs, shorts of cryptos ( BTC ETH EOS XRP LTC XMR) in millions USD on Bitfinex.
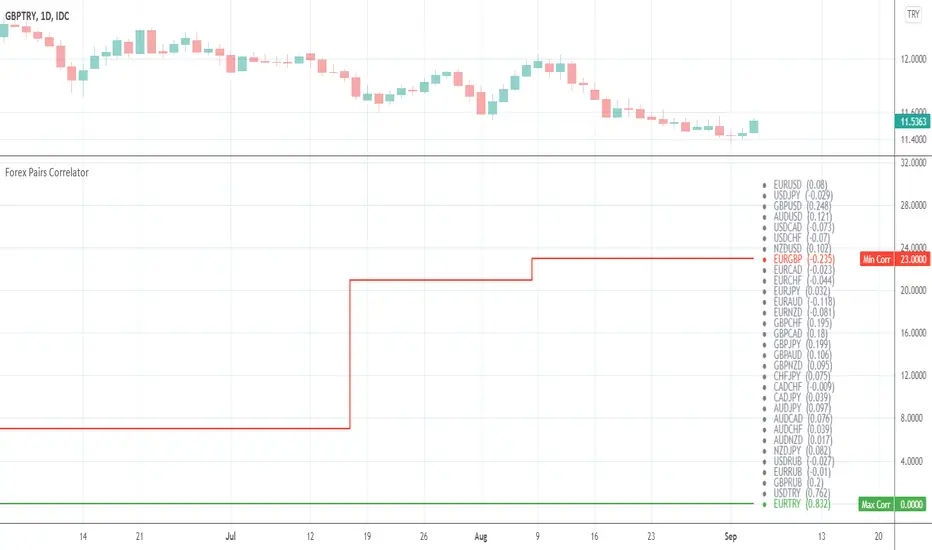
Forex Pairs CorrelatorHi everyone!
This tool helps to identify the best positive and negative correlated pairs from 38 well-known Forex pairs.
By default it will find the best correlations for your current ticker.
If you are a newbie in Correlation Analysis you can find a brief explanation here .
Settings
Lookback for correlations (default: 14 )
Option to use or not to use current ticker (default: true )
Custom ticker (default: EURUSD )
Choose as many pairs as you want from 38 available pairs.
Available pairs
USDCAD
USDMXN
USDBRL
USDCHF
USDRUB
USDTRY
USDZAR
USDJPY
USDCNY
CADCHF
CADJPY
CHFJPY
EURUSD
EURCAD
EURGBP
EURCHF
EURRUB
EURTRY
EURJPY
EURCNY
EURAUD
EURNZD
GBPUSD
GBPCAD
GBPCHF
GBPRUB
GBPJPY
GBPCNY
GBPAUD
GBPNZD
AUDUSD
AUDCAD
AUDCHF
AUDJPY
AUDCNY
AUDNZD
NZDUSD
NZDJPY
Cheers!
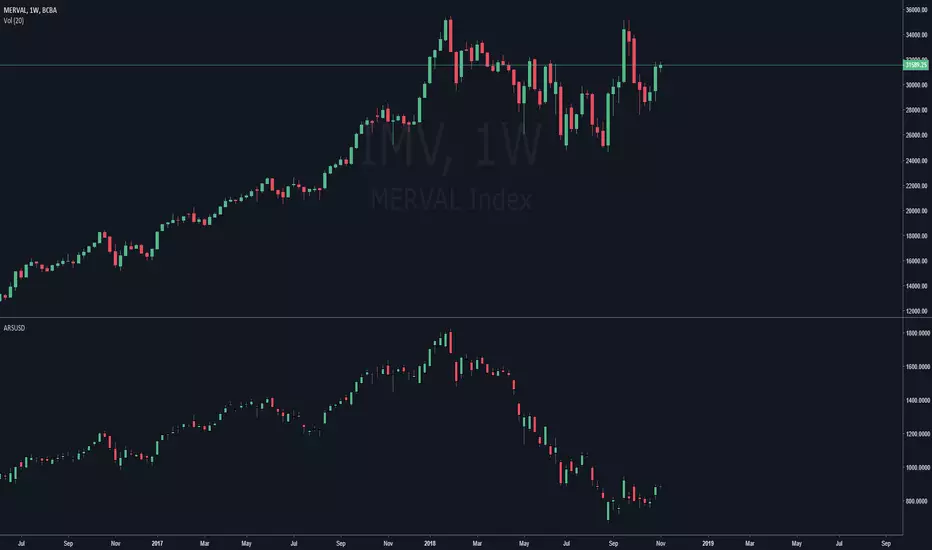
ARSUSD Currency ConverterCandles drawing with currency conversion of ARS to USD. Real Time price of USD used in the calculation is obtained from the USDARS ticker.
Forex Correlations HeatmapHello friends,
This tool is built for forex traders who want a clean, visual way to understand how currency pairs move together. It builds a color-coded correlation matrix between your current chart symbol and a customizable list of forex pairs, helping you quickly spot strong positive or negative relationships across majors, crosses, and extended FX watchlists.
🛠️ How It Works
You provide a comma-separated watchlist of forex tickers (e.g., EURUSD,USDJPY,GBPUSD,...). The script then:
Filters this list based on your selected Display Mode (All pairs, or only AUD, CAD, CHF, EUR, GBP, JPY, NZD, or USD-related pairs).
Paginates long watchlists into pages of up to 40 tickers , so you can scroll through large FX universes without overloading the chart.
For each pair on the current page, it calculates the Pearson correlation over a user-defined lookback window, using your chosen price source (close, HL2, HLC3, etc. via the custom source selector).
The resulting correlations are plotted as a heatmap: each cell's color and intensity reflect the strength and direction of the relationship.
You can switch between multiple professional color palettes to better match your visual preferences and quickly distinguish strong positive, strong negative, and neutral correlations.
🔥 Key Features
Custom watchlist input via a simple text area (paste or type your pairs)
Pagination support - view up to 40 symbols per page for smoother performance
Flexible Display Modes : All pairs, or focused views like AUD pairs, EUR pairs, USD pairs, etc.
Configurable correlation lookback period
Customizable correlation source via an advanced source selector module
Multiple professional color palettes : Blue/Red, Blue/White/Red, Green/Pink, Green/Red, Green/Yellow/Red, Purple/Orange, Spectral, Viridis
Clear visual mapping of correlation strength and sign through color intensity
👋 Good luck and happy trading!
Paid script

U&Dif price has moved up since 1 to 3 candles ago = buy
if price has moved down since 1 to 3 candles ago = sell
has internal SL & TP
tested on
BITFINEX:ETHUSD
BITFINEX:BTCUSD
BITFINEX:LTCUSD
BITFINEX:ETHBTC
4 hour charts

Volatility FilterOver the past few weeks (as of today, which is: 12th of October 2018) there has been little to no volatility in most of the major cryptocurrencies. What volatility does come in comes and goes very quickly. It's difficult to discern good and bad moments to be in a trade. As a result I decided to create a volatility filter based on Hurst exponent market phases, Bollinger Band width, moving averages, volume and the average true range. The results are the above.
You can use this indicator against any asset or within any market. It actually reaps excellent results against the DJI and XAUUSD One of my suggested uses for it is if you're scalping, only enter a position when there is volatility (when there's no background color present). If you're swinging, only enter a position when there's low volatility (when the red background color is present).
Another way to use it (although this isn't intended, just incidental) is to take a position in the direction of the first bar after the red background has gone/after low volatility has passed. So if we get a declining candle when we exit a low volatility zone, short. Otherwise long. This is the experimental side of it though.
However, this indicator won't tell you what direction to trade in, so in order to get use from it I suggest having a trend filter and a trigger. Luckily these two things are in most traders' arsenal. If not, take a look at my other script which is a timelessly brilliant trigger for buying and selling:
Something else to consider is that the volatility is relative. If we go through a period of incredibly high volatility then afterwards we can sometimes expect the volatility filter to plot a red background even though there is still acceptable volatility left in the market. The volatility at that point is much less than the volatility beforehand.
With all that said, this easy-to-read tool will help you avoid flat periods when scalping and, conversely, help you determine good times to enter a swing trade. For those who had difficulty trading the markets as of late due to volatility, this indicator is perfect for you
Access to the filter is provided for 10$, payable in most low-transaction-fee cryptocurrencies. Access is limited to 250 customers. For more information message me through TradingView or message @overttherainbow through Telegram.
Have a nice day and good luck trading.
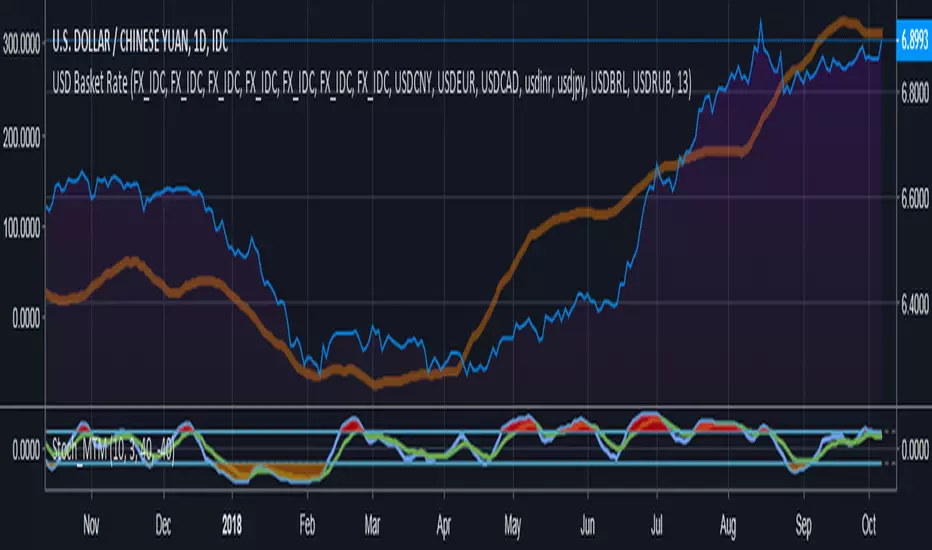
Compare currency against multiple (Basket of currencies)Early version of a script to compare one currency against multiple to get an index.
Default values loaded basically make something along the lines of, "USD global exchange rate"
I plan on making this less clunky/messy in future with respect to the coding and the user inputs. Works 100% right now though.
Bitcoin StableCoins Histogram -- @CryptoNTezThe script will let you see the histogram volume of TrueUSD -- USDTether -- USD or the combination of them.
The values are being pulled from all the available pairs in Tradingview. Once new pairs hit the site I will be adding them aswell
enjoy :)

BTCUSDT 4H Entry Exit, 21% Gain BacktestBTCUSDT 4H Entry Exit, 21% Gain Backtest
Only tested on 4H chart.

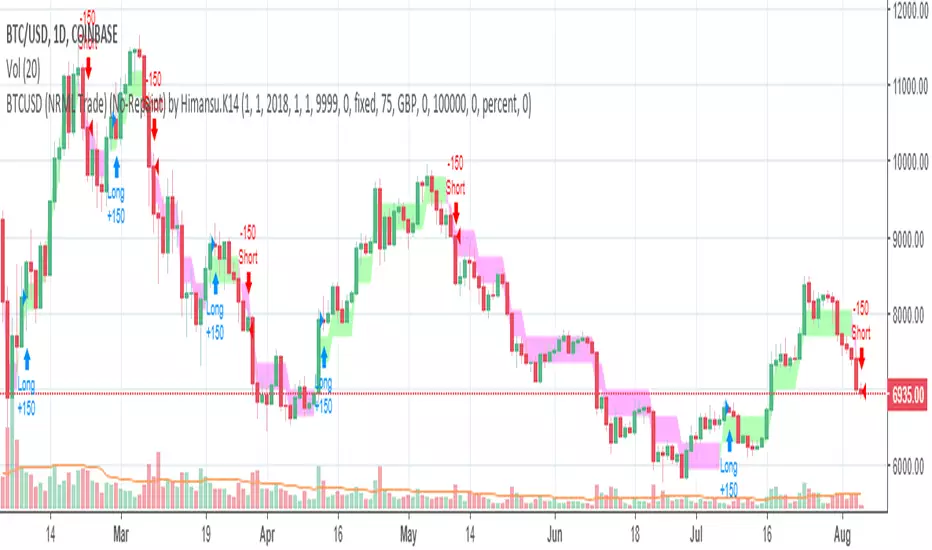
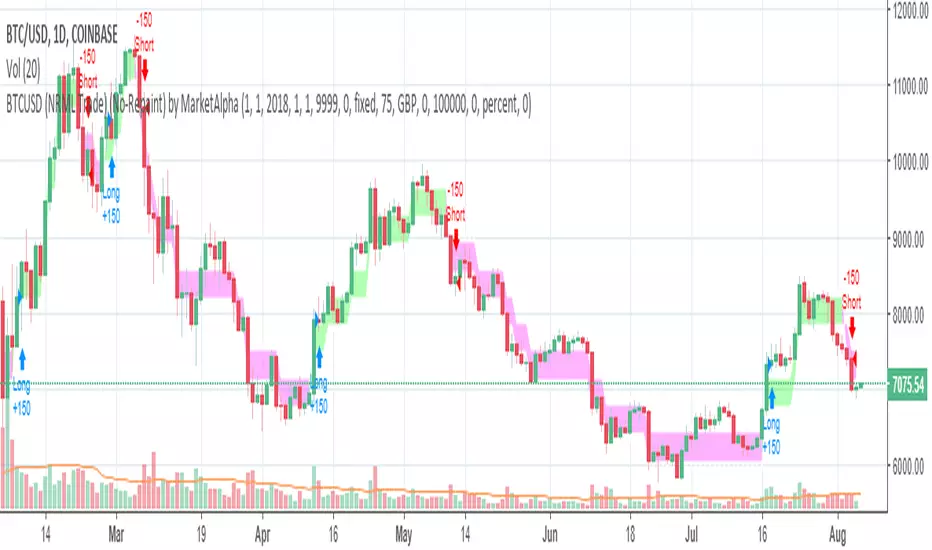
BTCUSD (NRML Trade) (No-Repaint) by MarketAlphaPlease ping me for 3-months free trial.
The script works best for delivery trade on 1-Day candle chart of BTCUSD 0.30% .
Please ping me for any queries
BTCUSD (NRML Trade) (No-Repaint) by Himansu.K14Please ping me for 3-months free trial.
The script works best for delivery trade on 1-Day candle chart of BTCUSD.
Please ping me for any queries.