Quick Valuation V.1.0 (Ibo)This Pine Script indicator performs a Quick Discounted Cash Flow (DCF)-style Valuation to estimate the intrinsic value of a stock.
It calculates a projected Fair Value and a Margin of Safety based on user inputs or automatically pulled financial data from TradingView (like revenue, growth, margin, and exit P/E). It also automatically computes a Discount Rate using a modified CAPM model.
Key Features
Valuation Output: Calculates a target Fair Value and the resulting Margin of Safety.
Data Flexibility: Automatically pulls essential fundamentals (Revenue, Margins, Shares Outstanding, etc.) but allows the user to override any value (revenue, growth, P/E, shares, etc.) via the settings.
Automated Discount Rate: Calculates the Discount Rate (Cost of Equity) using the current 10-Year Real Yield and a computed or user-defined Beta.
Clear Display: Presents all input metrics, calculated values, and data sources (TradingView or User Input) in a neat table on the chart.
القيمة

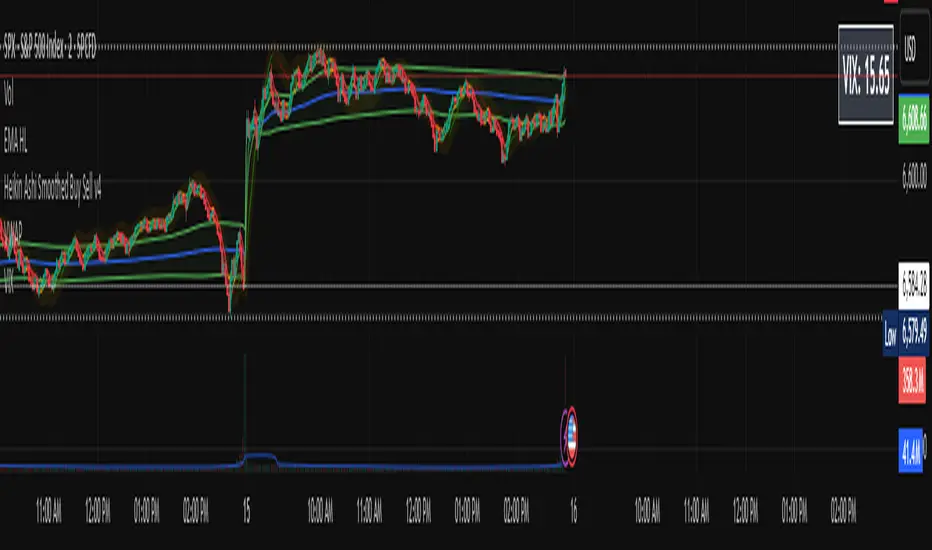
VIX Price BoxVIX Price Box (Customizable Colors)
This indicator displays the current VIX (CBOE Volatility Index) value in a fixed box on the top-right corner of the chart. It’s designed to give traders a quick, at-a-glance view of market volatility without needing to switch tickers.
Features
Pulls the live VIX price and updates automatically on every bar.
Displays the value inside a table box that stays fixed in the top-right corner.
Threshold-based coloring: the text color changes depending on whether the VIX is below, between, or above your chosen threshold levels.
5 built-in color modes:
Custom mode – choose your own colors for low, medium, and high volatility zones.
Adjustable threshold levels, background color, and frame color.
Use Cases
Monitor overall market risk sentiment while trading other instruments.
Identify periods of low vs. high volatility at a glance.
Pair with strategies that rely on volatility (options trading, hedging, breakout setups, etc.).
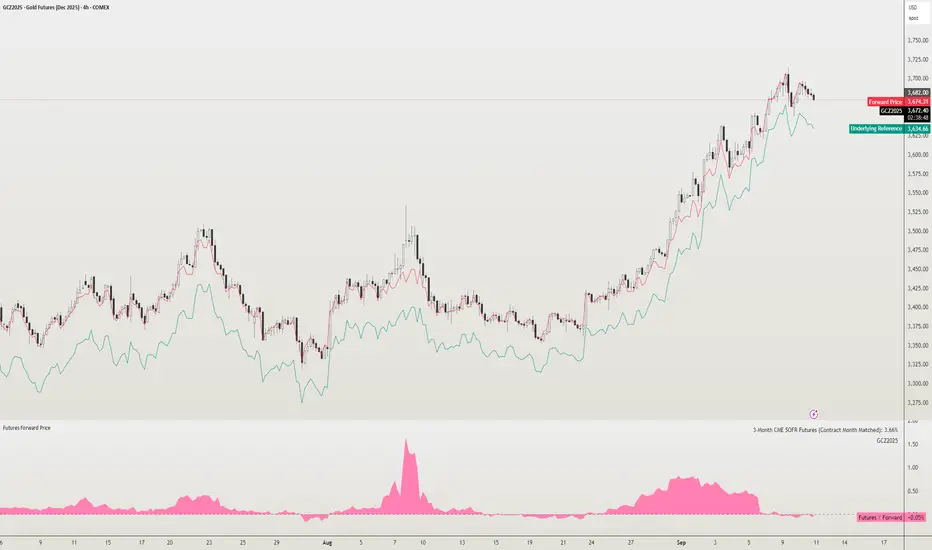
Futures Forward Price [NeoButane]In futures markets, the theoretical value of a futures contract can be derived from its underlying price and cost of carry. By baking in the costs and potential yields, the theoretical forward price then be used in basis against futures prices in place of the underlying spot price.
Usage
The script creates plots on the main chart and a separate window pane. Both are meant to be used to visualize dislocations in the market.
By using a futures vs. forward basis instead of futures vs. spot basis, discounts in the market are clearer.
Last month, the gold futures market GCZ2025 traded >1% above forward price when tariffs were announced and fell back in line once the tariffs were verbally retracted.
View roll spreads over a back-adjusted continuous chart. I guess. I don't think spread traders only look at one chart. This is as educational for me as it is you.
Configuration
The underlying reference needs to be changed to match the futures contract you are using.
The Risk-Free Rate defaults to FRED:SOFR. I found the contract month matched 3-Month SOFR Futures to be the closest for forward price.
Risk-Free Rate: The interest rate source for forward price.
Constant Risk-Free Rate: a static interest rate that can be used in advance of future changes in risk-free rate.
Underlying Reference: spot or index price. Some examples include TVC:SPX, TVC:GOLD, CRYPTO:BTCUSD, TVC:USOIL.
Forward Price Compounding: determines which formula to use. They're similar and become closer as the contract matures.
Alternative Contract: enable and select a futures contract to use it on a chart different than the main.
Storage Cost and Yield: for use with commodities. I haven't found a proper use for them yet but enabling is simple if you are able to.
The following are meant to be used with the continuous formula as they are compounded. However the rate sources don't differ much for the purpose of futures prices.
3-Month CME SOFR Futures
3-Month ICEEUR SONIA Futures
3-Month Osaka TONA Futures
The other rate sources are either meant for futures contracts shorter than quarterly such as monthly crypto futures or were meant to help myself understand how different rates would align with futures prices, like inflation.
What this script does
It uses the cost of carry formula to output the forward price (red line). The underlying reference (green line) is plotted alongside and a futures-derived reference (blue line) can be displayed to see how it looks next to the real reference price.
The data pane displays either the nominal difference or percentage difference between the real futures price and the calculated forward price.
Further reading
www.investopedia.com
www.cmegroup.com
www.oxfordenergy.org
www-2.rotman.utoronto.ca
www.cmegroup.com
3-month rate futures
www.cmegroup.com
www.ice.com
www.bankofengland.co.uk
www.jpx.co.jp
Volumatic Fair Value Gaps [BigBeluga]🔵 OVERVIEW
The Volumatic Fair Value Gaps indicator detects and plots size-filtered Fair Value Gaps (FVGs) and immediately analyzes the bullish vs. bearish volume composition inside each gap. When an FVG forms, the tool samples volume from a 10× lower timeframe , splits it into Buy and Sell components, and overlays two compact bars whose percentages always sum to 100%. Each gap also shows its total traded volume . A live dashboard (top-right) summarizes how many bullish and bearish FVGs are currently active and their cumulative volumes—offering a quick read on directional participation and trend pressure.
🔵 CONCEPTS
FVGs (Fair Value Gaps) : Imbalance zones between three consecutive candles where price “skips” trading. The script plots bullish and bearish gaps and extends them until mitigated.
Size Filtering : Only significant gaps (by relative size percentile) are drawn, reducing noise and emphasizing meaningful imbalances.
// Gap Filters
float diff = close > open ? (low - high ) / low * 100 : (low - high) / high *100
float sizeFVG = diff / ta.percentile_nearest_rank(diff, 1000, 100) * 100
bool filterFVG = sizeFVG > 15
Volume Decomposition : For each FVG, the indicator inspects a 10× lower timeframe and aggregates volume of bullish vs. bearish candles inside the gap’s span.
100% Split Bars : Two inline bars per FVG display the % Bull and % Bear shares; their total is always 100%.
Total Gap Volume : A numeric label at the right edge of the FVG shows the total traded volume associated with that gap.
Mitigation Logic : Gaps are removed when price closes through (or touches via high/low—user-selectable) the opposite boundary.
Dashboard Summary : Counts and sums the active bullish/bearish FVGs and their total volumes to gauge directional dominance.
🔵 FEATURES
Bullish & Bearish FVG plotting with independent color controls and visibility toggles.
Adaptive size filter (percentile-based) to keep only impactful gaps.
Lower-TF volume sampling at 10× faster resolution for more granular Buy/Sell breakdown.
Per-FVG volume bars : two horizontal bars showing Bull % and Bear % (sum = 100%).
Per-FVG total volume label displayed at the right end of the gap’s body.
Mitigation source option : choose close or high/low for removing/invalidating gaps.
Overlap control : older overlapped gaps are cleaned to avoid clutter.
Auto-extension : active gaps extend right until mitigated.
Dashboard : shows count of bullish/bearish gaps on chart and cumulative volume totals for each side.
Performance safeguards : caps the number of active FVG boxes to maintain responsiveness.
🔵 HOW TO USE
Turn on/off FVG types : Enable Bullish FVG and/or Bearish FVG depending on your focus.
Tune the filter : The script already filters by relative size; if you need fewer (stronger) signals, increase the percentile threshold in code or reduce the number of displayed boxes.
Choose mitigation source :
close — stricter; gap is removed when a closing price crosses the boundary.
high/low — more sensitive; a wick through the boundary mitigates the gap.
Read the per-FVG bars :
A higher Bull % inside a bullish gap suggests constructive demand backing the imbalance.
A higher Bear % inside a bearish gap suggests supply is enforcing the imbalance.
Use total gap volume : Larger totals imply more meaningful interest at that imbalance; confluence with structure/HTF levels increases relevance.
Watch the dashboard : If bullish counts and cumulative volume exceed bearish, market pressure is likely skewed upward (and vice versa). Combine with trend tools or market structure for entries/exits.
Optional: hide volume bars : Disable Volume Bars when you want a cleaner FVG map while keeping total volume labels and the dashboard.
🔵 CONCLUSION
Volumatic Fair Value Gaps blends precise FVG detection with lower-timeframe volume analytics to show not only where imbalances exist but also who powers them. The per-gap Bull/Bear % bars, total volume labels, and the cumulative dashboard together provide a fast, high-signal read on directional participation. Use the tool to prioritize higher-quality gaps, align with trend bias, and time mitigations or continuations with greater confidence.

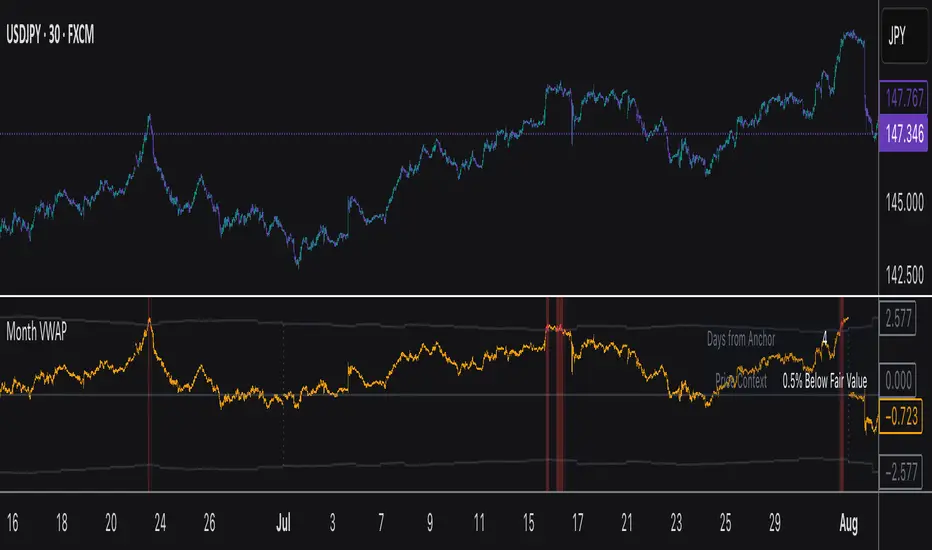
Monthly VWAPDescription
This indicator identifies potential mean reversion opportunities by tracking price deviations from monthly VWAP with dynamic volatility-adjusted thresholds.
Core Logic:
The indicator monitors when price moves significantly away from monthly VWAP and looks for potential reversal opportunities. It uses ATR-based dynamic thresholds that adapt to current market volatility, combined with volume confirmation to filter out weak signals.
Key Features:
Adaptive Thresholds: ATR-based bands that adjust to market volatility
Volume Confirmation: Requires average volume spike to validate signals
Monthly Reset: VWAP anchors reset each month for fresh reference levels
Visual Clarity: Color-coded deviation line with background highlights for active signals
Info Panel: Shows days from anchor and current price context vs fair value
Signal Generation:
Buy Signal: Price below monthly VWAP by threshold amount with elevated volume
Sell Signal: Price above monthly VWAP by threshold amount with elevated volume
Neutral: Price within threshold range or insufficient volume
Best Used For:
Mean reversion strategies in ranging markets
Identifying potential oversold/overbought conditions
Understanding price position relative to monthly fair value
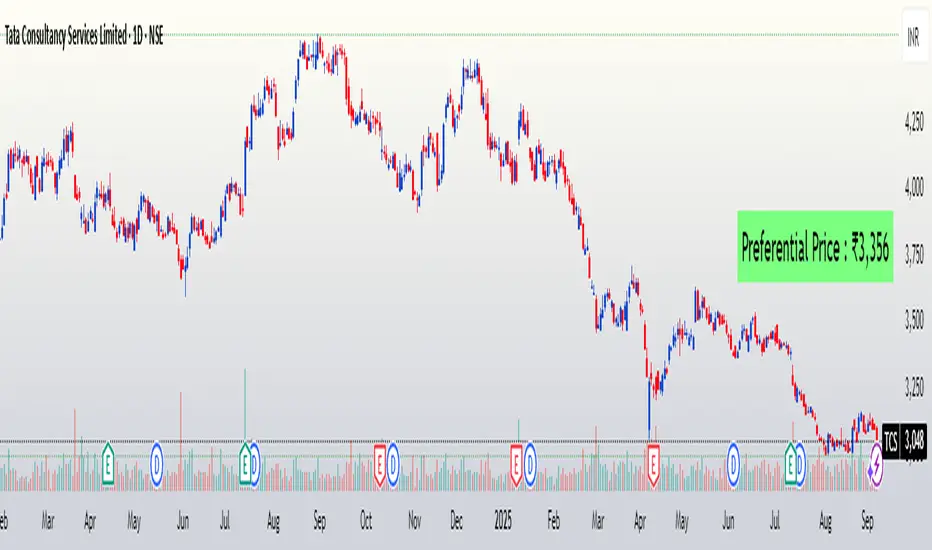
FuTech : Preferential Price📌 First Ever Indicator : FuTech : Preferential Price
💡 What if you could instantly know the Preferential Price — as if the company announced a preferential issue in today’s meeting surprisingly?
Normally, you’d be stuck with tedious valuation spreadsheets and SEBI formula checks 🧮📑…
✨ But not anymore — this tool does the hard work for you!
With just one click, it auto-calculates the Preferential Issue Floor Price under SEBI ICDR Regulations, 2018 - Regulation 164 (as amended), directly from your chart symbol.
✅ How it works ?
📅 Relevant Date = 30 days prior to either:
• Today’s date (default mode)
• Or your chosen EGM date (user input)
📊 For the Relevant Date, the indicator automatically computes:
• VWAP (90 trading days preceding Relevant Date)
• VWAP (10 trading days preceding Relevant Date)
🔎 As per SEBI Reg.164, the higher of these two VWAPs is selected as the Minimum Issue Price (Preferential Price).
💰 Price is neatly formatted in Indian style (e.g. ₹1,00,000).
✅ Key Features:
⚡ Auto-calculates from chart symbol — no manual entry.
🎛️ Option to input EGM date for accurate floor price compliance.
🎨 Fully customizable: text color, size, background, position.
🪄 Clean display → shows only the final Preferential Price (Reg.164).
📌 Usage:
This indicator is built for analysts, fund managers, and corporate professionals dealing with Preferential Allotment pricing compliance.
It ensures quick visibility of the floor price under SEBI ICDR rules, directly on your chart.
⚠️ Disclaimer:
📌 The calculated Preferential Price is an approximation based on SEBI ICDR Reg.164 methodology.
📊 Actual price determined by the company / merchant banker may vary slightly (±5) due to rounding, data source differences, or timing adjustments.
📅 Ensure to verify with official exchange data and SEBI filings before relying on these numbers.
📝 This tool is meant for analytical and educational purposes only, not a substitute for regulatory or professional advice.
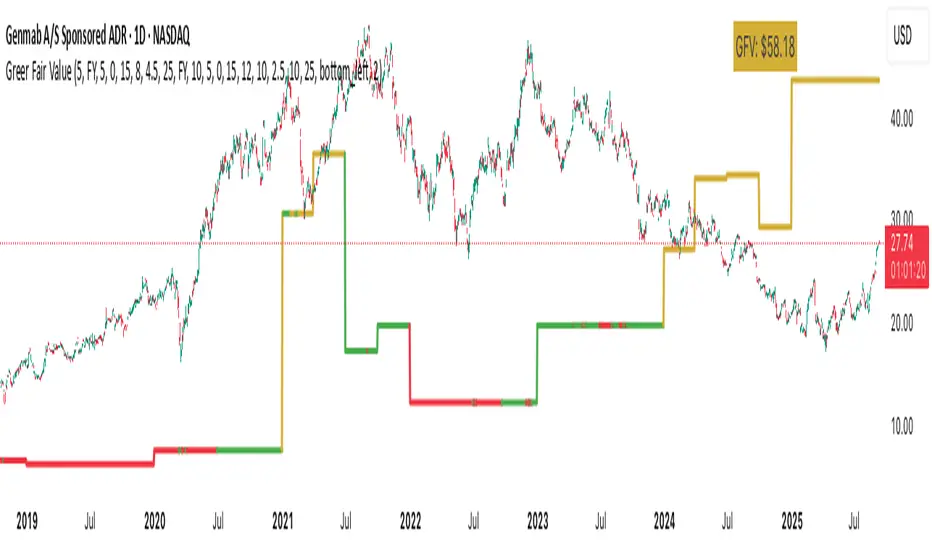
Greer Fair Value✅ Greer Fair Value
Greer Fair Value: Graham intrinsic value + Buffett-style DCF with auto EPS/FCF and auto growth (CAGR of FCF/share), defaulting to a simple GFV badge that color-codes opportunity at a glance.
📜 Full description
Greer Fair Value is inspired by the valuation frameworks of Benjamin Graham and Warren Buffett. It combines Graham’s rate-adjusted intrinsic value with a two-stage, per-share DCF. The script auto-populates EPS (TTM) and Free Cash Flow per share (FY/FQ/TTM) from request.financial(), and can auto-estimate the near-term growth rate (g₁) using the CAGR of FCF/share over a user-selected lookback (with sensible caps). All assumptions remain editable.
Default view: only the GFV badge is shown to keep charts clean.
Badge color logic:
Gold — both DCF and Graham fair values are above the current price
Green — exactly one of them is above the current price
Red — the current price is above both values
Show more detail (optional):
Toggle “Show Graham Lines” and/or “Show DCF Lines” to plot fair values (and optional MoS bands) over time.
Toggle “Show Dashboard” for a compact data table of assumptions and outputs.
Optional summary label can be enabled for a quick on-chart readout.
Inputs you can customize: EPS source/manual fallback, FCF/share source (FY/FQ/TTM), g₁ auto-CAGR lookback & caps, terminal growth gT, discount rate r, MoS levels, step-style plots, table position, and decimals.
Note: TradingView’s UI controls whether “Inputs/Values in Status Line” are shown. If you prefer a clean status line, open the indicator’s settings and uncheck those options, then Save as default.
Disclaimer: For educational/informational purposes only; not financial advice. Markets involve risk—do your own research.
P/B Ratio (Per Share) vs Median + Bollinger Band- 📝 This indicator highlights potential buying opportunities by analyzing the Price-to-Book (P/B) ratio in relation to Bollinger Bands and its historical median.
- 🎯 The goal is to provide a visually intuitive signal for value-oriented entries, especially when valuation compression aligns with historical context.
- 💡 Vertical green shading is applied when the P/B ratio drops below the lower Bollinger Band, which is calculated directly from the P/B ratio itself — not price. This condition often signals the ticker may be oversold.
- 🟢 Lighter green appears when the ratio is below the lower band but above the median, suggesting a possible shorter-term entry with slightly more risk.
- 🟢 Darker green appears when the ratio is both below the lower band and below the median, pointing to a potentially stronger, longer-term value entry.
- ⚠️ This logic was tested using 1 and 2-day time frames. It may not be as helpful in longer time frames, as the financial data TradingView pulls in begins in Q4 2017.
- ⚠️ Note: This script relies on financial data availability through TradingView. It may not function properly with certain tickers — especially ETFs, IPOs, or thinly tracked assets — where P/S ratio data is missing or incomplete.
- ⚠️ This indicator will not guarantee successful results. Use in conjunction with other indicators and do your due diligence.
- 🤖 This script was iteratively refined with the help of AI to ensure clean logic, minimalist design, and actionable signal clarity.
- 📢 Idea is based on the script "Historical PE ratio vs median" by haribotagada
- 💬 Questions, feedback, or suggestions? Drop a comment — I’d love to hear how you’re using it or what you'd like to see changed.

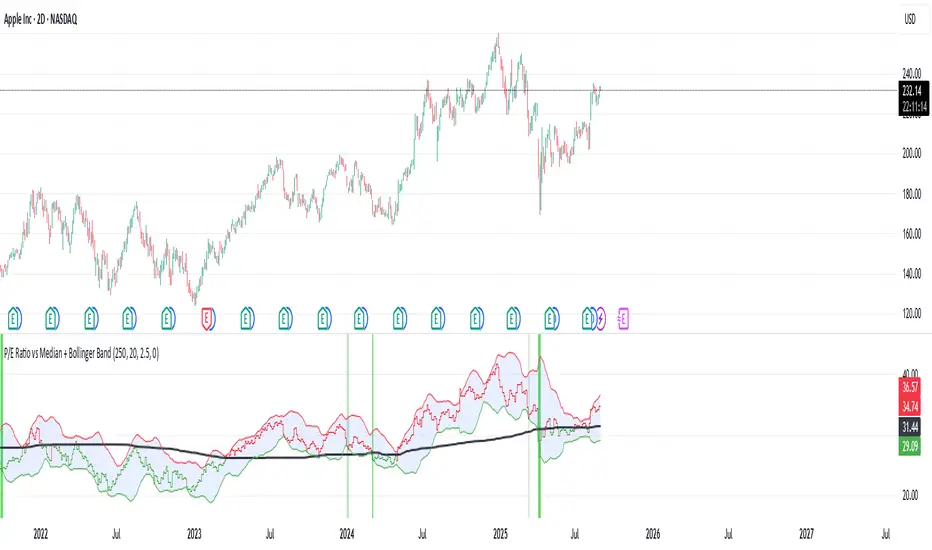
P/E Ratio vs Median + Bollinger Band- 📝 This indicator highlights potential buying opportunities by analyzing the Price-to-Earnings (P/E) ratio in relation to Bollinger Bands and its historical median.
- 🎯 The goal is to provide a visually intuitive signal for value-oriented entries, especially when valuation compression aligns with historical context.
- 💡 Vertical green shading is applied when the P/E ratio drops below the lower Bollinger Band, which is calculated directly from the P/E ratio itself — not price. This condition often signals the ticker may be oversold.
- 🟢 Lighter green appears when the ratio is below the lower band but above the median, suggesting a possible shorter-term entry with slightly more risk.
- 🟢 Darker green appears when the ratio is both below the lower band and below the median, pointing to a potentially stronger, longer-term value entry.
- ⚠️ This logic was tested using 1 and 2-day time frames. It may not be as helpful in longer time frames, as the financial data TradingView pulls in begins in Q4 2017.
- ⚠️ Note: This script relies on financial data availability through TradingView. It may not function properly with certain tickers — especially ETFs, IPOs, or thinly tracked assets — where P/S ratio data is missing or incomplete.
- ⚠️ This indicator will not guarantee successful results. Use in conjunction with other indicators and do your due diligence.
- 🤖 This script was iteratively refined with the help of AI to ensure clean logic, minimalist design, and actionable signal clarity.
- 📢 Idea is based on the script "Historical PE ratio vs median" by haribotagada
- 💬 Questions, feedback, or suggestions? Drop a comment — I’d love to hear how you’re using it or what you'd like to see changed.
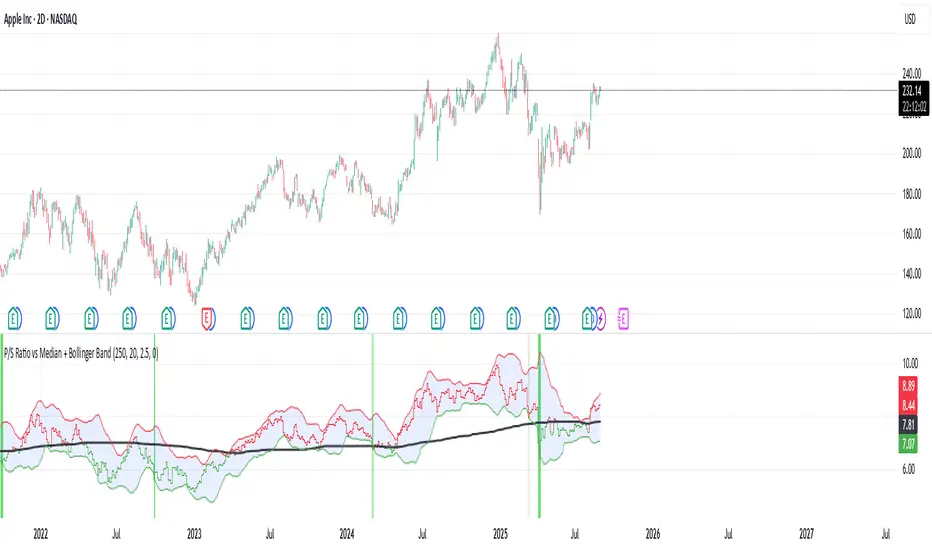
P/S Ratio vs Median + Bollinger Band- 📝 This indicator highlights potential buying opportunities by analyzing the Price-to-Sales (P/S) ratio in relation to Bollinger Bands and its historical median.
- 🎯 The goal is to provide a visually intuitive signal for value-oriented entries, especially when valuation compression aligns with historical context.
- 💡 Vertical green shading is applied when the P/S ratio drops below the lower Bollinger Band, which is calculated directly from the P/S ratio itself — not price. This condition often signals the ticker may be oversold.
- 🟢 Lighter green appears when the ratio is below the lower band but above the median, suggesting a possible shorter-term entry with slightly more risk.
- 🟢 Darker green appears when the ratio is both below the lower band and below the median, pointing to a potentially stronger, longer-term value entry.
- ⚠️ This logic was tested using 1 and 2-day time frames. It may not be as helpful in longer time frames, as the financial data TradingView pulls in begins in Q4 2017.
- ⚠️ Note: This script relies on financial data availability through TradingView. It may not function properly with certain tickers — especially ETFs, IPOs, or thinly tracked assets — where P/S ratio data is missing or incomplete.
- ⚠️ This indicator will not guarantee successful results. Use in conjunction with other indicators and do your due diligence.
- 🤖 This script was iteratively refined with the help of AI to ensure clean logic, minimalist design, and actionable signal clarity.
- 📢 Idea is based on the script "Historical PE ratio vs median" by @haribotagada
- 💬 Questions, feedback, or suggestions? Drop a comment — I’d love to hear how you’re using it or what you'd like to see changed.
Future Value ProjectionFuture Value Projection with Actual CAGR
This indicator calculates the future value (FV) of the current ticker’s price using its historical Compound Annual Growth Rate (CAGR). It measures how much the price has grown over a chosen lookback period, derives the average annual growth rate, and then projects the current price forward into the future.
Formulae:
CAGR:
CAGR = ( PV_now / PV_past )^(1 / t) - 1
Future Value:
FV = PV_now × ( 1 + CAGR / n )^( n × T )
Where:
PV_now = Current price
PV_past = Price t years ago
t = Lookback period (years)
CAGR = Compound Annual Growth Rate
n = Compounding periods per year (1=annual, 12=monthly, 252=daily, etc.)
T = Projection horizon (years forward)
How it works:
Select a lookback period (e.g., 3 years).
The script finds the price from that time and computes the CAGR.
It then projects the current price forward by T years using the CAGR.
The chart shows:
Current price (blue)
Projected FV target (green)
A table with CAGR and projection details
Use case:
Helps investors and traders visualize long-term growth projections if the ticker continues growing at its historical pace.

ETH Valuation Indicator╔═══════════════════════ RUBIXCUBE ════════════════════════════╗
This indicator combines multiple on-chain and market-based metrics into a single valuation score for Ethereum. It highlights periods of relative undervaluation (green zones) and overvaluation (red zones) by normalising several metrics into a 0–1 range and averaging them.
Price chart signals (top panel): Green arrows mark points where the indicator flagged historically attractive buying opportunities.
Valuation oscillator (bottom panel): Shows the combined score over time, cycling between undervalued and overvalued extremes.
Metric breakdown (side panel): Displays the contribution of each metric, their rate of change, and their current score.
This tool is designed for macro insight, not short-term trading. It helps contextualise Ethereum’s position in the market cycle and provides a data-driven framework for long-term investors.
╚═══════════════════════════════════════════════════════════╝

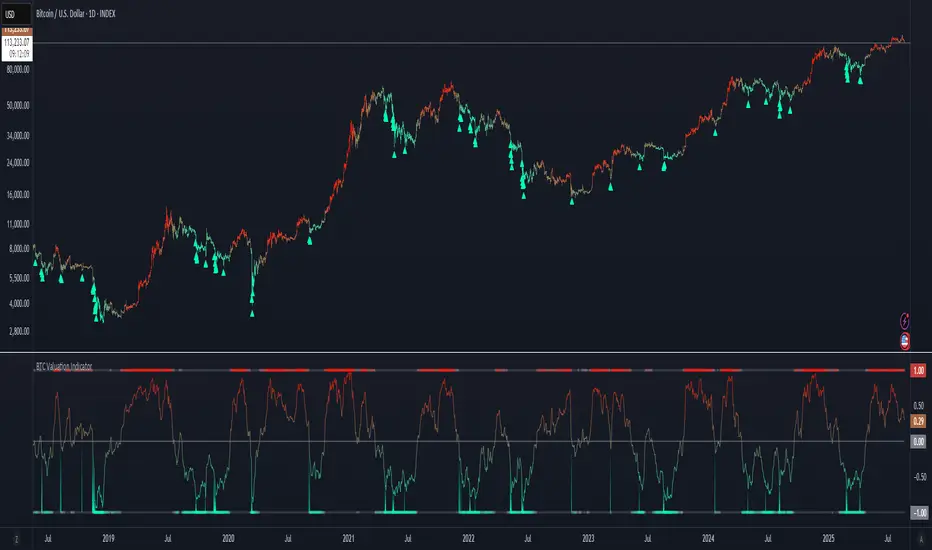
BTC Valuation Indicator╔═══════════════════ RUBIXCUBE ══════════════════════╗
This indicator combines multiple on-chain and market-based metrics into a single valuation score for Bitcoin. It highlights periods of relative undervaluation (green zones) and overvaluation (red zones) by normalising several metrics into a 0–1 range and averaging them.
- Price chart signals (top panel): Green arrows mark points where the indicator flagged historically attractive buying opportunities.
- Valuation oscillator (bottom panel): Shows the combined score over time, cycling between undervalued and overvalued extremes.
- Metric breakdown (side panel): Displays the contribution of each metric, their rate of change, and their current score.
This tool is designed for macro insight, not short-term trading. It helps contextualise Bitcoin’s position in the market cycle and provides a data-driven framework for long-term investors.
╚═════════════════════════════════════════════════╝
BTC Power Law Valuation BandsBTC Power Law Rainbow
A long-term valuation framework for Bitcoin based on Power Law growth — designed to help identify macro accumulation and distribution zones, aligned with long-term investor behavior.
🔍 What Is a Power Law?
A Power Law is a mathematical relationship where one quantity varies as a power of another. In this model:
Price ≈ a × (Time)^b
It captures the non-linear, exponentially slowing growth of Bitcoin over time. Rather than using linear or cyclical models, this approach aligns with how complex systems, such as networks or monetary adoption curves, often grow — rapidly at first, and then more slowly, but persistently.
🧠 Why Power Law for BTC?
Bitcoin:
Has finite supply and increasing adoption.
Operates as a monetary network , where Metcalfe’s Law and power laws naturally emerge.
Exhibits exponential growth over logarithmic time when viewed on a log-log chart .
This makes it uniquely well-suited for power law modeling.
🌈 How to Use the Valuation Bands
The central white line represents the modeled fair value according to the power law.
Colored bands represent deviations from the model in logarithmic space, acting as macro zones:
🔵 Lower Bands: Deep value / Accumulation zones.
🟡 Mid Bands: Fair value.
🔴 Upper Bands: Euphoria / Risk of macro tops.
📐 Smart Money Concepts (SMC) Alignment
Accumulation: Occurs when price consolidates near lower bands — often aligning with institutional positioning.
Markup: As price re-enters or ascends the bands, we often see breakout behavior and trend expansion.
Distribution: When price extends above upper bands, potential for exit liquidity creation and distribution events.
Reversion: Historically, price mean-reverts toward the model — rarely staying outside the bands for long.
This makes the model useful for:
Cycle timing
Long-term DCA strategy zones
Identifying value dislocations
Filtering short-term noise
⚠️ Disclaimer
This tool is for educational and informational purposes only . It is not financial advice. The power law model is a non-predictive, mathematical framework and does not guarantee future price movements .
Always use additional tools, risk management, and your own judgment before making trading or investment decisions.

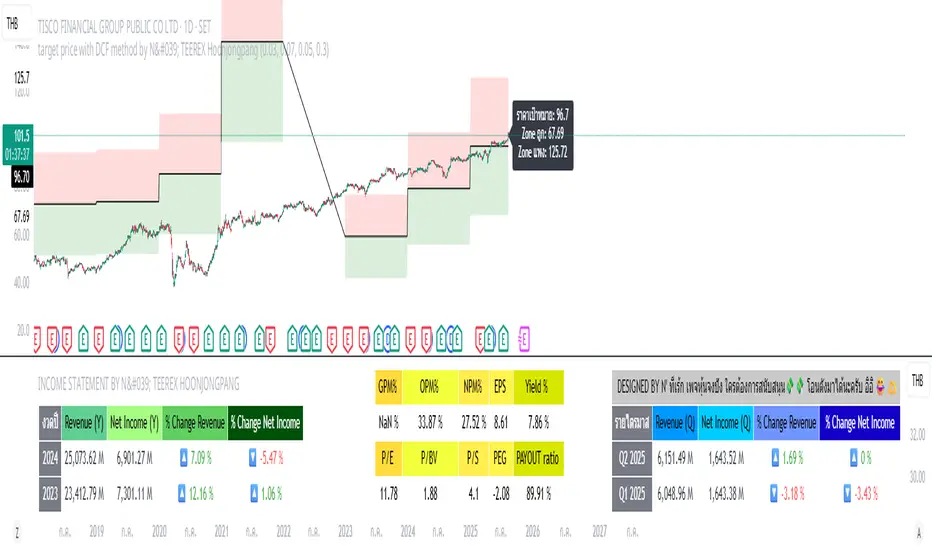
target price with DCF method by N' TEEREX HoonjongpangThis indicator calculates a stock’s intrinsic value using the latest fiscal year data: free cash flow, debt, equity, shares outstanding, and taxes.
It computes the Weighted Average Cost of Capital (WACC), applies the Gordon Growth formula, and derives a price per share.
A margin of safety is applied to define zones on the chart:
Green Zone: Safe (undervalued)
Red Zone: Not Safe (overvalued)
All key numbers, including WACC, price target, and zones, are displayed as a label.
Result: A visual and numeric guide to the stock’s fair value, helping investors quickly see if the current price is above or below estimated intrinsic value.
US Macro Cycle (Z-Score Model)US Macro Cycle (Z-Score Model)
This indicator tracks the US economic cycle in real time using a weighted composite of seven macro and market-based indicators, each converted into a rolling Z-score for comparability. The model identifies the current phase of the cycle — Expansion, Peak, Contraction, or Recovery — and suggests sector tilts based on historical performance in each phase.
Core Components:
Yield Curve (10y–2y): Positive & steepening = growth; inverted = slowdown risk.
Credit Spreads (HYG/LQD): Tightening = risk-on; widening = risk-off.
Sector Leadership (Cyclicals vs. Defensives): Measures market leadership regime.
Copper/Gold Ratio: Higher copper = growth signal; higher gold = defensive.
SPY vs. 200-day MA: Equity trend strength.
SPY/IEF Ratio: Stocks vs. bonds relative strength.
VIX (Inverted): Low/falling volatility = supportive; high/rising = risk-off.
Methodology:
Each series is transformed into a rolling Z-score over the selected lookback period (optionally using median/MAD for robustness and winsorization to clip outliers).
Z-scores are combined using user-defined weights and normalized.
The smoothed composite is compared against phase thresholds to classify the macro environment.
Features:
Customizable Weights: Emphasize the indicators most relevant to your strategy.
Adjustable Thresholds: Fine-tune cycle phase definitions.
Background Coloring: Visual cue for the current phase.
Summary Table: Displays composite Z, confidence %, and individual Z-scores.
Alerts: Trigger when the phase changes, with details on the composite score and recommended tilt.
Use Cases:
Align sector rotation or relative strength strategies with the macro backdrop.
Identify favorable or defensive phases for tactical allocation.
Monitor macro turning points to manage portfolio risk.
It's doesn't fill nan gaps so there is quite a bit of zeroes, non-repainting.

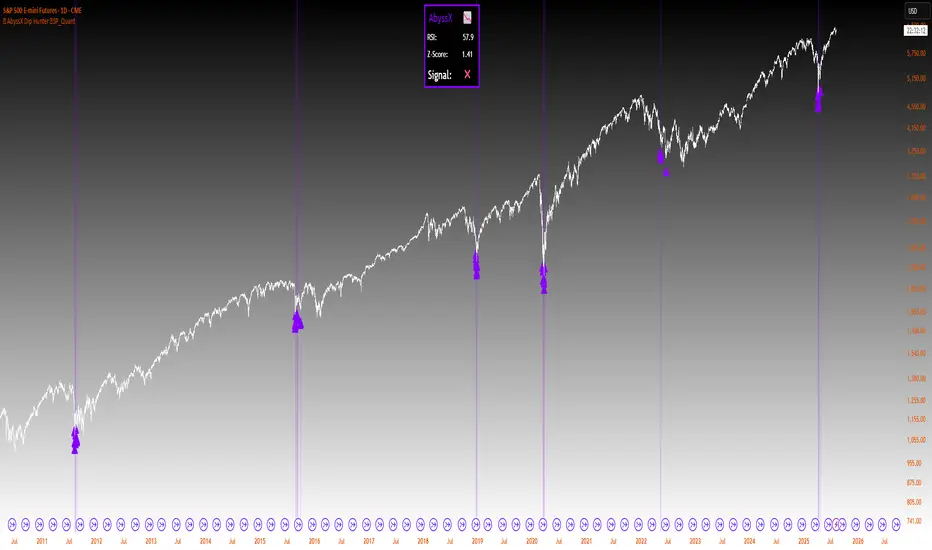
⚡ AbyssX Dip Hunter ⚡SP_Quant⚡AbyssX Dip Hunter ⚡ by SP_Quant
AbyssX Dip Hunter is a clean and effective indicator designed to help you identify potential dip-buying opportunities using Z-Score analysis and an optional RSI filter.
🔍 How It Works:
Z-Score Logic: Detects statistical price dips when the Z-Score drops below your set threshold.
Optional RSI Filter: Filters signals only when RSI is under a specified level — useful for avoiding false positives in strong trends.
Custom Color Mode: Choose your preferred signal color (Purple, Cyan, Green, or Orange).
Chart Visuals: Dip signals are shown with triangle markers and soft background highlights.
Live Info Panel: Displays real-time RSI, Z-Score, and signal status in a table on your chart.
⚙️ Settings:
Z-Score Length & Threshold
RSI Filter ON/OFF with custom RSI Length and Threshold
Visual Style (Color Mode)
✅ Best for traders who use oversold/mean-reversion strategies or look for extreme pullbacks.
⚠️ Disclaimer:
This indicator is for educational and informational purposes only and does not constitute financial advice, trading advice, or investment recommendations. Use it at your own risk. Always perform your own analysis before making any trading decisions. The author is not liable for any losses or damages resulting from the use of this script.
MK SpreadCalculates the spread between two instruments, with a primary use case of tracking the differential between real (inflation-adjusted) and nominal yields.

CVDD Z-ScoreCumulative Value Days Destroyed (CVDD) - The CVDD was created by Willy Woo and is the ratio of the cumulative value of Coin Days Destroyed in USD and the market age (in days). While this indicator is used to detect bottoms normally, an extension is used to allow detection of BTC tops. When the BTC price goes above the CVDD extension, BTC is generally considered to be overvalued. Because the "strength" of the BTC tops has decreased over the cycles, a logarithmic function for the extension was created by fitting past cycles as log extension = slope * time + intercept. This indicator is triggered for a top when the BTC price is above the CVDD extension. For the bottoms, the CVDD is shifted upwards at a default value of 120%. The slope, intercept, and CVDD bottom shift can all be modified in the script.
Now with the automatic Z-Score calculation for ease of classification of Bitcoin's valuation according to this metric.
Created for TRW.

Bitcoin: Pi Cycle Top & Bottom Indicator Z ScoreIndicator Overview
The Pi Cycle Top Indicator has historically been effective in picking out the timing of market cycle highs within 3 days.
It uses the 111 day moving average (111DMA) and a newly created multiple of the 350 day moving average, the 350DMA x 2.
Note: The multiple is of the price values of the 350DMA, not the number of days.
For the past three market cycles, when the 111DMA moves up and crosses the 350DMA x 2 we see that it coincides with the price of Bitcoin peaking.
It is also interesting to note that 350 / 111 is 3.153, which is very close to Pi = 3.142. In fact, it is the closest we can get to Pi when dividing 350 by another whole number.
It once again demonstrates the cyclical nature of Bitcoin price action over long time frames. However, in this instance, it does so with a high degree of accuracy over Bitcoin's adoption phase of growth.
Bitcoin Price Prediction Using This Tool
The Pi Cycle Top Indicator forecasts the cycle top of Bitcoin’s market cycles. It attempts to predict the point where Bitcoin price will peak before pulling back. It does this on major high time frames and has picked the absolute tops of Bitcoin’s major price moves throughout most of its history.
How It Can Be Used
Pi Cycle Top is useful to indicate when the market is very overheated. So overheated that the shorter-term moving average, which is the 111-day moving average, has reached an x2 multiple of the 350-day moving average. Historically, it has proved advantageous to sell Bitcoin around this time in Bitcoin's price cycles.
It is also worth noting that this indicator has worked during Bitcoin's adoption growth phase, the first 15 years or so of Bitcoin's life. With the launch of Bitcoin ETF's and Bitcoin's increased integration into the global financial system, this indicator may cease to be relevant at some point in this new market structure.
Added the Z-Score metric for easy classification of the value of Bitcoin according to this indicator.
Created for TRW

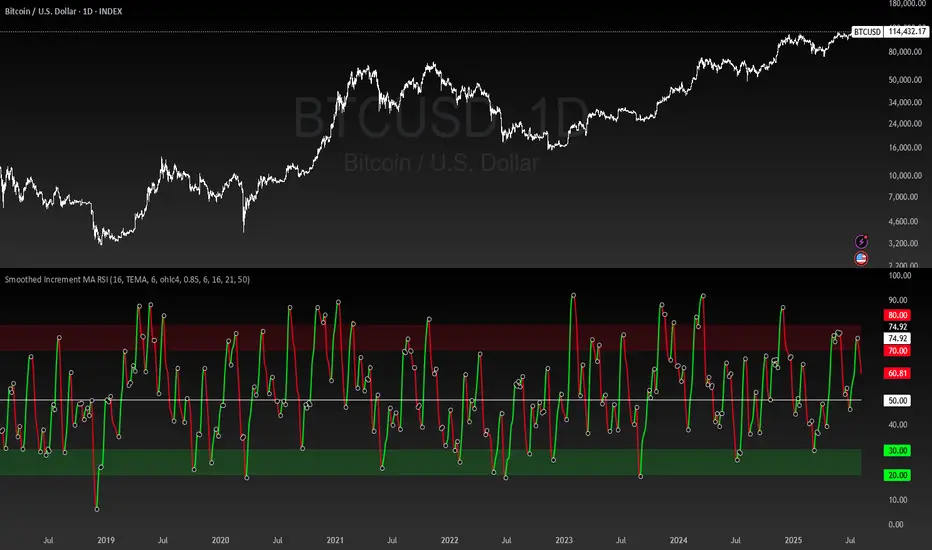
Smoothed Increment MA RSI | MisinkoMasterThe Smoothed Increment MA RSI is my latest creation, being a versatile tool allowing traders and investors not only to catch reversals in Trend, but also catch high value and low value zones, working both as a Trend Following and Mean Reverting indicator for everyone's usage.
Use Cases:
1. Mean Reversion/Value Spotting:
This indicator, because of being based on the RSI, can catch high value and low value zones,
and if you experiment with conditions like:
Entry - values in the green zone
Exit - values in the red zone and downtrend
You will find very good trades:
2. Trend Reversals:
The main usage of this indicator, this is for what it has been intended, so it must excell at it!
When the line is green a reversal up is happening, when red, reversal down.
This indicator will provide you with fast reversals, no matter the asset - it will always do it's job.
Change the asset? No problem!
COINBASE:ETHUSD
But it also works on meme coins like CRYPTOCAP:DOGE
How it works?
The Smoothed Increment MA RSI works like so:
1. Calculate the RSI/Relative Strength Index, which will be the core of this all
2. Calculate the increment, this will be used by comparing the Moving Average, ATR/Average True Range and Volume values now to past values with different weights
3. Now it is time to check the RSI's ROC and apply the increment to it, making a much more volatile RSI
4. Now we just smooth the values using multiple Moving Averages over a smoothing period at base set to 6, but can be adjusted
5. Trend logic, this one depends on everyone, some may set it to crossing the value of 50, some may set it to something else, but for the purpose of this indicator I found the best working case to be just comparing if the value of the RSI has grown or decreased.
There will be also black dots with white borders plotted, this is for easier spotting of reversals.
This indicator also uses volume, so you have to check this on something with volume available.
I left all the settings available for changing, so you can adjust it to whatever you like and get the best out of this!
Crowding model ║ BullVision🔬 Overview
The Crypto Crowding Model Pro is a sophisticated analytical tool designed to visualize and quantify market conditions across multiple cryptocurrencies. By leveraging Relative Strength Index (RSI) and Z-score calculations, this indicator provides traders with an intuitive and detailed snapshot of current crypto market dynamics, highlighting areas of extreme momentum, crowded trades, and potential reversal points.
⚙️ Key Concepts
📊 RSI and Z-Score Analysis
RSI (Relative Strength Index) evaluates the momentum and strength of each cryptocurrency, identifying overbought or oversold conditions.
Z-Score Normalization measures each asset's current price deviation relative to its historical average, identifying statistically significant extremes.
🎯 Crowding Analytics
An integrated analytics panel provides real-time crowding metrics, quantifying market sentiment into four distinct categories:
🔥 FOMO (Fear of Missing Out): High momentum, potential exhaustion.
❄️ Fear: Low momentum, potential reversal or consolidation.
📈 Recovery: Moderate upward momentum after a downward trend.
💪 Strength: Stable bullish conditions with sustained momentum.
🖥️ Visual Scatter Plot
Assets are plotted on a dynamic scatter plot, positioning each cryptocurrency according to its RSI and Z-score.
Color coding, symbol shapes, and sizes help quickly identify main market segments (BTC, ETH, TOTAL, OTHERS) and individual asset conditions.
🧩 Quadrant Classification
Assets are categorized into four quadrants based on their momentum and deviation:
Overbought Extended: High RSI and positive Z-score.
Recovery Phase: Low RSI but positive Z-score.
Oversold Compressed: Low RSI and negative Z-score.
Strong Consolidation: High RSI but negative Z-score.
🔧 User Customization
🎨 Visual Settings
Bar Scale: Adjust the scatter plot visual scale.
Asset Visibility: Optionally display key market benchmarks (TOTAL, BTC, ETH, OTHERS).
Gradient Background: Enhances visual interpretation of asset clusters.
Crowding Analytics Panel: Toggle the analytics panel on/off.
📊 Indicator Parameters
RSI Length: Defines the calculation period for RSI.
Z-score Lookback: Historical lookback period for normalization.
Crowding Alert Threshold: Sets alert sensitivity for crowded market conditions.
🎯 Zone Settings
Quadrant Labels: Displays descriptive labels for each quadrant.
Danger Zones: Highlights extreme RSI levels indicative of heightened market risk.
📈 Visual Output
Dynamic Scatter Plot: Visualizes asset positioning clearly and intuitively.
Gradient and Grid: Professional gridlines and subtle gradient backgrounds assist visual assessment.
Danger Zone Highlights: Visually indicates RSI extremes to warn of potential market turning points.
Crowding Analytics Panel: Real-time summary of market sentiment and asset distribution.
🔍 Use Cases
This indicator is particularly beneficial for traders and analysts looking to:
Identify crowded trades and potential reversal points.
Quickly assess overall market sentiment and individual asset strength.
Integrate a robust momentum analysis into broader technical or fundamental strategies.
Enhance market timing and improve risk management decisions.
⚠️ Important Notes
This indicator does not provide explicit buy or sell signals.
It is intended solely for informational, analytical, and educational purposes.
Past performance and signals are not indicative of future market results.
Always combine with additional tools and analysis as part of comprehensive decision-making.

Greer Value Yields Line📈 Greer Value Yields Line – Valuation Signal Without the Clutter
Part of the Greer Financial Toolkit, this streamlined indicator tracks four valuation-based yield metrics and presents them clearly via the Data Window, GVY Score badge, and an optional Yield Table:
Earnings Yield (EPS ÷ Price)
FCF Yield (Free Cash Flow ÷ Price)
Revenue Yield (Revenue per Share ÷ Price)
Book Value Yield (Book Value per Share ÷ Price)
✅ Each yield is compared against its historical average
✅ A point is scored for each metric above average (0–4 total)
✅ Color-coded GVY Score badge highlights valuation strength
✅ Yield trend-lines Totals (TVAVG & TVPCT) help assess direction
✅ Clean layout: no chart clutter – just actionable insights
🧮 GVY Score Color Coding (0–4):
⬜ 0 = None (White)
⬜ 1 = Weak (Gray)
🟦 2 = Neutral (Aqua)
🟩 3 = Strong (Green)
🟨 4 = Gold Exceptional (All metrics above average)
Total Value Average Line Color Coding:
🟥 Red – Average trending down
🟩 Green – Average trending up
Ideal for long-term investors focused on fundamental valuation, not short-term noise.
Enable the table and badge for a compact yield dashboard — or keep it minimal with just the Data Window and trend-lines.
