MACD Fake Filter [RH]Introducing a new indicator for the TradingView community based on the MACD indicator! This innovative tool goes beyond traditional MACD signals by analyzing positive and negative waves to determine the average height of the waves to filter false cross-over or cross-under signals during the sideways market.
There are two types of waves created by the MACD line, one is a positive wave above the "zero" line and another is a negative wave below "zero" line. Each wave has peaks. This indicator will find the average height of the positive waves' peaks and plot as a green line(by default). Vice-versa it will also find the average height of the negative waves' peaks and plot as a red line(by default).
Example :
This indicator will show labels when the MACD line crosses-under the MACD signal line above the average height of the positive waves.
Vice-versa, the indicator will show labels when the MACD line crosses-above the MACD signal line below the average height of the negative waves.
Example:
Alerts are also available for these types of cross-over and cross-under.
تحليل الموجات

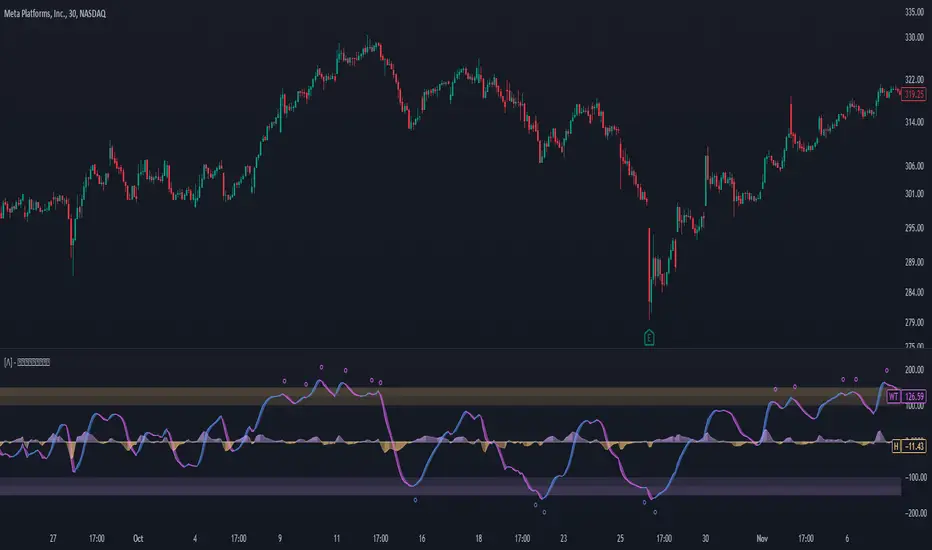
Enhanced WaveTrend OscillatorThe Enhanced WaveTrend Oscillator is a modified version of the original WaveTrend. The WaveTrend indicator is a popular technical analysis tool used to identify overbought and oversold conditions in the market and generate trading signals. The enhanced version addresses certain limitations of the original indicator and introduces additional features for improved analysis and comparison across assets.
WaveTrend:
The original WaveTrend indicator calculates two lines based on exponential moving averages and their relationship to the asset's price. The first line measures the distance between the asset's price and its EMA, while the second line smooths the first line over a specific period. The result is divided by 0.015 multiplied by the smoothed difference ('d' for reference). The indicator aims to identify overbought and oversold conditions by analyzing the relationship between the two lines.
In the original formula, the rudimentary estimation factor 0.015 times 'd' fails to accomodate for approximately a quarter of the data, preventing the indicator from reaching the traditional stationary levels of +-100. This limitation renders the indicator quantitatively biased, as it relies on the user's subjective adjustment of the levels. The enhanced version replaces this factor with the standard deviation of the asset's price, resulting in improved estimation accuracy and provides a more dynamic and robust outcome, we thereafter multiply the result by 100 to achieve a more traditional oscillation.
Enhancements and Features:
The enhanced version of the WaveTrend indicator addresses several limitations of the original indicator and introduces additional features-
Dynamic Estimation: The original indicator uses an arbitrary estimation factor, while the enhanced version replaces it with the standard deviation of the asset's price. This modification provides a more dynamic and accurate estimation, adapting to the specific price characteristics of each asset.
Stationary Support and Resistance Levels: The enhanced version provides stationary key support and resistance levels that range from -150 to 150. These levels are determined based on the analysis of the indicator's data and encompass more than 95% of the indicator's values. These levels offer important reference points for traders to identify potential price reversals or significant price movements.
Comparison Across Assets: The enhanced version allows for better comparison and analysis across different assets. By incorporating the standard deviation of the asset's price, the indicator provides a more consistent and comparable interpretation of the market conditions across multiple assets.
Upon closer inspection of the modification in the enhanced version, we can observe that the resulting indicator is a smoothed variation of the Z-Score!
f_ewave(src, chlen, avglen) =>
basis = ta.ema(src, chlen)
dev = ta.stdev(src, chlen)
wave = (src - basis) / dev * 100
ta.ema(wave, avglen)
Z-Score Analysis:
The Z-Score is a statistical measurement that quantifies how far a particular data point deviates from the mean in terms of standard deviations. In the enhanced version, the calculation involves determining the basis (mean) and deviation (standard deviation) of the asset's price to calculate its Z-Score, thereafter applying a smoothing technique to generate the final WaveTrend value.
Utility:
The 𝗘𝗻𝗵𝗮𝗻𝗰𝗲𝗱 𝗪𝗧 indicator offers traders and investors valuable insights into overbought and oversold conditions in the market. By analyzing the indicator's values and referencing the stationary support and resistance levels, traders can identify potential trend reversals, evaluate market strength, and make better informed analysis.
It is important to note that this indicator should be used in conjunction with other technical analysis tools and indicators to confirm trading signals and validate market dynamics.
Credit:
The 𝗘𝗻𝗵𝗮𝗻𝗰𝗲𝗱 𝗪𝗧 indicator is a modification of the original WaveTrend Oscillator developed by @LazyBear on TradingView.
Example Charts:
Moving Average CandlesInspired by Ricardo Santos's " Multiple Moving Average Candle System V0" ()
This script plots 6 moving averages using the plotcandle function rather than the normal plot function. Result is a stylish indicator that shows moving average crossovers in a more visual way. Moving average type options available are , or Simple, Exponential, Hull, Relative, Volume Weighted, and Arnaud Legoux Moving Averages, Linear Regression Curve, and Median. Lengths for each can be set in settings along with selection specific parameters. Good for plotting/visualizing potential entry/exit points based on your preferred moving averages crossing over, or just as some eye candy.

Monday_Weekly_Range/ErkOzi/Deviation Level/V1"Hello, first of all, I believe that the most important levels to look at are the weekly Fibonacci levels. I have planned an indicator that automatically calculates this. It models a range based on the weekly opening, high, and low prices, which is well-detailed and clear in my scans. I hope it will be beneficial for everyone.
***The logic of the Monday_Weekly_Range indicator is to analyze the weekly price movement based on the trading range formed on Mondays. Here are the detailed logic, calculation, strategy, and components of the indicator:
***Calculation of Monday Range:
The indicator calculates the highest (mondayHigh) and lowest (mondayLow) price levels formed on Mondays.
If the current bar corresponds to Monday, the values of the Monday range are updated. Otherwise, the values are assigned as "na" (undefined).
***Calculation of Monday Range Midpoint:
The midpoint of the Monday range (mondayMidRange) is calculated using the highest and lowest price levels of the Monday range.
***Fibonacci Levels:
// Calculate Fibonacci levels
fib272 = nextMondayHigh + 0.272 * (nextMondayHigh - nextMondayLow)
fib414 = nextMondayHigh + 0.414 * (nextMondayHigh - nextMondayLow)
fib500 = nextMondayHigh + 0.5 * (nextMondayHigh - nextMondayLow)
fib618 = nextMondayHigh + 0.618 * (nextMondayHigh - nextMondayLow)
fibNegative272 = nextMondayLow - 0.272 * (nextMondayHigh - nextMondayLow)
fibNegative414 = nextMondayLow - 0.414 * (nextMondayHigh - nextMondayLow)
fibNegative500 = nextMondayLow - 0.5 * (nextMondayHigh - nextMondayLow)
fibNegative618 = nextMondayLow - 0.618 * (nextMondayHigh - nextMondayLow)
fibNegative1 = nextMondayLow - 1 * (nextMondayHigh - nextMondayLow)
fib2 = nextMondayHigh + 1 * (nextMondayHigh - nextMondayLow)
***Fibonacci levels are calculated using the highest and lowest price levels of the Monday range.
Common Fibonacci ratios such as 0.272, 0.414, 0.50, and 0.618 represent deviation levels of the Monday range.
Additionally, the levels are completed with -1 and +1 to determine at which level the price is within the weekly swing.
***Visualization on the Chart:
The Monday range, midpoint, Fibonacci levels, and other components are displayed on the chart using appropriate shapes and colors.
The indicator provides a visual representation of the Monday range and Fibonacci levels using lines, circles, and other graphical elements.
***Strategy and Usage:
The Monday range represents the starting point of the weekly price movement. This range plays an important role in determining weekly support and resistance levels.
Fibonacci levels are used to identify potential reaction zones and trend reversals. These levels indicate where the price may encounter support or resistance.
You can use the indicator in conjunction with other technical analysis tools and indicators to conduct a more comprehensive analysis. For example, combining it with trendlines, moving averages, or oscillators can enhance the accuracy.
When making investment decisions, it is important to combine the information provided by the indicator with other analysis methods and use risk management strategies.
Thank you in advance for your likes, follows, and comments. If you have any questions, feel free to ask."

Interactive Motive Wave ChecklistHere is an interactive tool that can be used for learning a bit about Elliott Waves
🎲 How it works?
The script upon load asks users to enter 6 pivots in an order. Once all 6 pivots are selected on the interactive chart, the script will calculate if the structure is a valid motive wave.
When you load the script, you will see a prompt on the chart to select points on the chart to form 6 pivots.
When you select the 6 pivots, the checklists are populated on the chart to notify users which conditions for qualifying the selection has passed and which of them are failed.
🎲 Conditions for Motive Wave
Motive wave can be either Impulse or Diagonal Wave. Diagonal wave can be either expanding or contracting diagonals. To learn more about diagonal waves, please go through this idea.
Rules for generic motive waves are as below
Pivots in order - Checks wether the pivots selected are in progressive order.
Directions in order - Checks if the pivot directions are correct - either PH, PL, PH, PL, PH, PL or PL, PH, PL, PH, PL, PH
Wave 2 never moves beyond the start of wave 1 - Wave 2 retracement is less than 100% of wave1
Wave 3 always moves beyond the end of wave 1 - Wave 3 retracement is more than 100% of wave2
Wave 3 is never the shortest one - Checks if Wave 3 is bigger than either Wave 1 or wave 5 or both.
Now, these are the specific rules for Impulse Waves on top of Motive Wave conditions
Wave 4 never moves beyond the end of Wave 1 - meaning wave 1 and wave 4 never overlap on price scale.
Wave 1, 3, 5 are all not extended. We check for retracement ratios of more than 200% to be considered as extended wave.
Below are the conditions for Diagonal Waves on top of Motive Wave conditions
Wave4 never moves beyond the start of Wave 3 - Wave 4 retracement is less than 100%
Wave 4 always ends within the price territory of Wave 1 - Unlike impulse wave, wave 4 intersects with wave 1 in case of diagonal waves. This is the major difference between impulse and diagonal wave.
Waves are progressively expanding or contracting - Wave1 > Wave3 > Wave5 and Wave2 > Wave4 to be contracting diagonal. Wave1 < Wave3 < Wave5 and Wave2 < Wave4 to be expanding diagonal wave.
Here is an example of diagonal wave projection
Here is an example of impulse wave projection

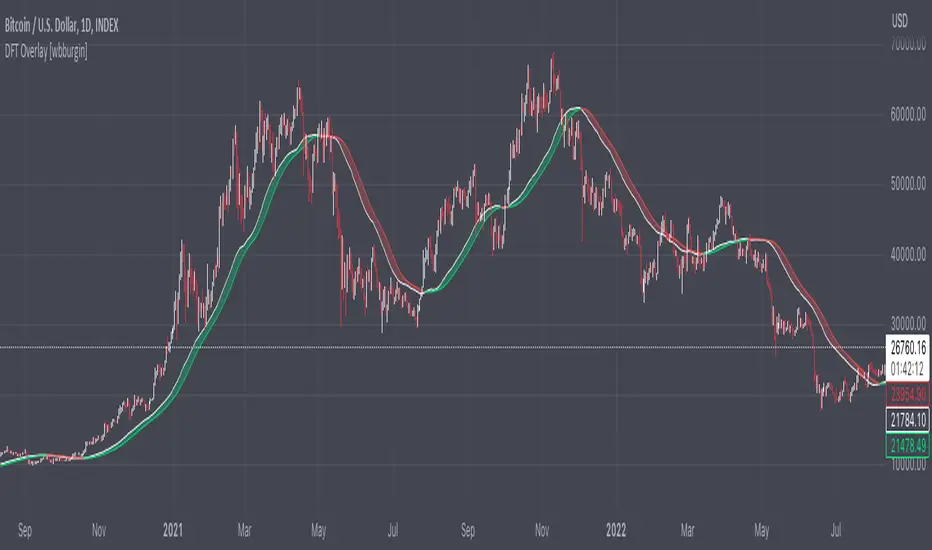
Discrete Fourier Transform Overlay [wbburgin]The discrete Fourier transform (DFT) overlay uses a discrete Fourier transform algorithm to identify trend direction. This is a simpler interpretation that only uses the magnitude of the first frequency component obtained from the DFT algorithm, but can be useful for visualization purposes. I haven't seen many Fourier scripts on TradingView that actually have the magnitude plotted on the chart (some have lines, for instance, but that makes it difficult to look into the past or to see previous lines).
About the Discrete Fourier Transform
The DFT is a mathematical transformation that decomposes a time-domain signal into its constituent frequency components. By applying the DFT to OHLC data, we can interpret the periodicities and trends present in the market. I've designed the overlay so that you can choose your source for the Fourier transform, as well as the length.
Settings and Configuration
The "Fourier Period" is the transform length of the DFT algorithm. This input indicates the number of data points considered for the DFT calculation. For example, if this input is set to 20, the DFT will be performed on the most recent 20 data points of the input series. The transform length affects the resolution and accuracy of the frequency analysis. A shorter transform length may provide a broader frequency range but with less detail, while a longer transform length can provide finer frequency resolution but may be computationally more intensive (I recommend using under 100 - anything above that might take too much time to load on the platform).
The "Fourier X Series" is the source you want the Fourier transform to be applied to. I have it set in default to the close.
"Kernel Smoothing" is the bar-start of the rational quadratic kernel used to smooth the frequency component. Think of it just like a normal moving average if you are unfamiliar with the concept, it functions similarly to the "length" value of a moving average.
Dual Dynamic Fibonacci Retracement — Long and Short Duration
Title : "The Dual-Dynamic Fibonacci Retracement Script: An Advanced Tool for Comprehensive Market Analysis"
As the author of the "Dual-Dynamic Fibonacci Retracement Script", I am delighted to introduce you to this cutting-edge tool for technical analysis. Unlike conventional Fibonacci scripts, this advanced model incorporates multiple unique features and adjustments that make it a powerful asset for any market analyst. Whether you're dealing with forex, commodities, equities or any other market, this script is versatile enough to enhance your trading strategy.
Uniqueness & Differentiation:
The "Dual-Dynamic Fibonacci Script" stands out by offering two distinct lookback periods. This feature is what separates it from other scripts available in the market. The first lookback period is longer, focusing on capturing broader market trends. The second lookback period is shorter, allowing for a more granular analysis of near-term market fluctuations. This dual perspective provides a more comprehensive view of the market, allowing you to see both the forest and the trees at the same time.
Fibonacci Levels:
While offering the standard Fibonacci retracement levels (0.236, 0.382, 0.5, 0.618, 0.786, and 1.0), the script also gives you the ability to plot 0.114 and 0.886 levels. These additional levels offer an extra layer of depth to your analysis, and can prove crucial in high-volatility markets where they often serve as significant support and resistance points.
Customizable Line Shifts and Extends:
This script provides options for customization of the shift and extension of the plotted lines. This means you can adjust the start and end points of the Fibonacci lines according to your personal trading style and strategy. This level of personalization is not typically available in other scripts, and it allows for a more tailored visual representation.
Flexible Trading Positioning:
Depending on whether the closing price is above or below the midpoint of the pivot high and pivot low, the Fibonacci retracement levels are adjusted accordingly. This ensures the script remains relevant and useful regardless of market conditions.
Clean Visualization:
To prevent clutter and maintain focus on the most relevant price action, the script removes old Fibonacci lines and plots new ones once a new pivot high or low is identified. This clean visualization helps keep your analysis focused and sharp.
How to Use the Script:
To get started, simply adjust the lookback periods according to your trading strategy. If you're a long-term investor or prefer swing trading, a longer lookback period might be appropriate. Conversely, if you're a day trader, a shorter lookback period might be more beneficial.
The "Shift" and "Extend" inputs allow you to control the positioning of the Fibonacci lines on your chart. Positive values shift the lines to the right, while negative values shift them to the left.
You also have the choice to plot the additional Fibonacci levels (0.114 and 0.886) via the "Plot 0.114 and 0.886 levels?" input. Similarly, the "Plot second set of levels?" input lets you decide whether to display the second set of Fibonacci levels derived from the shorter lookback period.
Like any technical analysis tool, this script is most effective when used in conjunction with other indicators and methods of analysis. It is designed to work well in trending markets, where Fibonacci retracements can often indicate potential reversal levels. However, it's always recommended to use a holistic approach to market analysis to maximize the likelihood of successful trades.
Note: the two lines drawn on the chart are there to help the user identify the levels from which the two respective Fib sequences are calculated.
~~~
Input Explanations:
Long Period Pivot High/Low Lookback and Short Period Pivot High/Low Lookback : These settings determine the length of the lookback periods for the long-term and short-term pivot points, respectively. A pivot point is a technical analysis indicator used to determine the overall trend of the market over different time frames. The pivot points are then used to calculate the Fibonacci levels. A longer lookback period will identify pivot points over a broader time frame, capturing major market trends, while a shorter lookback period will identify pivot points over a narrower time frame, capturing more immediate market movements.
Long Period Fibonacci Level Shift and Short Period Fibonacci Level Shift : These inputs control the shift of the Fibonacci levels based on the long and short lookback periods, respectively. If you want to shift the Fibonacci levels to the right, increase the value. If you want to shift the Fibonacci levels to the left, decrease the value. This allows you to adjust the Fibonacci levels to better align with your analysis.
Long Period Fibonacci Level Extend and Short Period Fibonacci Level Extend : These inputs control the extension of the Fibonacci levels based on the long and short lookback periods, respectively. If you want the Fibonacci levels to extend further to the right, increase the value. If you want the Fibonacci levels to extend less to the right, decrease the value. This feature provides the flexibility to adjust the length of the Fibonacci levels according to your personal trading preferences and strategy.
Plot 0.114 and 0.886 levels? : This setting gives you the ability to plot the additional 0.114 and 0.886 Fibonacci levels. These levels provide extra depth to your analysis, particularly in highly volatile markets where they can act as significant support and resistance levels.
Plot second set of levels? : This input allows you to decide whether to plot the second set of Fibonacci levels based on the short lookback period. Displaying this second set of levels can provide a more granular view of market movements and potential reversal points, enhancing your overall analysis.

SuperBollingerTrend (Expo)█ Overview
The SuperBollingerTrend indicator is a combination of two popular technical analysis tools, Bollinger Bands, and SuperTrend. By fusing these two indicators, SuperBollingerTrend aims to provide traders with a more comprehensive view of the market, accounting for both volatility and trend direction. By combining trend identification with volatility analysis, the SuperBollingerTrend indicator provides traders with valuable insights into potential trend changes. It recognizes that high volatility levels often accompany stronger price momentum, which can result in the formation of new trends or the continuation of existing ones.
█ How Volatility Impacts Trends
Volatility can impact trends by expanding or contracting them, triggering trend reversals, leading to breakouts, and influencing risk management decisions. Traders need to analyze and monitor volatility levels in conjunction with trend analysis to gain a comprehensive understanding of market dynamics.
█ How to use
Trend Reversals: High volatility can result in more dramatic price fluctuations, which may lead to sharp trend reversals. For example, a sudden increase in volatility can cause a bullish trend to transition into a bearish one, or vice versa, as traders react to significant price swings.
Volatility Breakouts: Volatility can trigger breakouts in trends. Breakouts occur when the price breaks through a significant support or resistance level, indicating a potential shift in the trend. Higher volatility levels can increase the likelihood of breakouts, as they indicate stronger market momentum and increased buying or selling pressure. This indicator triggers when the volatility increases, and if the price is near a key level when the indicator alerts, it might trigger a great trend.
█ Features
Peak Signal Move
The indicator calculates the peak price move for each ZigZag and displays it under each signal. This highlights how much the market moved between the signals.
Average ZigZag Move
All price moves between two signals are stored, and the average or the median is calculated and displayed in a table. This gives traders a great idea of how much the market moves on average between two signals.
Take Profit
The Take Profit line is placed at the average or the median price move and gives traders a great idea of what they can expect in average profit from the latest signals.
-----------------
Disclaimer
The information contained in my Scripts/Indicators/Ideas/Algos/Systems does not constitute financial advice or a solicitation to buy or sell any securities of any type. I will not accept liability for any loss or damage, including without limitation any loss of profit, which may arise directly or indirectly from the use of or reliance on such information.
All investments involve risk, and the past performance of a security, industry, sector, market, financial product, trading strategy, backtest, or individual's trading does not guarantee future results or returns. Investors are fully responsible for any investment decisions they make. Such decisions should be based solely on an evaluation of their financial circumstances, investment objectives, risk tolerance, and liquidity needs.
My Scripts/Indicators/Ideas/Algos/Systems are only for educational purposes!

Triple Top Patterns [theEccentricTrader]█ OVERVIEW
This indicator automatically draws triple top patterns and price projections derived from the ranges that constitute the patterns.
█ CONCEPTS
Green and Red Candles
• A green candle is one that closes with a close price equal to or above the price it opened.
• A red candle is one that closes with a close price that is lower than the price it opened.
Swing Highs and Swing Lows
• A swing high is a green candle or series of consecutive green candles followed by a single red candle to complete the swing and form the peak.
• A swing low is a red candle or series of consecutive red candles followed by a single green candle to complete the swing and form the trough.
Peak and Trough Prices (Basic)
• The peak price of a complete swing high is the high price of either the red candle that completes the swing high or the high price of the preceding green candle, depending on which is higher.
• The trough price of a complete swing low is the low price of either the green candle that completes the swing low or the low price of the preceding red candle, depending on which is lower.
Historic Peaks and Troughs
The current, or most recent, peak and trough occurrences are referred to as occurrence zero. Previous peak and trough occurrences are referred to as historic and ordered numerically from right to left, with the most recent historic peak and trough occurrences being occurrence one.
Broken and Unbroken Peaks and Troughs
Upon the completion of a new swing low the high of the green candle that completes the swing low will be above, below or equal to the current peak price. And similarly, upon the completion of a new swing high the low of the red candle that completes the swing high will be above, below or equal to the current trough price.
If the high price of the green candle that completes the current swing low is higher than or equal to the current peak price then the current peak is broken. If the high of the green candle that completes the current swing low is below the current peak price, then the current peak is unbroken.
Similarly, if the low price of the red candle that completes the current swing high is lower than or equal to the current trough price then the current trough is broken. If the low price of the red candle that completes the current swing high is above the current trough price, then the current trough is unbroken.
Range
The range is simply the difference between the current peak and current trough prices, generally expressed in terms of points or pips.
Retracement and Extension Ratios
Retracement and extension ratios are calculated by dividing the current range by the preceding range and multiplying the answer by 100. Retracement ratios are those that are equal to or below 100% of the preceding range and extension ratios are those that are above 100% of the preceding range.
Triple Bottom and Triple Top Patterns
• Triple bottom patterns are composed of two peaks and three troughs, with the second and third troughs being roughly equal to the first trough.
• Triple top patterns are composed of two troughs and three peaks, with the second and third peaks being roughly equal to the first peak.
Measurement Tolerances
In general, tolerance in measurements refers to the allowable variation or deviation from a specific value or dimension. It is the range within which a particular measurement is considered to be acceptable or accurate. In this script I have applied this concept to the measurement of triple bottom and triple top patterns to increase to the frequency of pattern occurrences.
For example, a perfect triple bottom is very rare. We can increase the frequency of pattern occurrences by setting a tolerance. A ratio tolerance of 10% to both downside and upside, which is the default setting, means we would have a tolerable ratio measurement range between 90-110% for the second and third troughs as ratios of the first trough, thus increasing the frequency of occurrence.
█ FEATURES
Inputs
• Unbroken Troughs
• Lower Tolerance
• Upper Tolerance
• Pattern Color
• Neckline Color
• Extend Current Neckline
• Show Labels
• Label Color
• Show Projection Lines
• Extend Current Projection Lines
Alerts
Users can set alerts for when the patterns occur.
█ LIMITATIONS
All green and red candle calculations are based on differences between open and close prices, as such I have made no attempt to account for green candles that gap lower and close below the close price of the preceding candle, or red candles that gap higher and close above the close price of the preceding candle. This may cause some unexpected behaviour on some markets and timeframes. I can only recommend using 24-hour markets, if and where possible, as there are far fewer gaps and, generally, more data to work with.

Triple Bottom Patterns [theEccentricTrader]█ OVERVIEW
This indicator automatically draws triple bottom patterns and price projections derived from the ranges that constitute the patterns.
█ CONCEPTS
Green and Red Candles
• A green candle is one that closes with a close price equal to or above the price it opened.
• A red candle is one that closes with a close price that is lower than the price it opened.
Swing Highs and Swing Lows
• A swing high is a green candle or series of consecutive green candles followed by a single red candle to complete the swing and form the peak.
• A swing low is a red candle or series of consecutive red candles followed by a single green candle to complete the swing and form the trough.
Peak and Trough Prices (Basic)
• The peak price of a complete swing high is the high price of either the red candle that completes the swing high or the high price of the preceding green candle, depending on which is higher.
• The trough price of a complete swing low is the low price of either the green candle that completes the swing low or the low price of the preceding red candle, depending on which is lower.
Historic Peaks and Troughs
The current, or most recent, peak and trough occurrences are referred to as occurrence zero. Previous peak and trough occurrences are referred to as historic and ordered numerically from right to left, with the most recent historic peak and trough occurrences being occurrence one.
Broken and Unbroken Peaks and Troughs
Upon the completion of a new swing low the high of the green candle that completes the swing low will be above, below or equal to the current peak price. And similarly, upon the completion of a new swing high the low of the red candle that completes the swing high will be above, below or equal to the current trough price.
If the high price of the green candle that completes the current swing low is higher than or equal to the current peak price then the current peak is broken. If the high of the green candle that completes the current swing low is below the current peak price, then the current peak is unbroken.
Similarly, if the low price of the red candle that completes the current swing high is lower than or equal to the current trough price then the current trough is broken. If the low price of the red candle that completes the current swing high is above the current trough price, then the current trough is unbroken.
Range
The range is simply the difference between the current peak and current trough prices, generally expressed in terms of points or pips.
Retracement and Extension Ratios
Retracement and extension ratios are calculated by dividing the current range by the preceding range and multiplying the answer by 100. Retracement ratios are those that are equal to or below 100% of the preceding range and extension ratios are those that are above 100% of the preceding range.
Triple Bottom and Triple Top Patterns
• Triple bottom patterns are composed of two peaks and three troughs, with the second and third troughs being roughly equal to the first trough.
• Triple top patterns are composed of two troughs and three peaks, with the second and third peaks being roughly equal to the first peak.
Measurement Tolerances
In general, tolerance in measurements refers to the allowable variation or deviation from a specific value or dimension. It is the range within which a particular measurement is considered to be acceptable or accurate. In this script I have applied this concept to the measurement of triple bottom and triple top patterns to increase to the frequency of pattern occurrences.
For example, a perfect triple bottom is very rare. We can increase the frequency of pattern occurrences by setting a tolerance. A ratio tolerance of 10% to both downside and upside, which is the default setting, means we would have a tolerable ratio measurement range between 90-110% for the second and third troughs as ratios of the first trough, thus increasing the frequency of occurrence.
█ FEATURES
Inputs
• Unbroken Peaks
• Lower Tolerance
• Upper Tolerance
• Pattern Color
• Neckline Color
• Extend Current Neckline
• Show Labels
• Label Color
• Show Projection Lines
• Extend Current Projection Lines
Alerts
Users can set alerts for when the patterns occur.
█ LIMITATIONS
All green and red candle calculations are based on differences between open and close prices, as such I have made no attempt to account for green candles that gap lower and close below the close price of the preceding candle, or red candles that gap higher and close above the close price of the preceding candle. This may cause some unexpected behaviour on some markets and timeframes. I can only recommend using 24-hour markets, if and where possible, as there are far fewer gaps and, generally, more data to work with.

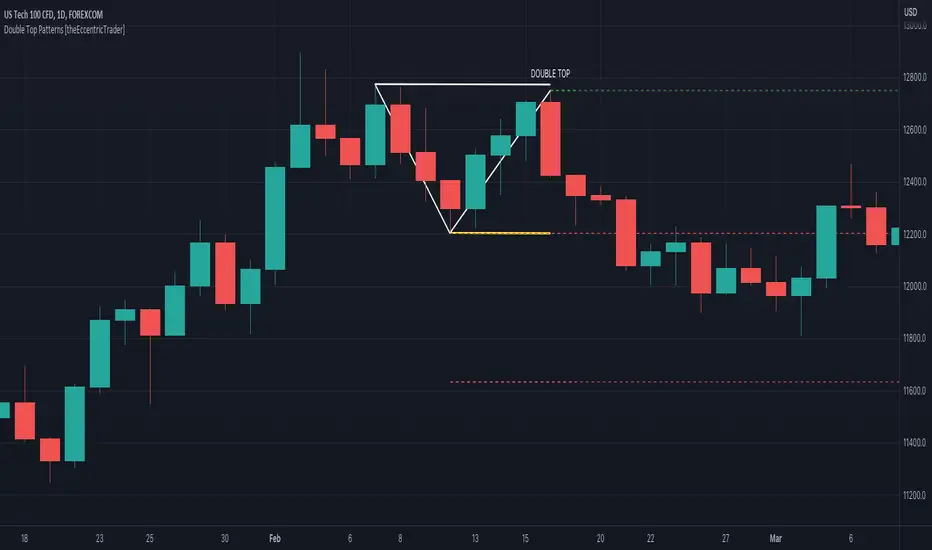
Double Top Patterns [theEccentricTrader]█ OVERVIEW
This indicator automatically draws double top patterns and price projections derived from the ranges that constitute the patterns.
█ CONCEPTS
Green and Red Candles
• A green candle is one that closes with a close price equal to or above the price it opened.
• A red candle is one that closes with a close price that is lower than the price it opened.
Swing Highs and Swing Lows
• A swing high is a green candle or series of consecutive green candles followed by a single red candle to complete the swing and form the peak.
• A swing low is a red candle or series of consecutive red candles followed by a single green candle to complete the swing and form the trough.
Peak and Trough Prices (Basic)
• The peak price of a complete swing high is the high price of either the red candle that completes the swing high or the high price of the preceding green candle, depending on which is higher.
• The trough price of a complete swing low is the low price of either the green candle that completes the swing low or the low price of the preceding red candle, depending on which is lower.
Historic Peaks and Troughs
The current, or most recent, peak and trough occurrences are referred to as occurrence zero. Previous peak and trough occurrences are referred to as historic and ordered numerically from right to left, with the most recent historic peak and trough occurrences being occurrence one.
Broken and Unbroken Peaks and Troughs
Upon the completion of a new swing low the high of the green candle that completes the swing low will be above, below or equal to the current peak price. And similarly, upon the completion of a new swing high the low of the red candle that completes the swing high will be above, below or equal to the current trough price.
If the high price of the green candle that completes the current swing low is higher than or equal to the current peak price then the current peak is broken. If the high of the green candle that completes the current swing low is below the current peak price, then the current peak is unbroken.
Similarly, if the low price of the red candle that completes the current swing high is lower than or equal to the current trough price then the current trough is broken. If the low price of the red candle that completes the current swing high is above the current trough price, then the current trough is unbroken.
Range
The range is simply the difference between the current peak and current trough prices, generally expressed in terms of points or pips.
Retracement and Extension Ratios
Retracement and extension ratios are calculated by dividing the current range by the preceding range and multiplying the answer by 100. Retracement ratios are those that are equal to or below 100% of the preceding range and extension ratios are those that are above 100% of the preceding range.
Double Bottom and Double Top Patterns
• Double bottom patterns are composed of one peak and two troughs, with the second trough being roughly equal to the first trough.
• Double top patterns are composed of one trough and two peaks, with the second peak being roughly equal to the first peak.
Measurement Tolerances
In general, tolerance in measurements refers to the allowable variation or deviation from a specific value or dimension. It is the range within which a particular measurement is considered to be acceptable or accurate. In this script I have applied this concept to the measurement of double bottom and double top patterns to increase to the frequency of pattern occurrences.
For example, a perfect double bottom is very rare. We can increase the frequency of pattern occurrences by setting a tolerance. A ratio tolerance of 10% to both downside and upside, which is the default setting, means we would have a tolerable ratio measurement range between 90-110% for the second trough, thus increasing the frequency of occurrence.
█ FEATURES
Inputs
• Unbroken Troughs
• Lower Tolerance
• Upper Tolerance
• Pattern Color
• Neckline Color
• Extend Current Neckline
• Show Labels
• Label Color
• Show Projection Lines
• Extend Current Projection Lines
Alerts
Users can set alerts for when the patterns occur.
█ LIMITATIONS
All green and red candle calculations are based on differences between open and close prices, as such I have made no attempt to account for green candles that gap lower and close below the close price of the preceding candle, or red candles that gap higher and close above the close price of the preceding candle. This may cause some unexpected behaviour on some markets and timeframes. I can only recommend using 24-hour markets, if and where possible, as there are far fewer gaps and, generally, more data to work with.
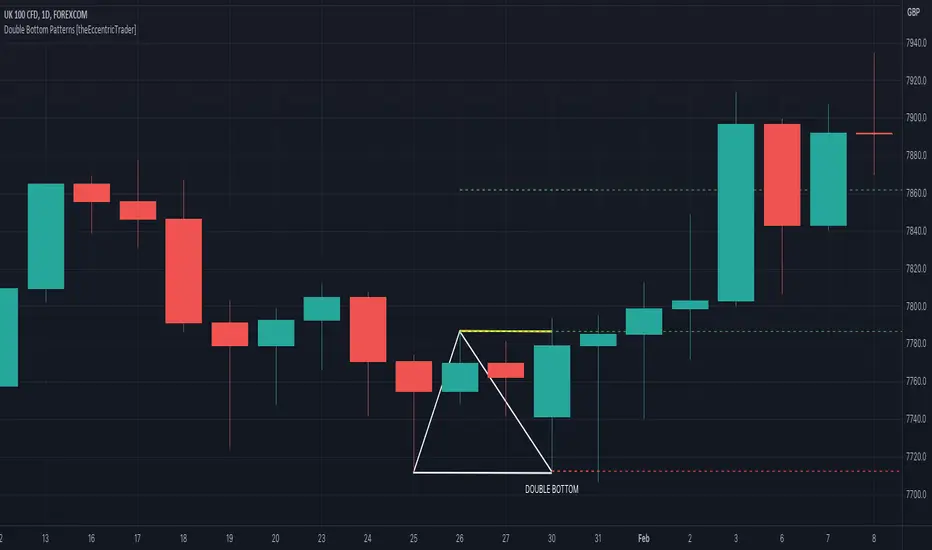
Double Bottom Patterns [theEccentricTrader]█ OVERVIEW
This indicator automatically draws double bottom patterns and price projections derived from the ranges that constitute the patterns.
█ CONCEPTS
Green and Red Candles
• A green candle is one that closes with a close price equal to or above the price it opened.
• A red candle is one that closes with a close price that is lower than the price it opened.
Swing Highs and Swing Lows
• A swing high is a green candle or series of consecutive green candles followed by a single red candle to complete the swing and form the peak.
• A swing low is a red candle or series of consecutive red candles followed by a single green candle to complete the swing and form the trough.
Peak and Trough Prices (Basic)
• The peak price of a complete swing high is the high price of either the red candle that completes the swing high or the high price of the preceding green candle, depending on which is higher.
• The trough price of a complete swing low is the low price of either the green candle that completes the swing low or the low price of the preceding red candle, depending on which is lower.
Historic Peaks and Troughs
The current, or most recent, peak and trough occurrences are referred to as occurrence zero. Previous peak and trough occurrences are referred to as historic and ordered numerically from right to left, with the most recent historic peak and trough occurrences being occurrence one.
Broken and Unbroken Peaks and Troughs
Upon the completion of a new swing low the high of the green candle that completes the swing low will be above, below or equal to the current peak price. And similarly, upon the completion of a new swing high the low of the red candle that completes the swing high will be above, below or equal to the current trough price.
If the high price of the green candle that completes the current swing low is higher than or equal to the current peak price then the current peak is broken. If the high of the green candle that completes the current swing low is below the current peak price, then the current peak is unbroken.
Similarly, if the low price of the red candle that completes the current swing high is lower than or equal to the current trough price then the current trough is broken. If the low price of the red candle that completes the current swing high is above the current trough price, then the current trough is unbroken.
Range
The range is simply the difference between the current peak and current trough prices, generally expressed in terms of points or pips.
Retracement and Extension Ratios
Retracement and extension ratios are calculated by dividing the current range by the preceding range and multiplying the answer by 100. Retracement ratios are those that are equal to or below 100% of the preceding range and extension ratios are those that are above 100% of the preceding range.
Double Bottom and Double Top Patterns
• Double bottom patterns are composed of one peak and two troughs, with the second trough being roughly equal to the first trough.
• Double top patterns are composed of one trough and two peaks, with the second peak being roughly equal to the first peak.
Measurement Tolerances
In general, tolerance in measurements refers to the allowable variation or deviation from a specific value or dimension. It is the range within which a particular measurement is considered to be acceptable or accurate. In this script I have applied this concept to the measurement of double bottom and double top patterns to increase to the frequency of pattern occurrences.
For example, a perfect double bottom is very rare. We can increase the frequency of pattern occurrences by setting a tolerance. A ratio tolerance of 10% to both downside and upside, which is the default setting, means we would have a tolerable ratio measurement range between 90-110% for the second trough, thus increasing the frequency of occurrence.
█ FEATURES
Inputs
• Unbroken Peaks
• Lower Tolerance
• Upper Tolerance
• Pattern Color
• Neckline Color
• Extend Current Neckline
• Show Labels
• Label Color
• Show Projection Lines
• Extend Current Projection Lines
Alerts
Users can set alerts for when the patterns occur.
█ LIMITATIONS
All green and red candle calculations are based on differences between open and close prices, as such I have made no attempt to account for green candles that gap lower and close below the close price of the preceding candle, or red candles that gap higher and close above the close price of the preceding candle. This may cause some unexpected behaviour on some markets and timeframes. I can only recommend using 24-hour markets, if and where possible, as there are far fewer gaps and, generally, more data to work with.
Bearish Alternate Flag Patterns [theEccentricTrader]█ OVERVIEW
This indicator automatically draws bearish alternate flag patterns and price projections derived from the ranges that constitute the patterns.
█ CONCEPTS
Green and Red Candles
• A green candle is one that closes with a close price equal to or above the price it opened.
• A red candle is one that closes with a close price that is lower than the price it opened.
Swing Highs and Swing Lows
• A swing high is a green candle or series of consecutive green candles followed by a single red candle to complete the swing and form the peak.
• A swing low is a red candle or series of consecutive red candles followed by a single green candle to complete the swing and form the trough.
Peak and Trough Prices (Basic)
• The peak price of a complete swing high is the high price of either the red candle that completes the swing high or the high price of the preceding green candle, depending on which is higher.
• The trough price of a complete swing low is the low price of either the green candle that completes the swing low or the low price of the preceding red candle, depending on which is lower.
Historic Peaks and Troughs
The current, or most recent, peak and trough occurrences are referred to as occurrence zero. Previous peak and trough occurrences are referred to as historic and ordered numerically from right to left, with the most recent historic peak and trough occurrences being occurrence one.
Broken and Unbroken Peaks and Troughs
Upon the completion of a new swing low the high of the green candle that completes the swing low will be above, below or equal to the current peak price. And similarly, upon the completion of a new swing high the low of the red candle that completes the swing high will be above, below or equal to the current trough price.
If the high price of the green candle that completes the current swing low is higher than or equal to the current peak price then the current peak is broken. If the high of the green candle that completes the current swing low is below the current peak price, then the current peak is unbroken.
Similarly, if the low price of the red candle that completes the current swing high is lower than or equal to the current trough price then the current trough is broken. If the low price of the red candle that completes the current swing high is above the current trough price, then the current trough is unbroken.
Range
The range is simply the difference between the current peak and current trough prices, generally expressed in terms of points or pips.
Upper Trends
• A return line uptrend is formed when the current peak price is higher than the preceding peak price.
• A downtrend is formed when the current peak price is lower than the preceding peak price.
• A double-top is formed when the current peak price is equal to the preceding peak price.
Lower Trends
• An uptrend is formed when the current trough price is higher than the preceding trough price.
• A return line downtrend is formed when the current trough price is lower than the preceding trough price.
• A double-bottom is formed when the current trough price is equal to the preceding trough price.
Wave Cycles
A wave cycle is here defined as a complete two-part move between a swing high and a swing low, or a swing low and a swing high. The first swing high or swing low will set the course for the sequence of wave cycles that follow; for example a chart that begins with a swing low will form its first complete wave cycle upon the formation of the first complete swing high and vice versa.
Figure 1.
Retracement and Extension Ratios
Retracement and extension ratios are calculated by dividing the current range by the preceding range and multiplying the answer by 100. Retracement ratios are those that are equal to or below 100% of the preceding range and extension ratios are those that are above 100% of the preceding range.
Bullish and Bearish Alternate Flag Patterns
• Bullish alternate flags are composed of one peak and two troughs. The second trough being higher than the first.
• Bearish alternate flags are composed of one trough and two peaks. The second peak being lower than the first.
In this script I have used minimum and maximum retracement and extension ratios to set parameters for pattern identification:
• Wave 1 of the pattern, referred to as AB, is set to a minimum ratio of 100%.
• Wave 2 of the pattern, referred to as BC, is set to a maximum ratio of 30%.
█ FEATURES
Inputs
• Unbroken Troughs
• AB Minimum Ratio
• BC Maximum Ratio
• Pole Color
• Flag Color
• Extend Current Flag Lines
• Show Labels
• Label Color
• Show Projection Lines
• Extend Current Projection Lines
Alerts
Users can set alerts for when the patterns occur.
█ LIMITATIONS
All green and red candle calculations are based on differences between open and close prices, as such I have made no attempt to account for green candles that gap lower and close below the close price of the preceding candle, or red candles that gap higher and close above the close price of the preceding candle. This may cause some unexpected behaviour on some markets and timeframes. I can only recommend using 24-hour markets, if and where possible, as there are far fewer gaps and, generally, more data to work with.

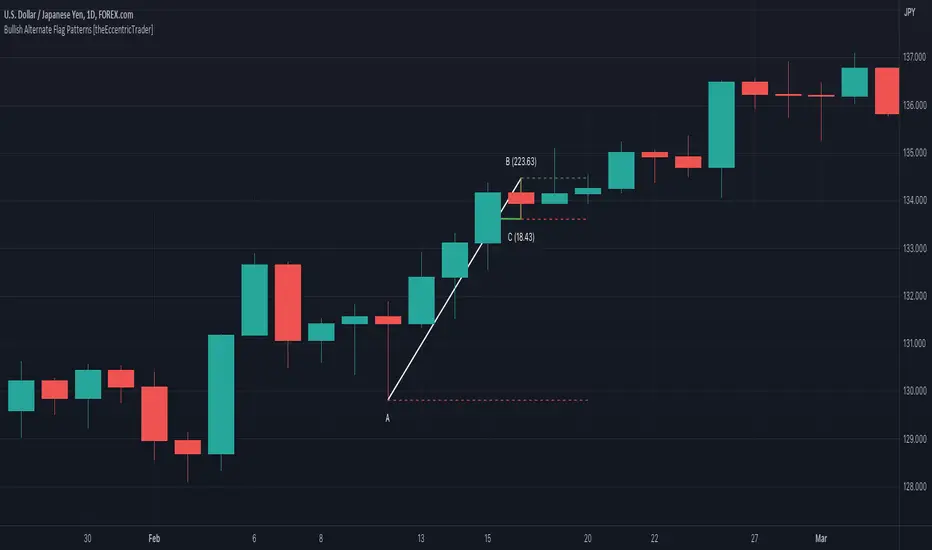
Bullish Alternate Flag Patterns [theEccentricTrader]█ OVERVIEW
This indicator automatically draws bullish alternate flag patterns and price projections derived from the ranges that constitute the patterns.
█ CONCEPTS
Green and Red Candles
• A green candle is one that closes with a close price equal to or above the price it opened.
• A red candle is one that closes with a close price that is lower than the price it opened.
Swing Highs and Swing Lows
• A swing high is a green candle or series of consecutive green candles followed by a single red candle to complete the swing and form the peak.
• A swing low is a red candle or series of consecutive red candles followed by a single green candle to complete the swing and form the trough.
Peak and Trough Prices (Basic)
• The peak price of a complete swing high is the high price of either the red candle that completes the swing high or the high price of the preceding green candle, depending on which is higher.
• The trough price of a complete swing low is the low price of either the green candle that completes the swing low or the low price of the preceding red candle, depending on which is lower.
Historic Peaks and Troughs
The current, or most recent, peak and trough occurrences are referred to as occurrence zero. Previous peak and trough occurrences are referred to as historic and ordered numerically from right to left, with the most recent historic peak and trough occurrences being occurrence one.
Broken and Unbroken Peaks and Troughs
Upon the completion of a new swing low the high of the green candle that completes the swing low will be above, below or equal to the current peak price. And similarly, upon the completion of a new swing high the low of the red candle that completes the swing high will be above, below or equal to the current trough price.
If the high price of the green candle that completes the current swing low is higher than or equal to the current peak price then the current peak is broken. If the high of the green candle that completes the current swing low is below the current peak price, then the current peak is unbroken.
Similarly, if the low price of the red candle that completes the current swing high is lower than or equal to the current trough price then the current trough is broken. If the low price of the red candle that completes the current swing high is above the current trough price, then the current trough is unbroken.
Range
The range is simply the difference between the current peak and current trough prices, generally expressed in terms of points or pips.
Upper Trends
• A return line uptrend is formed when the current peak price is higher than the preceding peak price.
• A downtrend is formed when the current peak price is lower than the preceding peak price.
• A double-top is formed when the current peak price is equal to the preceding peak price.
Lower Trends
• An uptrend is formed when the current trough price is higher than the preceding trough price.
• A return line downtrend is formed when the current trough price is lower than the preceding trough price.
• A double-bottom is formed when the current trough price is equal to the preceding trough price.
Wave Cycles
A wave cycle is here defined as a complete two-part move between a swing high and a swing low, or a swing low and a swing high. The first swing high or swing low will set the course for the sequence of wave cycles that follow; for example a chart that begins with a swing low will form its first complete wave cycle upon the formation of the first complete swing high and vice versa.
Figure 1.
Retracement and Extension Ratios
Retracement and extension ratios are calculated by dividing the current range by the preceding range and multiplying the answer by 100. Retracement ratios are those that are equal to or below 100% of the preceding range and extension ratios are those that are above 100% of the preceding range.
Bullish and Bearish Alternate Flag Patterns
• Bullish alternate flags are composed of one peak and two troughs. The second trough being higher than the first.
• Bearish alternate flags are composed of one trough and two peaks. The second peak being lower than the first.
In this script I have used minimum and maximum retracement and extension ratios to set parameters for pattern identification:
• Wave 1 of the pattern, referred to as AB, is set to a minimum ratio of 100%.
• Wave 2 of the pattern, referred to as BC, is set to a maximum ratio of 30%.
█ FEATURES
Inputs
• Unbroken Peaks
• AB Minimum Ratio
• BC Maximum Ratio
• Pole Color
• Flag Color
• Extend Current Flag Lines
• Show Labels
• Label Color
• Show Projection Lines
• Extend Current Projection Lines
Alerts
Users can set alerts for when the patterns occur.
█ LIMITATIONS
All green and red candle calculations are based on differences between open and close prices, as such I have made no attempt to account for green candles that gap lower and close below the close price of the preceding candle, or red candles that gap higher and close above the close price of the preceding candle. This may cause some unexpected behaviour on some markets and timeframes. I can only recommend using 24-hour markets, if and where possible, as there are far fewer gaps and, generally, more data to work with.
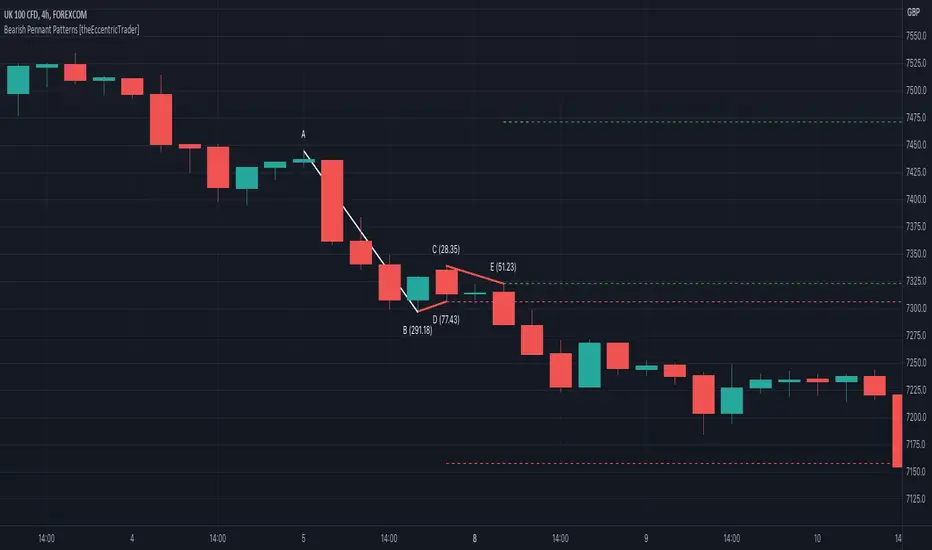
Bearish Pennant Patterns [theEccentricTrader]█ OVERVIEW
This indicator automatically draws bearish pennant patterns and price projections derived from the ranges that constitute the patterns.
█ CONCEPTS
Green and Red Candles
• A green candle is one that closes with a close price equal to or above the price it opened.
• A red candle is one that closes with a close price that is lower than the price it opened.
Swing Highs and Swing Lows
• A swing high is a green candle or series of consecutive green candles followed by a single red candle to complete the swing and form the peak.
• A swing low is a red candle or series of consecutive red candles followed by a single green candle to complete the swing and form the trough.
Peak and Trough Prices (Basic)
• The peak price of a complete swing high is the high price of either the red candle that completes the swing high or the high price of the preceding green candle, depending on which is higher.
• The trough price of a complete swing low is the low price of either the green candle that completes the swing low or the low price of the preceding red candle, depending on which is lower.
Historic Peaks and Troughs
The current, or most recent, peak and trough occurrences are referred to as occurrence zero. Previous peak and trough occurrences are referred to as historic and ordered numerically from right to left, with the most recent historic peak and trough occurrences being occurrence one.
Broken and Unbroken Peaks and Troughs
Upon the completion of a new swing low the high of the green candle that completes the swing low will be above, below or equal to the current peak price. And similarly, upon the completion of a new swing high the low of the red candle that completes the swing high will be above, below or equal to the current trough price.
If the high price of the green candle that completes the current swing low is higher than or equal to the current peak price then the current peak is broken. If the high of the green candle that completes the current swing low is below the current peak price, then the current peak is unbroken.
Similarly, if the low price of the red candle that completes the current swing high is lower than or equal to the current trough price then the current trough is broken. If the low price of the red candle that completes the current swing high is above the current trough price, then the current trough is unbroken.
Range
The range is simply the difference between the current peak and current trough prices, generally expressed in terms of points or pips.
Upper Trends
• A return line uptrend is formed when the current peak price is higher than the preceding peak price.
• A downtrend is formed when the current peak price is lower than the preceding peak price.
• A double-top is formed when the current peak price is equal to the preceding peak price.
Lower Trends
• An uptrend is formed when the current trough price is higher than the preceding trough price.
• A return line downtrend is formed when the current trough price is lower than the preceding trough price.
• A double-bottom is formed when the current trough price is equal to the preceding trough price.
Wave Cycles
A wave cycle is here defined as a complete two-part move between a swing high and a swing low, or a swing low and a swing high. The first swing high or swing low will set the course for the sequence of wave cycles that follow; for example a chart that begins with a swing low will form its first complete wave cycle upon the formation of the first complete swing high and vice versa.
Figure 1.
Retracement and Extension Ratios
Retracement and extension ratios are calculated by dividing the current range by the preceding range and multiplying the answer by 100. Retracement ratios are those that are equal to or below 100% of the preceding range and extension ratios are those that are above 100% of the preceding range.
Bullish and Bearish Pennant Patterns
• Bullish pennants are generally composed of three troughs and two peaks. The first peak being higher than the second peak and the first trough being lower than both the second and third troughs, with the third trough being higher than the second trough.
• Bearish pennants are generally composed of three peaks and two troughs. The first trough being lower than the second trough and the first peak being higher than both the second and third peaks, with third peak being lower than the second peak.
In this script I have used minimum and maximum retracement and extension ratios to set parameters for pattern identification:
• Wave 1 of the pattern, referred to as AB, is set to a minimum ratio of 100%.
• Wave 2 of the pattern, referred to as BC, is set to a maximum ratio of 30%.
• Wave 3 of the pattern, referred to as CD, has no ratio measurements but will always be below 100% by default.
• Wave 4 of the pattern, referred to as DE, has no ratio measurements but will always be below 100% by default.
█ FEATURES
Inputs
• Unbroken Troughs
• AB Minimum Ratio
• BC Maximum Ratio
• Pole Color
• Flag Color
• Extend Current Flag Lines
• Show Labels
• Label Color
• Show Projection Lines
• Extend Current Projection Lines
Alerts
Users can set alerts for when the patterns occur.
█ LIMITATIONS
All green and red candle calculations are based on differences between open and close prices, as such I have made no attempt to account for green candles that gap lower and close below the close price of the preceding candle, or red candles that gap higher and close above the close price of the preceding candle. This may cause some unexpected behaviour on some markets and timeframes. I can only recommend using 24-hour markets, if and where possible, as there are far fewer gaps and, generally, more data to work with.
Bullish Pennant Patterns [theEccentricTrader]█ OVERVIEW
This indicator automatically draws bullish pennant patterns and price projections derived from the ranges that constitute the patterns.
█ CONCEPTS
Green and Red Candles
• A green candle is one that closes with a close price equal to or above the price it opened.
• A red candle is one that closes with a close price that is lower than the price it opened.
Swing Highs and Swing Lows
• A swing high is a green candle or series of consecutive green candles followed by a single red candle to complete the swing and form the peak.
• A swing low is a red candle or series of consecutive red candles followed by a single green candle to complete the swing and form the trough.
Peak and Trough Prices (Basic)
• The peak price of a complete swing high is the high price of either the red candle that completes the swing high or the high price of the preceding green candle, depending on which is higher.
• The trough price of a complete swing low is the low price of either the green candle that completes the swing low or the low price of the preceding red candle, depending on which is lower.
Historic Peaks and Troughs
The current, or most recent, peak and trough occurrences are referred to as occurrence zero. Previous peak and trough occurrences are referred to as historic and ordered numerically from right to left, with the most recent historic peak and trough occurrences being occurrence one.
Broken and Unbroken Peaks and Troughs
Upon the completion of a new swing low the high of the green candle that completes the swing low will be above, below or equal to the current peak price. And similarly, upon the completion of a new swing high the low of the red candle that completes the swing high will be above, below or equal to the current trough price.
If the high price of the green candle that completes the current swing low is higher than or equal to the current peak price then the current peak is broken. If the high of the green candle that completes the current swing low is below the current peak price, then the current peak is unbroken.
Similarly, if the low price of the red candle that completes the current swing high is lower than or equal to the current trough price then the current trough is broken. If the low price of the red candle that completes the current swing high is above the current trough price, then the current trough is unbroken.
Range
The range is simply the difference between the current peak and current trough prices, generally expressed in terms of points or pips.
Upper Trends
• A return line uptrend is formed when the current peak price is higher than the preceding peak price.
• A downtrend is formed when the current peak price is lower than the preceding peak price.
• A double-top is formed when the current peak price is equal to the preceding peak price.
Lower Trends
• An uptrend is formed when the current trough price is higher than the preceding trough price.
• A return line downtrend is formed when the current trough price is lower than the preceding trough price.
• A double-bottom is formed when the current trough price is equal to the preceding trough price.
Muti-Part Upper and Lower Trends
• A multi-part return line uptrend begins with the formation of a new return line uptrend, or higher peak, and continues until a new downtrend, or lower peak, completes the trend.
• A multi-part downtrend begins with the formation of a new downtrend, or lower peak, and continues until a new return line uptrend, or higher peak, completes the trend.
• A multi-part uptrend begins with the formation of a new uptrend, or higher trough, and continues until a new return line downtrend, or lower trough, completes the trend.
• A multi-part return line downtrend begins with the formation of a new return line downtrend, or lower trough, and continues until a new uptrend, or higher trough, completes the trend.
Wave Cycles
A wave cycle is here defined as a complete two-part move between a swing high and a swing low, or a swing low and a swing high. The first swing high or swing low will set the course for the sequence of wave cycles that follow; for example a chart that begins with a swing low will form its first complete wave cycle upon the formation of the first complete swing high and vice versa.
Figure 1.
Retracement and Extension Ratios
Retracement and extension ratios are calculated by dividing the current range by the preceding range and multiplying the answer by 100. Retracement ratios are those that are equal to or below 100% of the preceding range and extension ratios are those that are above 100% of the preceding range.
Bullish and Bearish Pennant Patterns
• Bullish pennants are generally composed of three troughs and two peaks. The first peak being higher than the second peak and the first trough being lower than both the second and third troughs, with the third trough being higher than the second trough.
• Bearish pennants are generally composed of three peaks and two troughs. The first trough being lower than the second trough and the first peak being higher than both the second and third peaks, with third peak being lower than the second peak.
In this script I have used minimum and maximum retracement and extension ratios to set parameters for pattern identification:
• Wave 1 of the pattern, referred to as AB, is set to a minimum ratio of 100%.
• Wave 2 of the pattern, referred to as BC, is set to a maximum ratio of 30%.
• Wave 3 of the pattern, referred to as CD, has no ratio measurements but will always be below 100% by default.
• Wave 4 of the pattern, referred to as DE, has no ratio measurements but will always be below 100% by default.
█ FEATURES
Inputs
• Unbroken Peaks
• AB Minimum Ratio
• BC Maximum Ratio
• Pole Color
• Flag Color
• Extend Current Flag Lines
• Show Labels
• Label Color
• Show Projection Lines
• Extend Current Projection Lines
Alerts
Users can set alerts for when the patterns occur.
█ LIMITATIONS
All green and red candle calculations are based on differences between open and close prices, as such I have made no attempt to account for green candles that gap lower and close below the close price of the preceding candle, or red candles that gap higher and close above the close price of the preceding candle. This may cause some unexpected behaviour on some markets and timeframes. I can only recommend using 24-hour markets, if and where possible, as there are far fewer gaps and, generally, more data to work

Bearish Flag Patterns [theEccentricTrader]█ OVERVIEW
This indicator automatically draws bearish flag patterns and price projections derived from the ranges that constitute the patterns.
█ CONCEPTS
Green and Red Candles
• A green candle is one that closes with a close price equal to or above the price it opened.
• A red candle is one that closes with a close price that is lower than the price it opened.
Swing Highs and Swing Lows
• A swing high is a green candle or series of consecutive green candles followed by a single red candle to complete the swing and form the peak.
• A swing low is a red candle or series of consecutive red candles followed by a single green candle to complete the swing and form the trough.
Peak and Trough Prices (Basic)
• The peak price of a complete swing high is the high price of either the red candle that completes the swing high or the high price of the preceding green candle, depending on which is higher.
• The trough price of a complete swing low is the low price of either the green candle that completes the swing low or the low price of the preceding red candle, depending on which is lower.
Historic Peaks and Troughs
The current, or most recent, peak and trough occurrences are referred to as occurrence zero. Previous peak and trough occurrences are referred to as historic and ordered numerically from right to left, with the most recent historic peak and trough occurrences being occurrence one.
Broken and Unbroken Peaks and Troughs
Upon the completion of a new swing low the high of the green candle that completes the swing low will be above, below or equal to the current peak price. And similarly, upon the completion of a new swing high the low of the red candle that completes the swing high will be above, below or equal to the current trough price.
If the high price of the green candle that completes the current swing low is higher than or equal to the current peak price then the current peak is broken. If the high of the green candle that completes the current swing low is below the current peak price, then the current peak is unbroken.
Similarly, if the low price of the red candle that completes the current swing high is lower than or equal to the current trough price then the current trough is broken. If the low price of the red candle that completes the current swing high is above the current trough price, then the current trough is unbroken.
Range
The range is simply the difference between the current peak and current trough prices, generally expressed in terms of points or pips.
Upper Trends
• A return line uptrend is formed when the current peak price is higher than the preceding peak price.
• A downtrend is formed when the current peak price is lower than the preceding peak price.
• A double-top is formed when the current peak price is equal to the preceding peak price.
Lower Trends
• An uptrend is formed when the current trough price is higher than the preceding trough price.
• A return line downtrend is formed when the current trough price is lower than the preceding trough price.
• A double-bottom is formed when the current trough price is equal to the preceding trough price.
Wave Cycles
A wave cycle is here defined as a complete two-part move between a swing high and a swing low, or a swing low and a swing high. The first swing high or swing low will set the course for the sequence of wave cycles that follow; for example a chart that begins with a swing low will form its first complete wave cycle upon the formation of the first complete swing high and vice versa.
Figure 1.
Retracement and Extension Ratios
Retracement and extension ratios are calculated by dividing the current range by the preceding range and multiplying the answer by 100. Retracement ratios are those that are equal to or below 100% of the preceding range and extension ratios are those that are above 100% of the preceding range.
Bullish and Bearish Flag Patterns
• Bullish flags are generally composed of three troughs and two peaks. The first peak being higher than the second peak and the second trough being higher than the first trough. The third trough must be lower than the second trough but higher than the first.
• Bearish flags are generally composed of three peaks and two troughs. The first trough being lower than the second trough and the second peak being lower than the first peak. The third peak must be higher than the second peak but lower than the first.
In this script I have used minimum and maximum retracement and extension ratios to set parameters for pattern identification:
• Wave 1 of the pattern, referred to as AB, is set to a minimum ratio of 100%.
• Wave 2 of the pattern, referred to as BC, is set to a maximum ratio of 30%.
• Wave 3 of the pattern, referred to as CD, has no ratio measurements but will always be below 100% by default.
• Wave 4 of the pattern, referred to as DE, has no ratio measurements but will always be above 100% by default.
• The last measure, referred to as BE, is that of the range set between points B and E as a ratio of the range set by wave 1, which is set to a maximum ratio of 40%.
█ FEATURES
Inputs
• Unbroken Troughs
• AB Minimum Ratio
• BC Maximum Ratio
• BE Maximum Ratio
• Pole Color
• Flag Color
• Extend Current Flag Lines
• Show Labels
• Label Color
• Show Projection Lines
• Extend Current Projection Lines
Alerts
Users can set alerts for when the patterns occur.
█ LIMITATIONS
All green and red candle calculations are based on differences between open and close prices, as such I have made no attempt to account for green candles that gap lower and close below the close price of the preceding candle, or red candles that gap higher and close above the close price of the preceding candle. This may cause some unexpected behaviour on some markets and timeframes. I can only recommend using 24-hour markets, if and where possible, as there are far fewer gaps and, generally, more data to work with.

Bullish Flag Patterns [theEccentricTrader]█ OVERVIEW
This indicator automatically draws bullish flag patterns and price projections derived from the ranges that constitute the patterns.
█ CONCEPTS
Green and Red Candles
• A green candle is one that closes with a close price equal to or above the price it opened.
• A red candle is one that closes with a close price that is lower than the price it opened.
Swing Highs and Swing Lows
• A swing high is a green candle or series of consecutive green candles followed by a single red candle to complete the swing and form the peak.
• A swing low is a red candle or series of consecutive red candles followed by a single green candle to complete the swing and form the trough.
Peak and Trough Prices (Basic)
• The peak price of a complete swing high is the high price of either the red candle that completes the swing high or the high price of the preceding green candle, depending on which is higher.
• The trough price of a complete swing low is the low price of either the green candle that completes the swing low or the low price of the preceding red candle, depending on which is lower.
Historic Peaks and Troughs
The current, or most recent, peak and trough occurrences are referred to as occurrence zero. Previous peak and trough occurrences are referred to as historic and ordered numerically from right to left, with the most recent historic peak and trough occurrences being occurrence one.
Broken and Unbroken Peaks and Troughs
Upon the completion of a new swing low the high of the green candle that completes the swing low will be above, below or equal to the current peak price. And similarly, upon the completion of a new swing high the low of the red candle that completes the swing high will be above, below or equal to the current trough price.
If the high price of the green candle that completes the current swing low is higher than or equal to the current peak price then the current peak is broken. If the high of the green candle that completes the current swing low is below the current peak price, then the current peak is unbroken.
Similarly, if the low price of the red candle that completes the current swing high is lower than or equal to the current trough price then the current trough is broken. If the low price of the red candle that completes the current swing high is above the current trough price, then the current trough is unbroken.
Range
The range is simply the difference between the current peak and current trough prices, generally expressed in terms of points or pips.
Upper Trends
• A return line uptrend is formed when the current peak price is higher than the preceding peak price.
• A downtrend is formed when the current peak price is lower than the preceding peak price.
• A double-top is formed when the current peak price is equal to the preceding peak price.
Lower Trends
• An uptrend is formed when the current trough price is higher than the preceding trough price.
• A return line downtrend is formed when the current trough price is lower than the preceding trough price.
• A double-bottom is formed when the current trough price is equal to the preceding trough price.
Wave Cycles
A wave cycle is here defined as a complete two-part move between a swing high and a swing low, or a swing low and a swing high. The first swing high or swing low will set the course for the sequence of wave cycles that follow; for example a chart that begins with a swing low will form its first complete wave cycle upon the formation of the first complete swing high and vice versa.
Figure 1.
Retracement and Extension Ratios
Retracement and extension ratios are calculated by dividing the current range by the preceding range and multiplying the answer by 100. Retracement ratios are those that are equal to or below 100% of the preceding range and extension ratios are those that are above 100% of the preceding range.
Bullish and Bearish Flag Patterns
• Bullish flags are generally composed of three troughs and two peaks. The first peak being higher than the second peak and the second trough being higher than the first trough. The third trough must be lower than the second trough but higher than the first.
• Bearish flags are generally composed of three peaks and two troughs. The first trough being lower than the second trough and the second peak being lower than the first peak. The third peak must be higher than the second peak but lower than the first.
In this script I have used minimum and maximum retracement and extension ratios to set parameters for pattern identification:
• Wave 1 of the pattern, referred to as AB, is set to a minimum ratio of 100%.
• Wave 2 of the pattern, referred to as BC, is set to a maximum ratio of 30%.
• Wave 3 of the pattern, referred to as CD, has no ratio measurements but will always be below 100% by default.
• Wave 4 of the pattern, referred to as DE, has no ratio measurements but will always be above 100% by default.
• The last measure, referred to as BE, is that of the range set between points B and E as a ratio of the range set by wave 1, which is set to a maximum ratio of 40%.
█ FEATURES
Inputs
• Unbroken Peaks
• AB Minimum Ratio
• BC Maximum Ratio
• BE Maximum Ratio
• Pole Color
• Flag Color
• Extend Current Flag Lines
• Show Labels
• Label Color
• Show Projection Lines
• Extend Current Projection Lines
Alerts
Users can set alerts for when the patterns occur.
█ LIMITATIONS
All green and red candle calculations are based on differences between open and close prices, as such I have made no attempt to account for green candles that gap lower and close below the close price of the preceding candle, or red candles that gap higher and close above the close price of the preceding candle. This may cause some unexpected behaviour on some markets and timeframes. I can only recommend using 24-hour markets, if and where possible, as there are far fewer gaps and, generally, more data to work with.
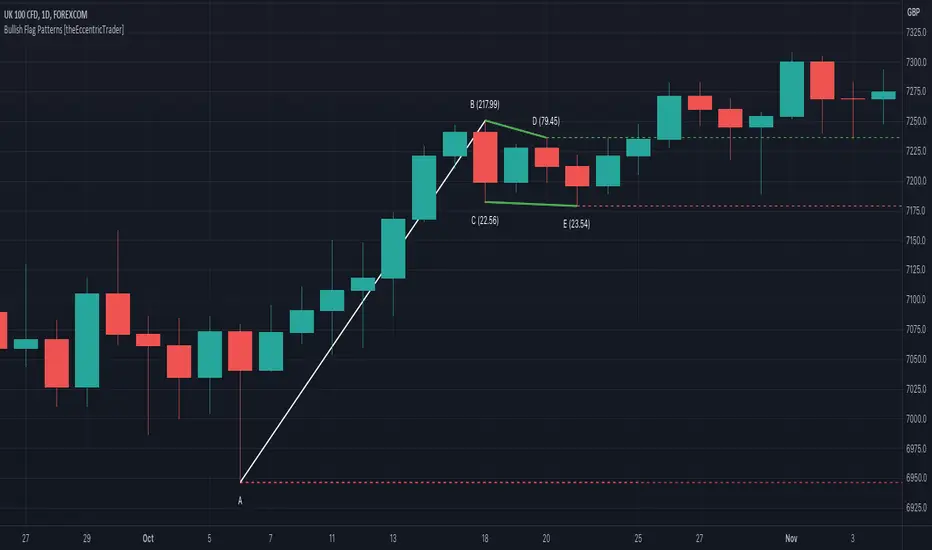
Height of Candle BodyUnderstanding the Height of Candlestick Body
Candlestick charts are a popular method of displaying price data in financial markets. They provide a visual representation of price movements and are used by traders to make informed decisions about buying and selling assets. Understanding the height of a candlestick body is an important aspect of technical analysis and can help traders identify trends and make profitable trades.
The height of a candlestick body is the distance between the opening and closing price of an asset over a given time period. When the closing price is higher than the opening price, the candlestick body is typically colored green or white and is considered bullish. Conversely, when the closing price is lower than the opening price, the candlestick body is typically colored red or black and is considered bearish.
The height of the candlestick body is important because it can provide valuable information about market sentiment. If the candlestick body is relatively small, it suggests that there is indecision in the market and that buyers and sellers are evenly matched. Conversely, if the candlestick body is relatively large, it suggests that there is a significant amount of buying or selling pressure in the market.
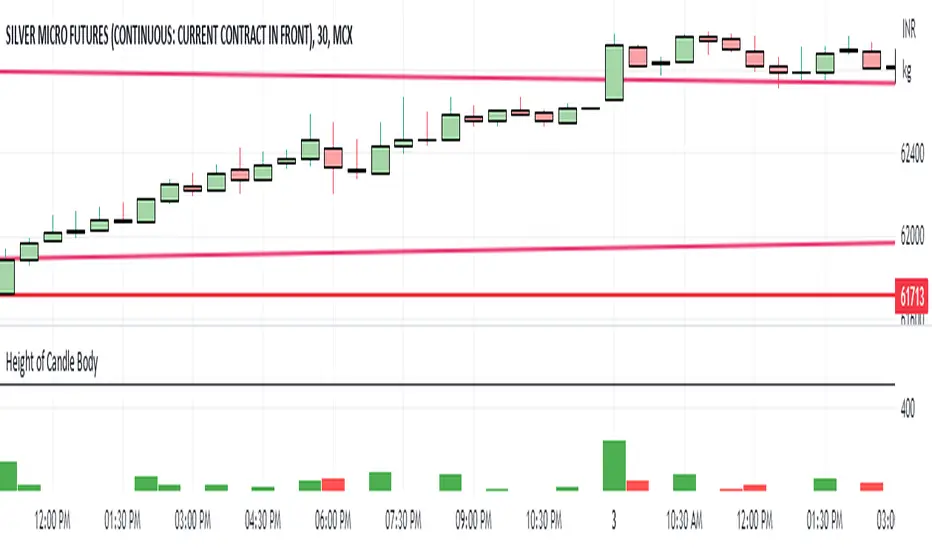
Bearish Cypher Harmonic Patterns [theEccentricTrader]█ OVERVIEW
This indicator automatically draws bearish cypher harmonic patterns and price projections derived from the ranges that constitute the patterns.
█ CONCEPTS
Green and Red Candles
• A green candle is one that closes with a close price equal to or above the price it opened.
• A red candle is one that closes with a close price that is lower than the price it opened.
Swing Highs and Swing Lows
• A swing high is a green candle or series of consecutive green candles followed by a single red candle to complete the swing and form the peak.
• A swing low is a red candle or series of consecutive red candles followed by a single green candle to complete the swing and form the trough.
Peak and Trough Prices (Basic)
• The peak price of a complete swing high is the high price of either the red candle that completes the swing high or the high price of the preceding green candle, depending on which is higher.
• The trough price of a complete swing low is the low price of either the green candle that completes the swing low or the low price of the preceding red candle, depending on which is lower.
Historic Peaks and Troughs
The current, or most recent, peak and trough occurrences are referred to as occurrence zero. Previous peak and trough occurrences are referred to as historic and ordered numerically from right to left, with the most recent historic peak and trough occurrences being occurrence one.
Range
The range is simply the difference between the current peak and current trough prices, generally expressed in terms of points or pips.
Support and Resistance
• Support refers to a price level where the demand for an asset is strong enough to prevent the price from falling further.
• Resistance refers to a price level where the supply of an asset is strong enough to prevent the price from rising further.
Support and resistance levels are important because they can help traders identify where the price of an asset might pause or reverse its direction, offering potential entry and exit points. For example, a trader might look to buy an asset when it approaches a support level , with the expectation that the price will bounce back up. Alternatively, a trader might look to sell an asset when it approaches a resistance level , with the expectation that the price will drop back down.
It's important to note that support and resistance levels are not always relevant, and the price of an asset can also break through these levels and continue moving in the same direction.
Upper Trends
• A return line uptrend is formed when the current peak price is higher than the preceding peak price.
• A downtrend is formed when the current peak price is lower than the preceding peak price.
• A double-top is formed when the current peak price is equal to the preceding peak price.
Lower Trends
• An uptrend is formed when the current trough price is higher than the preceding trough price.
• A return line downtrend is formed when the current trough price is lower than the preceding trough price.
• A double-bottom is formed when the current trough price is equal to the preceding trough price.
Wave Cycles
A wave cycle is here defined as a complete two-part move between a swing high and a swing low, or a swing low and a swing high. The first swing high or swing low will set the course for the sequence of wave cycles that follow; for example a chart that begins with a swing low will form its first complete wave cycle upon the formation of the first complete swing high and vice versa.
Figure 1.
Fibonacci Retracement and Extension Ratios
The Fibonacci sequence is a series of numbers in which each number is the sum of the two preceding numbers, starting with 0 and 1. For example 0 + 1 = 1, 1 + 1 = 2, 1 + 2 = 3, and so on. Ultimately, we could go on forever but the first few numbers in the sequence are as follows: 0 , 1, 1, 2, 3, 5, 8, 13, 21, 34, 55, 89, 144.
The extension ratios are calculated by dividing each number in the sequence by the number preceding it. For example 0/1 = 0, 1/1 = 1, 2/1 = 2, 3/2 = 1.5, 5/3 = 1.6666..., 8/5 = 1.6, 13/8 = 1.625, 21/13 = 1.6153..., 34/21 = 1.6190..., 55/34 = 1.6176..., 89/55 = 1.6181..., 144/89 = 1.6179..., and so on. The retracement ratios are calculated by inverting this process and dividing each number in the sequence by the number proceeding it. For example 0/1 = 0, 1/1 = 1, 1/2 = 0.5, 2/3 = 0.666..., 3/5 = 0.6, 5/8 = 0.625, 8/13 = 0.6153..., 13/21 = 0.6190..., 21/34 = 0.6176..., 34/55 = 0.6181..., 55/89 = 0.6179..., 89/144 = 0.6180..., and so on.
1.618 is considered to be the 'golden ratio', found in many natural phenomena such as the growth of seashells and the branching of trees. Some now speculate the universe oscillates at a frequency of 0,618 Hz, which could help to explain such phenomena, but this theory has yet to be proven.
Traders and analysts use Fibonacci retracement and extension indicators, consisting of horizontal lines representing different Fibonacci ratios, for identifying potential levels of support and resistance. Fibonacci ranges are typically drawn from left to right, with retracement levels representing ratios inside of the current range and extension levels representing ratios extended outside of the current range. If the current wave cycle ends on a swing low, the Fibonacci range is drawn from peak to trough. If the current wave cycle ends on a swing high the Fibonacci range is drawn from trough to peak.
Harmonic Patterns
The concept of harmonic patterns in trading was first introduced by H.M. Gartley in his book "Profits in the Stock Market", published in 1935. Gartley observed that markets have a tendency to move in repetitive patterns, and he identified several specific patterns that he believed could be used to predict future price movements.
Since then, many other traders and analysts have built upon Gartley's work and developed their own variations of harmonic patterns. One such contributor is Larry Pesavento, who developed his own methods for measuring harmonic patterns using Fibonacci ratios. Pesavento has written several books on the subject of harmonic patterns and Fibonacci ratios in trading. Another notable contributor to harmonic patterns is Scott Carney, who developed his own approach to harmonic trading in the late 1990s and also popularised the use of Fibonacci ratios to measure harmonic patterns. Carney expanded on Gartley's work and also introduced several new harmonic patterns, such as the Shark pattern and the 5-0 pattern.
The bullish and bearish Gartley patterns are the oldest recognized harmonic patterns in trading and all the other harmonic patterns are ultimately modifications of the original Gartley patterns. Gartley patterns are fundamentally composed of 5 points, or 4 waves.
Bullish and Bearish Cypher Patterns
• Bullish cypher patterns are fundamentally composed of three troughs and two peaks, with the second peak being higher than the first peak and the second trough being higher than the first trough. The third trough must be lower than the second trough but higher than the first.
• Bearish cypher patterns are fundamentally composed of three peaks and two troughs, with the second trough being lower than the first trough and the second peak being lower than the first peak. The third peak must be higher than the second peak but lower than the first.
The most commonly recognised ratio measures used by traders today are as follows:
• Wave 1 of the pattern, referred to as XA, has no specific ratio requirements.
• Wave 2 of the pattern, referred to as AB, should retrace to at least 38.2%, but no further than 61.8% of the range set by wave 1.
• Wave 3 of the pattern, referred to as BC, should extend to at least 113%, but no further than 141.4% of the range set by wave 2.
• Wave 4 of the pattern, referred to as CD, should extend to at least 127.2%, but no further than 200% of the range set by wave 3.
• The last measure, that of wave 4 as a ratio of the range set between points X and C, referred to as XC, should retrace to 78.6%.
Measurement Tolerances
In general, tolerance in measurements refers to the allowable variation or deviation from a specific value or dimension. It is the range within which a particular measurement is considered to be acceptable or accurate. In this script I have applied this concept to the measurement of harmonic pattern ratios to increase to the frequency of pattern occurrences.
For example, the AB measurement of Gartley patterns is generally set at around 61.8%, but with such specificity in the measuring requirements the patterns are very rare. We can increase the frequency of pattern occurrences by setting a tolerance. A tolerance of 10% to both downside and upside, which is the default setting for all tolerances, means we would have a tolerable measurement range between 51.8-71.8%, thus increasing the frequency of occurrence.
█ FEATURES
Inputs
• AB Lower Tolerance
• AB Upper Tolerance
• BC Lower Tolerance
• BC Upper Tolerance
• CD Lower Tolerance
• CD Upper Tolerance
• XC Lower Tolerance
• XC Upper Tolerance
• Pattern Color
• Label Color
• Show Projections
• Extend Current Projection Lines
Alerts
Users can set alerts for when the patterns occur.
█ LIMITATIONS
All green and red candle calculations are based on differences between open and close prices, as such I have made no attempt to account for green candles that gap lower and close below the close price of the preceding candle, or red candles that gap higher and close above the close price of the preceding candle. This may cause some unexpected behaviour on some markets and timeframes. I can only recommend using 24-hour markets, if and where possible, as there are far fewer gaps and, generally, more data to work with.
█ NOTES
The cypher pattern was initially discovered by Darren Oglesbee, but I was unable to find any direct sources to his work on harmonic patterns. And although there seems to be some contention over whether or not there should be a ratio requirement for the CD wave, I decided to include it nonetheless.
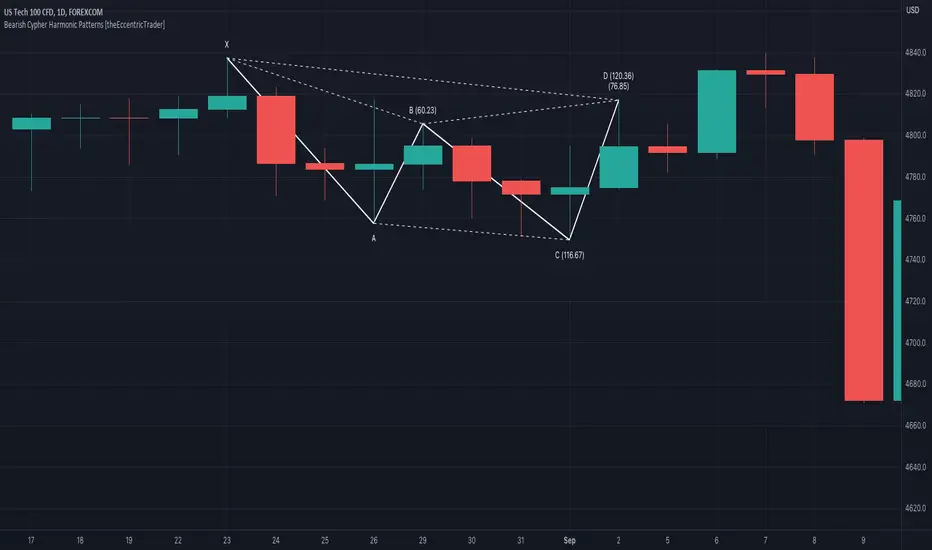
Bullish Cypher Harmonic Patterns [theEccentricTrader]█ OVERVIEW
This indicator automatically draws bullish cypher harmonic patterns and price projections derived from the ranges that constitute the patterns.
█ CONCEPTS
Green and Red Candles
• A green candle is one that closes with a close price equal to or above the price it opened.
• A red candle is one that closes with a close price that is lower than the price it opened.
Swing Highs and Swing Lows
• A swing high is a green candle or series of consecutive green candles followed by a single red candle to complete the swing and form the peak.
• A swing low is a red candle or series of consecutive red candles followed by a single green candle to complete the swing and form the trough.
Peak and Trough Prices (Basic)
• The peak price of a complete swing high is the high price of either the red candle that completes the swing high or the high price of the preceding green candle, depending on which is higher.
• The trough price of a complete swing low is the low price of either the green candle that completes the swing low or the low price of the preceding red candle, depending on which is lower.
Historic Peaks and Troughs
The current, or most recent, peak and trough occurrences are referred to as occurrence zero. Previous peak and trough occurrences are referred to as historic and ordered numerically from right to left, with the most recent historic peak and trough occurrences being occurrence one.
Range
The range is simply the difference between the current peak and current trough prices, generally expressed in terms of points or pips.
Support and Resistance
• Support refers to a price level where the demand for an asset is strong enough to prevent the price from falling further.
• Resistance refers to a price level where the supply of an asset is strong enough to prevent the price from rising further.
Support and resistance levels are important because they can help traders identify where the price of an asset might pause or reverse its direction, offering potential entry and exit points. For example, a trader might look to buy an asset when it approaches a support level , with the expectation that the price will bounce back up. Alternatively, a trader might look to sell an asset when it approaches a resistance level , with the expectation that the price will drop back down.
It's important to note that support and resistance levels are not always relevant, and the price of an asset can also break through these levels and continue moving in the same direction.
Upper Trends
• A return line uptrend is formed when the current peak price is higher than the preceding peak price.
• A downtrend is formed when the current peak price is lower than the preceding peak price.
• A double-top is formed when the current peak price is equal to the preceding peak price.
Lower Trends
• An uptrend is formed when the current trough price is higher than the preceding trough price.
• A return line downtrend is formed when the current trough price is lower than the preceding trough price.
• A double-bottom is formed when the current trough price is equal to the preceding trough price.
Wave Cycles
A wave cycle is here defined as a complete two-part move between a swing high and a swing low, or a swing low and a swing high. The first swing high or swing low will set the course for the sequence of wave cycles that follow; for example a chart that begins with a swing low will form its first complete wave cycle upon the formation of the first complete swing high and vice versa.
Figure 1.
Fibonacci Retracement and Extension Ratios
The Fibonacci sequence is a series of numbers in which each number is the sum of the two preceding numbers, starting with 0 and 1. For example 0 + 1 = 1, 1 + 1 = 2, 1 + 2 = 3, and so on. Ultimately, we could go on forever but the first few numbers in the sequence are as follows: 0 , 1, 1, 2, 3, 5, 8, 13, 21, 34, 55, 89, 144.
The extension ratios are calculated by dividing each number in the sequence by the number preceding it. For example 0/1 = 0, 1/1 = 1, 2/1 = 2, 3/2 = 1.5, 5/3 = 1.6666..., 8/5 = 1.6, 13/8 = 1.625, 21/13 = 1.6153..., 34/21 = 1.6190..., 55/34 = 1.6176..., 89/55 = 1.6181..., 144/89 = 1.6179..., and so on. The retracement ratios are calculated by inverting this process and dividing each number in the sequence by the number proceeding it. For example 0/1 = 0, 1/1 = 1, 1/2 = 0.5, 2/3 = 0.666..., 3/5 = 0.6, 5/8 = 0.625, 8/13 = 0.6153..., 13/21 = 0.6190..., 21/34 = 0.6176..., 34/55 = 0.6181..., 55/89 = 0.6179..., 89/144 = 0.6180..., and so on.
1.618 is considered to be the 'golden ratio', found in many natural phenomena such as the growth of seashells and the branching of trees. Some now speculate the universe oscillates at a frequency of 0,618 Hz, which could help to explain such phenomena, but this theory has yet to be proven.
Traders and analysts use Fibonacci retracement and extension indicators, consisting of horizontal lines representing different Fibonacci ratios, for identifying potential levels of support and resistance. Fibonacci ranges are typically drawn from left to right, with retracement levels representing ratios inside of the current range and extension levels representing ratios extended outside of the current range. If the current wave cycle ends on a swing low, the Fibonacci range is drawn from peak to trough. If the current wave cycle ends on a swing high the Fibonacci range is drawn from trough to peak.
Harmonic Patterns
The concept of harmonic patterns in trading was first introduced by H.M. Gartley in his book "Profits in the Stock Market", published in 1935. Gartley observed that markets have a tendency to move in repetitive patterns, and he identified several specific patterns that he believed could be used to predict future price movements.
Since then, many other traders and analysts have built upon Gartley's work and developed their own variations of harmonic patterns. One such contributor is Larry Pesavento, who developed his own methods for measuring harmonic patterns using Fibonacci ratios. Pesavento has written several books on the subject of harmonic patterns and Fibonacci ratios in trading. Another notable contributor to harmonic patterns is Scott Carney, who developed his own approach to harmonic trading in the late 1990s and also popularised the use of Fibonacci ratios to measure harmonic patterns. Carney expanded on Gartley's work and also introduced several new harmonic patterns, such as the Shark pattern and the 5-0 pattern.
The bullish and bearish Gartley patterns are the oldest recognized harmonic patterns in trading and all the other harmonic patterns are ultimately modifications of the original Gartley patterns. Gartley patterns are fundamentally composed of 5 points, or 4 waves.
Bullish and Bearish Cypher Patterns
• Bullish cypher patterns are fundamentally composed of three troughs and two peaks, with the second peak being higher than the first peak and the second trough being higher than the first trough. The third trough must be lower than the second trough but higher than the first.
• Bearish cypher patterns are fundamentally composed of three peaks and two troughs, with the second trough being lower than the first trough and the second peak being lower than the first peak. The third peak must be higher than the second peak but lower than the first.
The most commonly recognised ratio measures used by traders today are as follows:
• Wave 1 of the pattern, referred to as XA, has no specific ratio requirements.
• Wave 2 of the pattern, referred to as AB, should retrace to at least 38.2%, but no further than 61.8% of the range set by wave 1.
• Wave 3 of the pattern, referred to as BC, should extend to at least 113%, but no further than 141.4% of the range set by wave 2.
• Wave 4 of the pattern, referred to as CD, should extend to at least 127.2%, but no further than 200% of the range set by wave 3.
• The last measure, that of wave 4 as a ratio of the range set between points X and C, referred to as XC, should retrace to 78.6%.
Measurement Tolerances
In general, tolerance in measurements refers to the allowable variation or deviation from a specific value or dimension. It is the range within which a particular measurement is considered to be acceptable or accurate. In this script I have applied this concept to the measurement of harmonic pattern ratios to increase to the frequency of pattern occurrences.
For example, the AB measurement of Gartley patterns is generally set at around 61.8%, but with such specificity in the measuring requirements the patterns are very rare. We can increase the frequency of pattern occurrences by setting a tolerance. A tolerance of 10% to both downside and upside, which is the default setting for all tolerances, means we would have a tolerable measurement range between 51.8-71.8%, thus increasing the frequency of occurrence.
█ FEATURES
Inputs
• AB Lower Tolerance
• AB Upper Tolerance
• BC Lower Tolerance
• BC Upper Tolerance
• CD Lower Tolerance
• CD Upper Tolerance
• XC Lower Tolerance
• XC Upper Tolerance
• Pattern Color
• Label Color
• Show Projections
• Extend Current Projection Lines
Alerts
Users can set alerts for when the patterns occur.
█ LIMITATIONS
All green and red candle calculations are based on differences between open and close prices, as such I have made no attempt to account for green candles that gap lower and close below the close price of the preceding candle, or red candles that gap higher and close above the close price of the preceding candle. This may cause some unexpected behaviour on some markets and timeframes. I can only recommend using 24-hour markets, if and where possible, as there are far fewer gaps and, generally, more data to work with.
█ NOTES
The cypher pattern was initially discovered by Darren Oglesbee, but I was unable to find any direct sources to his work on harmonic patterns. And although there seems to be some contention over whether or not there should be a ratio requirement for the CD wave, I decided to include it nonetheless.
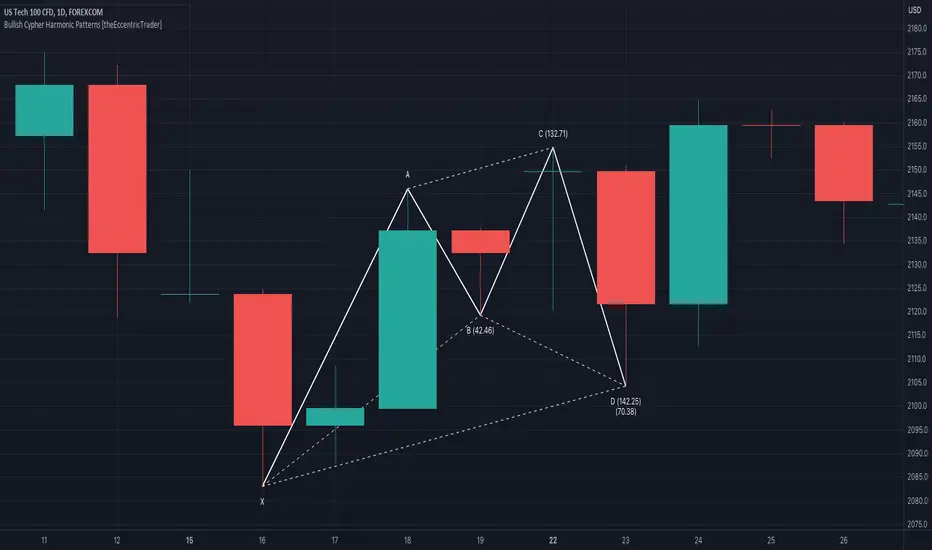
Bearish Deep Crab Harmonic Patterns [theEccentricTrader]█ OVERVIEW
This indicator automatically draws bearish deep crab harmonic patterns and price projections derived from the ranges that constitute the patterns.
█ CONCEPTS
Green and Red Candles
• A green candle is one that closes with a close price equal to or above the price it opened.
• A red candle is one that closes with a close price that is lower than the price it opened.
Swing Highs and Swing Lows
• A swing high is a green candle or series of consecutive green candles followed by a single red candle to complete the swing and form the peak.
• A swing low is a red candle or series of consecutive red candles followed by a single green candle to complete the swing and form the trough.
Peak and Trough Prices (Basic)
• The peak price of a complete swing high is the high price of either the red candle that completes the swing high or the high price of the preceding green candle, depending on which is higher.
• The trough price of a complete swing low is the low price of either the green candle that completes the swing low or the low price of the preceding red candle, depending on which is lower.
Historic Peaks and Troughs
The current, or most recent, peak and trough occurrences are referred to as occurrence zero. Previous peak and trough occurrences are referred to as historic and ordered numerically from right to left, with the most recent historic peak and trough occurrences being occurrence one.
Range
The range is simply the difference between the current peak and current trough prices, generally expressed in terms of points or pips.
Support and Resistance
• Support refers to a price level where the demand for an asset is strong enough to prevent the price from falling further.
• Resistance refers to a price level where the supply of an asset is strong enough to prevent the price from rising further.
Support and resistance levels are important because they can help traders identify where the price of an asset might pause or reverse its direction, offering potential entry and exit points. For example, a trader might look to buy an asset when it approaches a support level , with the expectation that the price will bounce back up. Alternatively, a trader might look to sell an asset when it approaches a resistance level , with the expectation that the price will drop back down.
It's important to note that support and resistance levels are not always relevant, and the price of an asset can also break through these levels and continue moving in the same direction.
Upper Trends
• A return line uptrend is formed when the current peak price is higher than the preceding peak price.
• A downtrend is formed when the current peak price is lower than the preceding peak price.
• A double-top is formed when the current peak price is equal to the preceding peak price.
Lower Trends
• An uptrend is formed when the current trough price is higher than the preceding trough price.
• A return line downtrend is formed when the current trough price is lower than the preceding trough price.
• A double-bottom is formed when the current trough price is equal to the preceding trough price.
Wave Cycles
A wave cycle is here defined as a complete two-part move between a swing high and a swing low, or a swing low and a swing high. The first swing high or swing low will set the course for the sequence of wave cycles that follow; for example a chart that begins with a swing low will form its first complete wave cycle upon the formation of the first complete swing high and vice versa.
Figure 1.
Fibonacci Retracement and Extension Ratios
The Fibonacci sequence is a series of numbers in which each number is the sum of the two preceding numbers, starting with 0 and 1. For example 0 + 1 = 1, 1 + 1 = 2, 1 + 2 = 3, and so on. Ultimately, we could go on forever but the first few numbers in the sequence are as follows: 0 , 1, 1, 2, 3, 5, 8, 13, 21, 34, 55, 89, 144.
The extension ratios are calculated by dividing each number in the sequence by the number preceding it. For example 0/1 = 0, 1/1 = 1, 2/1 = 2, 3/2 = 1.5, 5/3 = 1.6666..., 8/5 = 1.6, 13/8 = 1.625, 21/13 = 1.6153..., 34/21 = 1.6190..., 55/34 = 1.6176..., 89/55 = 1.6181..., 144/89 = 1.6179..., and so on. The retracement ratios are calculated by inverting this process and dividing each number in the sequence by the number proceeding it. For example 0/1 = 0, 1/1 = 1, 1/2 = 0.5, 2/3 = 0.666..., 3/5 = 0.6, 5/8 = 0.625, 8/13 = 0.6153..., 13/21 = 0.6190..., 21/34 = 0.6176..., 34/55 = 0.6181..., 55/89 = 0.6179..., 89/144 = 0.6180..., and so on.
1.618 is considered to be the 'golden ratio', found in many natural phenomena such as the growth of seashells and the branching of trees. Some now speculate the universe oscillates at a frequency of 0,618 Hz, which could help to explain such phenomena, but this theory has yet to be proven.
Traders and analysts use Fibonacci retracement and extension indicators, consisting of horizontal lines representing different Fibonacci ratios, for identifying potential levels of support and resistance. Fibonacci ranges are typically drawn from left to right, with retracement levels representing ratios inside of the current range and extension levels representing ratios extended outside of the current range. If the current wave cycle ends on a swing low, the Fibonacci range is drawn from peak to trough. If the current wave cycle ends on a swing high the Fibonacci range is drawn from trough to peak.
Harmonic Patterns
The concept of harmonic patterns in trading was first introduced by H.M. Gartley in his book "Profits in the Stock Market", published in 1935. Gartley observed that markets have a tendency to move in repetitive patterns, and he identified several specific patterns that he believed could be used to predict future price movements.
Since then, many other traders and analysts have built upon Gartley's work and developed their own variations of harmonic patterns. One such contributor is Larry Pesavento, who developed his own methods for measuring harmonic patterns using Fibonacci ratios. Pesavento has written several books on the subject of harmonic patterns and Fibonacci ratios in trading. Another notable contributor to harmonic patterns is Scott Carney, who developed his own approach to harmonic trading in the late 1990s and also popularised the use of Fibonacci ratios to measure harmonic patterns. Carney expanded on Gartley's work and also introduced several new harmonic patterns, such as the Shark pattern and the 5-0 pattern.
The bullish and bearish Gartley patterns are the oldest recognized harmonic patterns in trading and all the other harmonic patterns are ultimately modifications of the original Gartley patterns. Gartley patterns are fundamentally composed of 5 points, or 4 waves.
Bullish and Bearish Deep Crab Patterns
• Bullish deep crab patterns are fundamentally composed of three troughs and two peaks. The second peak being lower than the first peak. And the third trough being lower than both the first and second troughs, while the second trough is higher than the first.
• Bearish deep crab patterns are fundamentally composed of three peaks and two troughs. The second trough being higher than the first trough. And the third peak being higher than both the first and second peaks, while the second peak is lower than the first.
The ratio measurements recommended by Scott Carney, who originated the pattern, are as follows:
• Wave 1 of the pattern, generally referred to as XA, has no specific ratio requirements.
• Wave 2 of the pattern, generally referred to as AB, should retrace to 88.6% of the range set by wave 1.
• Wave 3 of the pattern, generally referred to as BC, should retrace by at least 38.2%, but no further than 88.6% of the range set by wave 2.
• Wave 4 of the pattern, generally referred to as CD, should extend to at least 200%, but no further than 361.8% of the range set by wave 3.
• The last measure, generally referred to as AD, is that of wave 4 as a ratio of the range set by wave 1, which should extend to 161.8%.
Measurement Tolerances
In general, tolerance in measurements refers to the allowable variation or deviation from a specific value or dimension. It is the range within which a particular measurement is considered to be acceptable or accurate. In this script I have applied this concept to the measurement of harmonic pattern ratios to increase to the frequency of pattern occurrences.
For example, the AB measurement of Gartley patterns is generally set at around 61.8%, but with such specificity in the measuring requirements the patterns are very rare. We can increase the frequency of pattern occurrences by setting a tolerance. A tolerance of 10% to both downside and upside, which is the default setting for all tolerances, means we would have a tolerable measurement range between 51.8-71.8%, thus increasing the frequency of occurrence.
█ FEATURES
Inputs
• AB Lower Tolerance
• AB Upper Tolerance
• BC Lower Tolerance
• BC Upper Tolerance
• CD Lower Tolerance
• CD Upper Tolerance
• AD Lower Tolerance
• AD Upper Tolerance
• Pattern Color
• Label Color
• Show Projections
• Extend Current Projection Lines
Alerts
Users can set alerts for when the patterns occur.
█ LIMITATIONS
All green and red candle calculations are based on differences between open and close prices, as such I have made no attempt to account for green candles that gap lower and close below the close price of the preceding candle, or red candles that gap higher and close above the close price of the preceding candle. This may cause some unexpected behaviour on some markets and timeframes. I can only recommend using 24-hour markets, if and where possible, as there are far fewer gaps and, generally, more data to work with.
█ NOTES
A link to Scott's harmonic patterns webpage for anyone who may be interested: harmonictrader.com/harmonic-patterns/

Bullish Deep Crab Harmonic Patterns [theEccentricTrader]█ OVERVIEW
This indicator automatically draws bullish deep crab harmonic patterns and price projections derived from the ranges that constitute the patterns.
█ CONCEPTS
Green and Red Candles
• A green candle is one that closes with a close price equal to or above the price it opened.
• A red candle is one that closes with a close price that is lower than the price it opened.
Swing Highs and Swing Lows
• A swing high is a green candle or series of consecutive green candles followed by a single red candle to complete the swing and form the peak.
• A swing low is a red candle or series of consecutive red candles followed by a single green candle to complete the swing and form the trough.
Peak and Trough Prices (Basic)
• The peak price of a complete swing high is the high price of either the red candle that completes the swing high or the high price of the preceding green candle, depending on which is higher.
• The trough price of a complete swing low is the low price of either the green candle that completes the swing low or the low price of the preceding red candle, depending on which is lower.
Historic Peaks and Troughs
The current, or most recent, peak and trough occurrences are referred to as occurrence zero. Previous peak and trough occurrences are referred to as historic and ordered numerically from right to left, with the most recent historic peak and trough occurrences being occurrence one.
Range
The range is simply the difference between the current peak and current trough prices, generally expressed in terms of points or pips.
Support and Resistance
• Support refers to a price level where the demand for an asset is strong enough to prevent the price from falling further.
• Resistance refers to a price level where the supply of an asset is strong enough to prevent the price from rising further.
Support and resistance levels are important because they can help traders identify where the price of an asset might pause or reverse its direction, offering potential entry and exit points. For example, a trader might look to buy an asset when it approaches a support level , with the expectation that the price will bounce back up. Alternatively, a trader might look to sell an asset when it approaches a resistance level , with the expectation that the price will drop back down.
It's important to note that support and resistance levels are not always relevant, and the price of an asset can also break through these levels and continue moving in the same direction.
Upper Trends
• A return line uptrend is formed when the current peak price is higher than the preceding peak price.
• A downtrend is formed when the current peak price is lower than the preceding peak price.
• A double-top is formed when the current peak price is equal to the preceding peak price.
Lower Trends
• An uptrend is formed when the current trough price is higher than the preceding trough price.
• A return line downtrend is formed when the current trough price is lower than the preceding trough price.
• A double-bottom is formed when the current trough price is equal to the preceding trough price.
Wave Cycles
A wave cycle is here defined as a complete two-part move between a swing high and a swing low, or a swing low and a swing high. The first swing high or swing low will set the course for the sequence of wave cycles that follow; for example a chart that begins with a swing low will form its first complete wave cycle upon the formation of the first complete swing high and vice versa.
Figure 1.
Fibonacci Retracement and Extension Ratios
The Fibonacci sequence is a series of numbers in which each number is the sum of the two preceding numbers, starting with 0 and 1. For example 0 + 1 = 1, 1 + 1 = 2, 1 + 2 = 3, and so on. Ultimately, we could go on forever but the first few numbers in the sequence are as follows: 0 , 1, 1, 2, 3, 5, 8, 13, 21, 34, 55, 89, 144.
The extension ratios are calculated by dividing each number in the sequence by the number preceding it. For example 0/1 = 0, 1/1 = 1, 2/1 = 2, 3/2 = 1.5, 5/3 = 1.6666..., 8/5 = 1.6, 13/8 = 1.625, 21/13 = 1.6153..., 34/21 = 1.6190..., 55/34 = 1.6176..., 89/55 = 1.6181..., 144/89 = 1.6179..., and so on. The retracement ratios are calculated by inverting this process and dividing each number in the sequence by the number proceeding it. For example 0/1 = 0, 1/1 = 1, 1/2 = 0.5, 2/3 = 0.666..., 3/5 = 0.6, 5/8 = 0.625, 8/13 = 0.6153..., 13/21 = 0.6190..., 21/34 = 0.6176..., 34/55 = 0.6181..., 55/89 = 0.6179..., 89/144 = 0.6180..., and so on.
1.618 is considered to be the 'golden ratio', found in many natural phenomena such as the growth of seashells and the branching of trees. Some now speculate the universe oscillates at a frequency of 0,618 Hz, which could help to explain such phenomena, but this theory has yet to be proven.
Traders and analysts use Fibonacci retracement and extension indicators, consisting of horizontal lines representing different Fibonacci ratios, for identifying potential levels of support and resistance. Fibonacci ranges are typically drawn from left to right, with retracement levels representing ratios inside of the current range and extension levels representing ratios extended outside of the current range. If the current wave cycle ends on a swing low, the Fibonacci range is drawn from peak to trough. If the current wave cycle ends on a swing high the Fibonacci range is drawn from trough to peak.
Harmonic Patterns
The concept of harmonic patterns in trading was first introduced by H.M. Gartley in his book "Profits in the Stock Market", published in 1935. Gartley observed that markets have a tendency to move in repetitive patterns, and he identified several specific patterns that he believed could be used to predict future price movements.
Since then, many other traders and analysts have built upon Gartley's work and developed their own variations of harmonic patterns. One such contributor is Larry Pesavento, who developed his own methods for measuring harmonic patterns using Fibonacci ratios. Pesavento has written several books on the subject of harmonic patterns and Fibonacci ratios in trading. Another notable contributor to harmonic patterns is Scott Carney, who developed his own approach to harmonic trading in the late 1990s and also popularised the use of Fibonacci ratios to measure harmonic patterns. Carney expanded on Gartley's work and also introduced several new harmonic patterns, such as the Shark pattern and the 5-0 pattern.
The bullish and bearish Gartley patterns are the oldest recognized harmonic patterns in trading and all the other harmonic patterns are ultimately modifications of the original Gartley patterns. Gartley patterns are fundamentally composed of 5 points, or 4 waves.
Bullish and Bearish Deep Crab Patterns
• Bullish deep crab patterns are fundamentally composed of three troughs and two peaks. The second peak being lower than the first peak. And the third trough being lower than both the first and second troughs, while the second trough is higher than the first.
• Bearish deep crab patterns are fundamentally composed of three peaks and two troughs. The second trough being higher than the first trough. And the third peak being higher than both the first and second peaks, while the second peak is lower than the first.
The ratio measurements recommended by Scott Carney, who originated the pattern, are as follows:
• Wave 1 of the pattern, generally referred to as XA, has no specific ratio requirements.
• Wave 2 of the pattern, generally referred to as AB, should retrace to 88.6% of the range set by wave 1.
• Wave 3 of the pattern, generally referred to as BC, should retrace by at least 38.2%, but no further than 88.6% of the range set by wave 2.
• Wave 4 of the pattern, generally referred to as CD, should extend to at least 200%, but no further than 361.8% of the range set by wave 3.
• The last measure, generally referred to as AD, is that of wave 4 as a ratio of the range set by wave 1, which should extend to 161.8%.
Measurement Tolerances
In general, tolerance in measurements refers to the allowable variation or deviation from a specific value or dimension. It is the range within which a particular measurement is considered to be acceptable or accurate. In this script I have applied this concept to the measurement of harmonic pattern ratios to increase to the frequency of pattern occurrences.
For example, the AB measurement of Gartley patterns is generally set at around 61.8%, but with such specificity in the measuring requirements the patterns are very rare. We can increase the frequency of pattern occurrences by setting a tolerance. A tolerance of 10% to both downside and upside, which is the default setting for all tolerances, means we would have a tolerable measurement range between 51.8-71.8%, thus increasing the frequency of occurrence.
█ FEATURES
Inputs
• AB Lower Tolerance
• AB Upper Tolerance
• BC Lower Tolerance
• BC Upper Tolerance
• CD Lower Tolerance
• CD Upper Tolerance
• AD Lower Tolerance
• AD Upper Tolerance
• Pattern Color
• Label Color
• Show Projections
• Extend Current Projection Lines
Alerts
Users can set alerts for when the patterns occur.
█ LIMITATIONS
All green and red candle calculations are based on differences between open and close prices, as such I have made no attempt to account for green candles that gap lower and close below the close price of the preceding candle, or red candles that gap higher and close above the close price of the preceding candle. This may cause some unexpected behaviour on some markets and timeframes. I can only recommend using 24-hour markets, if and where possible, as there are far fewer gaps and, generally, more data to work with.
█ NOTES
A link to Scott's harmonic patterns webpage for anyone who may be interested: harmonictrader.com/harmonic-patterns/