OPEN-SOURCE SCRIPT
Support Resistance Classification (VR) [LuxAlgo]
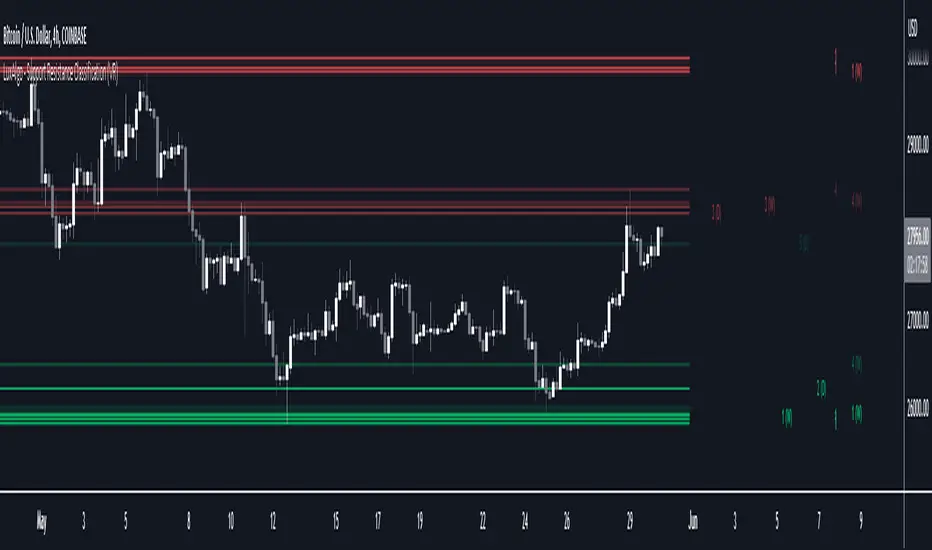
The Support Resistance Classification (VR) indicator shows SR levels on any chart's visible range using higher time-frame data (HTF). Levels are classified 1 through 10 based on their strength, with lower values indicating stronger support/resistance levels.
This indicator uses visible range functionality, whereas if you adjust your chart to show previous price data, the indicator may show new levels.
🔶 USAGE

Certain indicators on higher timeframes can provide longer term support/resistance levels on lower timeframes. Users can use the provided levels on a chart visible range and use them as reference for future support/resistance levels.

The classification algorithm measures the strength of a support/resistance level using the entire chart visible range and is in a range of 1 to 10, with higher values indicating a weaker support/resistance.

Supports/resistances highlighted by the indicator can be used for future applications by marking them on the chart (quickly done with alt + h).
🔶 DETAILS

All calculations are based on what you see on the Visible Chart, as such changing the chart will recalculate the indicator.

Since only Swings which are not broken are included, every break would exclude that swing. Therefore, even when 'value' is chosen at Settings ('Value'), breaks are always calculated on the entire line.
🔶 SETTINGS
Fade: After x breaks the line becomes invisible
Value:
🔹 Swing Settings
Swings are always calculated at current timeframe, setting a HTF is not applicable on Swings.
🔹 Set
🔹 Show Values
You can make up to 5 values visible (if you want to check/verify), except for Swings (see SWING SETTINGS)
To do so, enable (A -> E), and choose the N° you want to see.
This also is a useful tool if you're not sure which value you want to set.
This indicator uses visible range functionality, whereas if you adjust your chart to show previous price data, the indicator may show new levels.
🔶 USAGE
Certain indicators on higher timeframes can provide longer term support/resistance levels on lower timeframes. Users can use the provided levels on a chart visible range and use them as reference for future support/resistance levels.
The classification algorithm measures the strength of a support/resistance level using the entire chart visible range and is in a range of 1 to 10, with higher values indicating a weaker support/resistance.
Supports/resistances highlighted by the indicator can be used for future applications by marking them on the chart (quickly done with alt + h).
🔶 DETAILS
All calculations are based on what you see on the Visible Chart, as such changing the chart will recalculate the indicator.
Since only Swings which are not broken are included, every break would exclude that swing. Therefore, even when 'value' is chosen at Settings ('Value'), breaks are always calculated on the entire line.
🔶 SETTINGS
Fade: After x breaks the line becomes invisible
Value:
- value:
• SMA, upper/lower: the breaks are triggered on the moving average itself
• Fibonacci Pivot Point levels, Previous High, Previous Low: only last HTF values can be used for breaks
• Swings (see SWING SETTINGS) - line:
• SMA, upper/lower: the breaks are triggered on the entire line, based on its latest value
• Fibonacci Pivot Point Levels, Previous High, Previous Low: breaks are triggered on the entire line, based on its latest value
• Swings (see SWING SETTINGS)
🔹 Swing Settings
Swings are always calculated at current timeframe, setting a HTF is not applicable on Swings.
🔹 Set
- N°: The concerning number
- TYPE:
• SMA (Simple Moving Average)
• Previous High/Low
• Upper/Lower (Bollinger Bands)
• Pivot Point levels: "Fibonacci" - LENGTH: sets the 'Number of bars', needed for calculations (applicable for SMA, upper/lower)
- MULT: sets the 'Standard deviation factor' (only applicable for upper/lower - BB)
- HTF: sets 'Higher Time Frame' (applicable for SMA, upper/lower, Previous High/Low, Fibonacci)
🔹 Show Values
You can make up to 5 values visible (if you want to check/verify), except for Swings (see SWING SETTINGS)
To do so, enable (A -> E), and choose the N° you want to see.
This also is a useful tool if you're not sure which value you want to set.
نص برمجي مفتوح المصدر
بروح TradingView الحقيقية، قام مبتكر هذا النص البرمجي بجعله مفتوح المصدر، بحيث يمكن للمتداولين مراجعة وظائفه والتحقق منها. شكرا للمؤلف! بينما يمكنك استخدامه مجانًا، تذكر أن إعادة نشر الكود يخضع لقواعد الموقع الخاصة بنا.
Get exclusive indicators & AI trading strategies: luxalgo.com
Free 150k+ community: discord.gg/lux
All content provided by LuxAlgo is for informational & educational purposes only. Past performance does not guarantee future results.
Free 150k+ community: discord.gg/lux
All content provided by LuxAlgo is for informational & educational purposes only. Past performance does not guarantee future results.
إخلاء المسؤولية
لا يُقصد بالمعلومات والمنشورات أن تكون، أو تشكل، أي نصيحة مالية أو استثمارية أو تجارية أو أنواع أخرى من النصائح أو التوصيات المقدمة أو المعتمدة من TradingView. اقرأ المزيد في شروط الاستخدام.