OPEN-SOURCE SCRIPT
تم تحديثه Fibonacci Adaptive Timeframe EMA (FAT EMA)
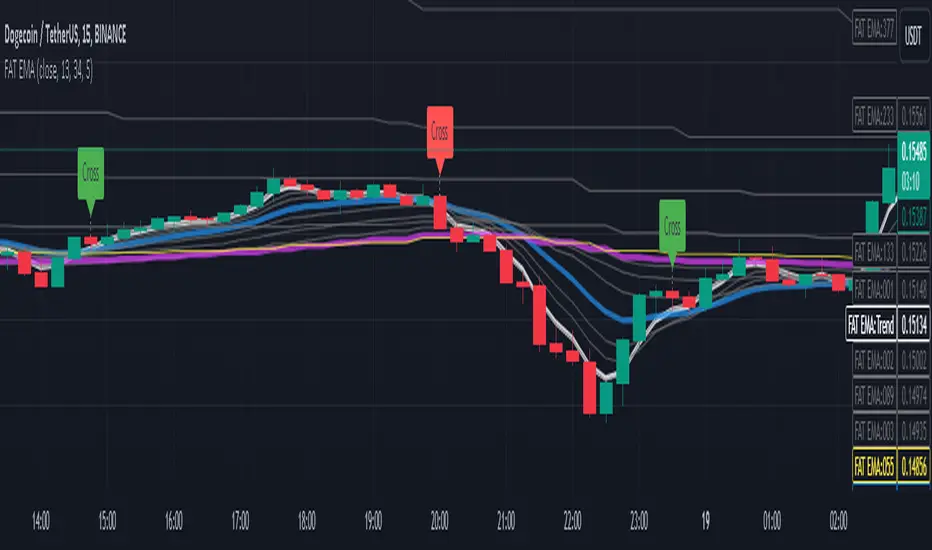
The "Fibonacci Adaptive Timeframe EMA" is a sophisticated trading indicator designed for the TradingView platform, leveraging the power of Exponential Moving Averages (EMAs) determined by Fibonacci sequence lengths to provide traders with dynamic market insights. This indicator overlays directly on the price chart, offering a unique blend of trend analysis, smoothing techniques, and timeframe adaptability, making it an invaluable tool for traders looking to enhance their technical analysis strategy.
Key Features
1. Fibonacci-Based EMA Lengths: Utilizes the Fibonacci sequence to select EMA lengths, incorporating natural mathematical ratios believed to be significant in financial markets. The available lengths range from 1 to 987, allowing for detailed trend analysis over various periods.
2. Multiple Smoothing Methods: Offers the choice between several smoothing techniques, including Simple Moving Average (SMA), Exponential Moving Average (EMA), Smoothed Moving Average (SMMA or RMA), Weighted Moving Average (WMA), and Volume Weighted Moving Average (VWMA). This versatility ensures that users can tailor the indicator to suit their analytical preferences.
3. Timeframe Adaptability: Features the ability to fetch and calculate EMAs from different timeframes, providing a multi-timeframe analysis within a single chart view. This adaptability gives traders a broader perspective on market trends, enabling more informed decision-making.
4. Dynamic Visualization Options: Traders can customize the display to suit their analysis needs, including toggling the visibility of Fibonacci EMA lines, EMA prices, and smoothed EMA lines. Additionally, forecast lines can be projected into the future, offering speculative insights based on current trends.
5. Ema Tail Visualization: An innovative feature allowing for the visualization of the 'tail' or the continuation of EMA lines, which can be particularly useful for identifying trend persistence or reversal points.
6. User-friendly Customization: Through a series of input options, traders can easily adjust the source data, Fibonacci lengths, smoothing method, and visual aspects such as line colors and transparency, ensuring a seamless integration into any trading strategy.
Application and Use Cases
The "Fibonacci Adaptive Timeframe EMA" indicator is designed for traders who appreciate the significance of Fibonacci numbers in market analysis and seek a flexible tool to analyze trends across different timeframes. Whether it's for scalping, day trading, or long-term investing, this indicator can provide valuable insights into price dynamics, trend strengths, and potential reversal points. Its adaptability makes it suitable for various asset classes, including stocks, forex, commodities, and cryptocurrencies.
ملاحظات الأخبار
small label updatesملاحظات الأخبار
minor label updatesملاحظات الأخبار
Ability to Cycle through EMA to find Cross that is valid.ملاحظات الأخبار
minorملاحظات الأخبار
Added ability to only show last label. Set to true by default.ملاحظات الأخبار
- Minor Title Change
- Label Distance Update
ملاحظات الأخبار
- New Support Resistance Colors.
- New Logic For Dashboard (Not Finished) Can see data in Pine logs
نص برمجي مفتوح المصدر
بروح TradingView الحقيقية، قام مبتكر هذا النص البرمجي بجعله مفتوح المصدر، بحيث يمكن للمتداولين مراجعة وظائفه والتحقق منها. شكرا للمؤلف! بينما يمكنك استخدامه مجانًا، تذكر أن إعادة نشر الكود يخضع لقواعد الموقع الخاصة بنا.
إخلاء المسؤولية
لا يُقصد بالمعلومات والمنشورات أن تكون، أو تشكل، أي نصيحة مالية أو استثمارية أو تجارية أو أنواع أخرى من النصائح أو التوصيات المقدمة أو المعتمدة من TradingView. اقرأ المزيد في شروط الاستخدام.