OPEN-SOURCE SCRIPT
تم تحديثه Portfolio Summary
The stocks in my portfolio has very poor performance since the FED hiked the rate.
since the covid-19, i came to the stock market and buy a stock that i ever heard the name which i don't even know its fundamental.
Some stock, i bought them at the hilltop (and sell at the bottom, hehe).
Everyone is a genius in a bull market ; and now i realized i am gonna loss money.
I have to do something, so i looked for an indicator that allow me to manage my portfolio.
unfortunately, i cannot find one that fit me.
so i make this indicator.
How you can get the benefit from this indicator
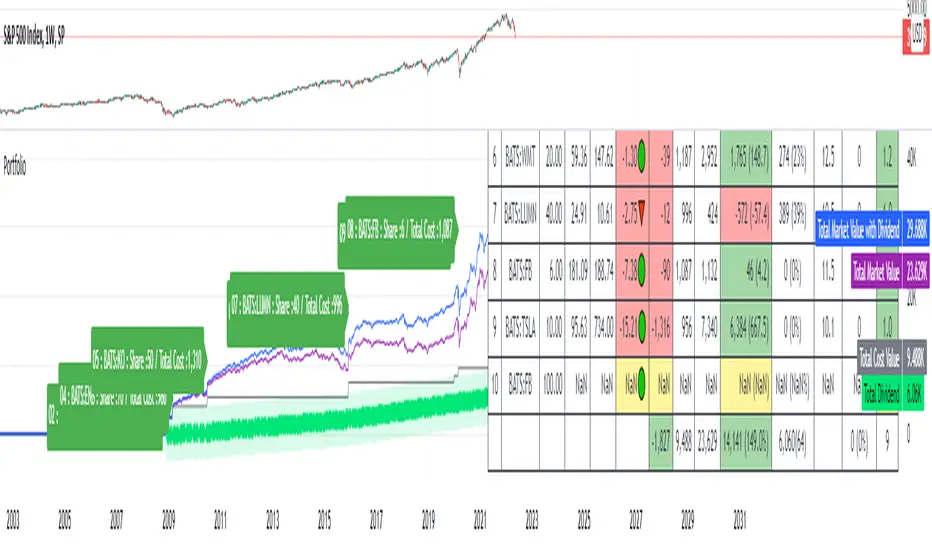
This indicator will summarize the gain/loss since you bought the stock.
it also include the dividend.
So that you can see how much you gain and loss, and make a decision as you wish.
How to use it
1. Input some neccessary data like ticker/stock (up to 20 tickers, yeah i know, it is too much), share, average price which you can input manually or depend on your entry date.
2. The indicator will calculate gain/loss, dividend, % of your portfolio.
3. You can select how to display based on "Index" or "Market Value".
4. You can toggle on/off both label and table.
Disclaimer
This indicator may display inaccurate and need a lot of improvement.
pls use carefully.
if you have any suggestion, pls dont hersitate to comment below.
Enjoy.


since the covid-19, i came to the stock market and buy a stock that i ever heard the name which i don't even know its fundamental.
Some stock, i bought them at the hilltop (and sell at the bottom, hehe).
Everyone is a genius in a bull market ; and now i realized i am gonna loss money.
I have to do something, so i looked for an indicator that allow me to manage my portfolio.
unfortunately, i cannot find one that fit me.
so i make this indicator.
How you can get the benefit from this indicator
This indicator will summarize the gain/loss since you bought the stock.
it also include the dividend.
So that you can see how much you gain and loss, and make a decision as you wish.
How to use it
1. Input some neccessary data like ticker/stock (up to 20 tickers, yeah i know, it is too much), share, average price which you can input manually or depend on your entry date.
2. The indicator will calculate gain/loss, dividend, % of your portfolio.
3. You can select how to display based on "Index" or "Market Value".
4. You can toggle on/off both label and table.
Disclaimer
This indicator may display inaccurate and need a lot of improvement.
pls use carefully.
if you have any suggestion, pls dont hersitate to comment below.
Enjoy.
ملاحظات الأخبار
Symbol error fixed.ملاحظات الأخبار
- Rearranged the script.
- Added stop loss, take profit based on price, percent and ATR.
- Added alert if market price hit entry price, stop loss price and target price.
- Reduced number of asset from 20 to 10 assets for better performance.
Enjoy.
PS.
1) Use at your own risk.
2) Next improvement : Portfolio benmarking, CAPM.
نص برمجي مفتوح المصدر
بروح TradingView الحقيقية، قام مبتكر هذا النص البرمجي بجعله مفتوح المصدر، بحيث يمكن للمتداولين مراجعة وظائفه والتحقق منها. شكرا للمؤلف! بينما يمكنك استخدامه مجانًا، تذكر أن إعادة نشر الكود يخضع لقواعد الموقع الخاصة بنا.
إخلاء المسؤولية
لا يُقصد بالمعلومات والمنشورات أن تكون، أو تشكل، أي نصيحة مالية أو استثمارية أو تجارية أو أنواع أخرى من النصائح أو التوصيات المقدمة أو المعتمدة من TradingView. اقرأ المزيد في شروط الاستخدام.