OPEN-SOURCE SCRIPT
US Treasuries Yield Curve
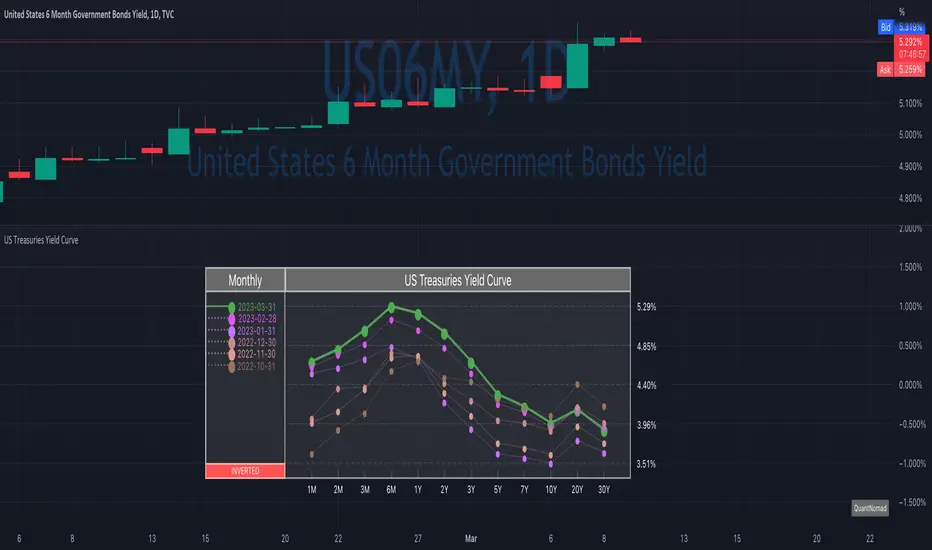
News about the yield curve became pretty crucial for all the trades in the last year.
So in the team, we decided to implement a nice widget that will allow you to track the current yield curve in your chart directly.
It's possible to compare the current yield curve with past yield curves. You can choose to display the number of curves weeks, months, and years ago. So you can see the dynamics of the yield curve change.
When the Y2 > Y10 curve is considered invested, so you'll see an "Inverted" notification on the chart.
Thanks to MUQWISHI for helping code it.
Disclaimer
Please remember that past performance may not indicate future results.
Due to various factors, including changing market conditions, the strategy may no longer perform as well as in historical backtesting.
This post and the script don’t provide any financial advice.
نص برمجي مفتوح المصدر
بروح TradingView الحقيقية، قام مبتكر هذا النص البرمجي بجعله مفتوح المصدر، بحيث يمكن للمتداولين مراجعة وظائفه والتحقق منها. شكرا للمؤلف! بينما يمكنك استخدامه مجانًا، تذكر أن إعادة نشر الكود يخضع لقواعد الموقع الخاصة بنا.
Quant Developer | Pine Script v6 | Python & R
12+ yrs system. trading, hedge fund experience
Custom indicators, strategies & screeners
Futures & options
💼 Hire/Consulting:
qntly.com/hire
🎓 PineScript V6 Course:
qntly.com/ps6
12+ yrs system. trading, hedge fund experience
Custom indicators, strategies & screeners
Futures & options
💼 Hire/Consulting:
qntly.com/hire
🎓 PineScript V6 Course:
qntly.com/ps6
إخلاء المسؤولية
لا يُقصد بالمعلومات والمنشورات أن تكون، أو تشكل، أي نصيحة مالية أو استثمارية أو تجارية أو أنواع أخرى من النصائح أو التوصيات المقدمة أو المعتمدة من TradingView. اقرأ المزيد في شروط الاستخدام.