Ultimate Triple Supertrend Strategy [PrismBot] [Lite]Initial Release on Prism Core 1.7.r493
Included in this Ultimate Supertrend Lite Strategy:
✔️ Tweak a multitude of specific settings (MA lengths, R:R, SL distance etc)
✔️ Enable advanced setup filters
✔️ Use money management and risk calculations
✔️ Draw trade info directly to chart (eg. SL size in percent, win rate etc)
✔️ Use various filters (eg. time filter, date filter, MA slope angle etc)
✔️ Manage risk per position when auto-trading forex through AutoView
✔️ Choose from various alert conditions!
✔️ Sync to any bot or algorithmic trading system
Some details about this strategy:
This strategy is a triple Supertrend strategy that includes multi-timeframe analysis built-in to the supertrend function. You also have a multitude of strategies to choose from, such as the newest addition to Prism Core - Stochastic. Our stochastic strategies includes Standard / Strict Standard which buys when overbought and sells when oversold, and a couple of %K cross strategies as well.
There are also many other filters such as RSI, ADX, and more, as well as built-in DCA (dollar cost averaging), position sizing, take profit and stoplosses, and so much more.
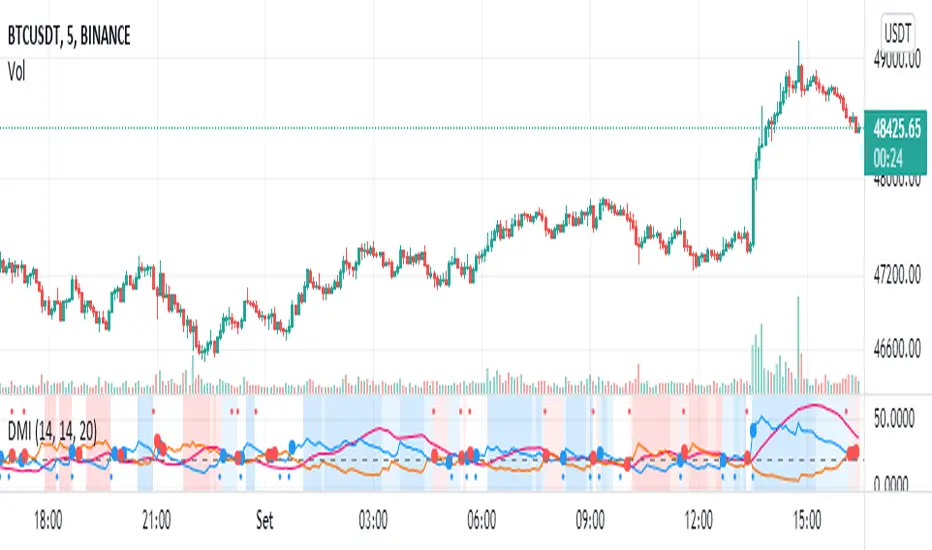
ADX

DMI - VisualBasically, when the background is:
White = no defined direction
Light blue = up.
Dark blue = well defined up
Light red = down
Dark red = well defined down
Blue/red centered circle = change of direction
Red circle on top = possible short entry
Blue circle at the bottom = possible long entry
//Português
Basicamente, quando o fundo é:
Branco = sem direção definida
Azul claro = alta
Azul escuro = alta bem definida
Vermelho claro = baixa
Vermelho escuro = baixa bem definida
Círculo azul/vermelho centrado = mudança da direção
Círculo vermelho no topo = possível entrada de short
Círculo azul na parte inferior = possível entrada de long
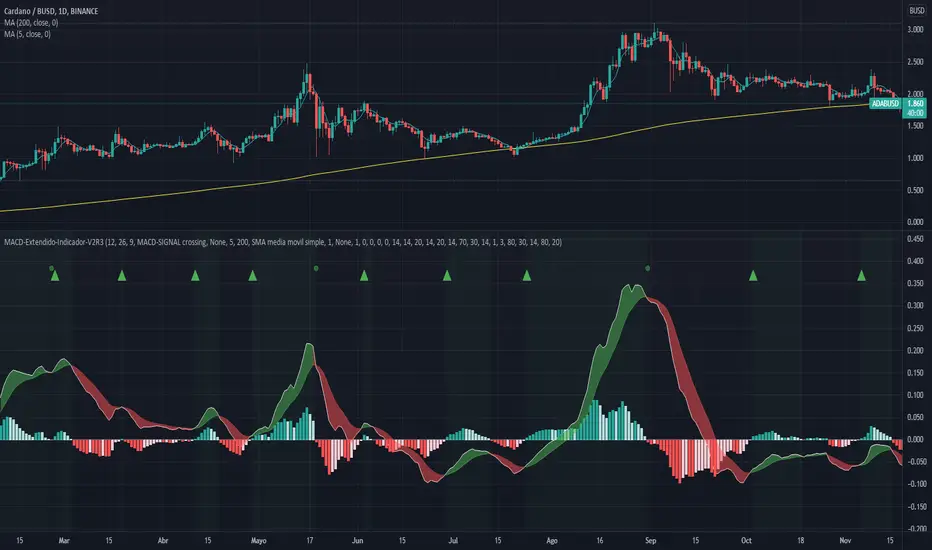
MACD-Extendido-Indicador por NeilMACD-Extendida-Estrategia
--------------------------------
DESCRIPTION
Resource that identifies entry and exit operations using the indicator
Average Convergence and Divergence Movements (MACD) and 5 strategies
INTERESTING
Novel strategies are implemented such as:
1. Overbought and oversold band to avoid horizontal movements
2. Control inputs and outputs at positions opposite the histogram line
3. Make a profit (take profit) without prior purchase orders
HOW DOES IT WORK (STRATEGIES)
1) Overbought and oversold:
Allows you to define an overbought upper band
Allows you to define an oversold ower band
Operations that occur within the band are ignored
2) Place of next operation (either side):
Indicates that the next operation can occur on either side of the histogram
3) Place of next operation (opposite side):
Indicates that the next operation must occur on the opposite side of the histogram
4) Take profit:
It allows defining the deviation in favor to execute a take profit.
It does not place a buy order at a distant point, instead it looks back and if the shift meets the expected deviation, take profit is executed
5) Loss control (stop loss):
It allows to define the deviation against to execute a stop loss.
It does not place a stop order at a distant point, instead it looks back and if the displacement meets the expected deviation the stop loss is executed
How to use it:
Press the "Indicators" option, go to the "Public Librarian" segment, write the name "MACD-Extendido-Indicador Neil", double-click on the record in question and you will have it added in your work panel, now, just It remains to be used to identify the inputs and outputs and you can do it visually or by defining the automatic notification alerts.
DESCRIPCION
Recurso que identifica operaciones de entradas y salida haciendo uso del indicador
Media Móvil de Convergencia/Divergencia (MACD) y 5 estrategias
NOVEDADES
Se implementan estrategias novedosas como:
1. Banda de sobrecompra y sobreventa para esquivar movimientos horizontales
2. Control de entradas y salidas en posiciones contrarias a la línea del histograma
3. Toma de ganancias (take profit) sin ordenes de compra previa
COMO FUNCIONA (ESTRATEGIAS)
1) Sobrecompra y Sobreventa:
Permite definir una banda superior de sobrecompra
Permite definir una banda inferior de sobreventa
Operaciones que ocurren dentro de la banda son ignoradas
2) Lugar de próxima operación (cualquier lado):
Indica que la próxima operación puede ocurrir en cualquier lado del histograma
3) Lugar de próxima operación (lado opuesto):
Indica que la próxima operación debe ocurrir en el lado opuesto del histograma
4) Toma de ganancias (take profit):
Permite definir la desviación a favor para ejecutar una toma de ganancia.
No coloca una orden de compra en un punto distante, en su lugar mira hacia atrás y si el desplazamiento cumple con la desviación esperada se ejecuta la toma de ganancia
5) Control de pérdida (stop loss):
Permite definir la desviación en contra para ejecutar una parada de pérdida.
No coloca una orden de parada en un punto distante, en su lugar mira hacia atrás y si el desplazamiento cumple con la desviación esperada se ejecuta la parada de la pérdida
Como usarlo:
Presione la opción "Indicadores", ubíquese en el segmento "Libreria Publica", escriba el nombre "MACD-Extendido-Indicador por Neil", haga doble clic sobre el registro en cuestión y lo tendrá agregado en su panel de trabajo, ahora, solo resta usarlo para identificar las entradas y salidas y puede hacerlo de forma visual o definiendo las alertas de notificación automática.
MACD-Extendido-Estrategia por Neil--------------------------------
MACD-Extendida-Estrategia
--------------------------------
DESCRIPTION
Resource that identifies entry and exit operations using the indicator
Average Convergence and Divergence Movements ( MACD ) and 5 strategies
INTERESTING
Novel strategies are implemented such as:
1. Overbought and oversold band to avoid horizontal movements
2. Control inputs and outputs at positions opposite the histogram line
3. Make a profit (take profit) without prior purchase orders
HOW DOES IT WORK (STRATEGIES)
1) Overbought and oversold:
Allows you to define an overbought upper band
Allows you to define an oversold ower band
Operations that occur within the band are ignored
2) Place of next operation (either side):
Indicates that the next operation can occur on either side of the histogram
3) Place of next operation (opposite side):
Indicates that the next operation must occur on the opposite side of the histogram
4) Take profit:
It allows defining the deviation in favor to execute a take profit.
It does not place a buy order at a distant point, instead it looks back and if the shift meets the expected deviation, take profit is executed
5) Loss control (stop loss):
It allows to define the deviation against to execute a stop loss.
It does not place a stop order at a distant point, instead it looks back and if the displacement meets the expected deviation the stop loss is executed
How to use it:
Press the "Indicators" option, go to the "Public Librarian" segment, write the name "MACD-Extended-Strategy by Neil", double-click on the record in question and you will have it added in your work panel, now, just It remains to be used to identify the inputs and outputs and you can do it visually or by defining the automatic notification alerts.
--------------------------------
MACD-Extendida-Estrategia
--------------------------------
DESCRIPCION
Recurso que identifica operaciones de entradas y salida haciendo uso del indicador
Media móvil de Convergencia/Divergencia ( MACD ) y 5 estrategias
NOVEDADES
Se implementan estrategias novedosas como:
1. Banda de sobrecompra y sobreventa para esquivar movimientos horizontales
2. Control de entradas y salidas en posiciones contrarias a la línea del histograma
3. Toma de ganancias (take profit) sin ordenes de compra previa
COMO FUNCIONA (ESTRATEGIAS)
1) Sobrecompra y Sobreventa:
Permite definir una banda superior de sobrecompra
Permite definir una banda inferior de sobreventa
Operaciones que ocurren dentro de la banda son ignoradas
2) Lugar de próxima operación (cualquier lado):
Indica que la próxima operación puede ocurrir en cualquier lado del histograma
3) Lugar de próxima operación (lado opuesto):
Indica que la próxima operación debe ocurrir en el lado opuesto del histograma
4) Toma de ganancias (take profit):
Permite definir la desviación a favor para ejecutar una toma de ganancia.
No coloca una orden de compra en un punto distante, en su lugar mira hacia atrás y si el desplazamiento cumple con la desviación esperada se ejecuta la toma de ganancia
5) Control de pérdida (stop loss):
Permite definir la desviación en contra para ejecutar una parada de pérdida.
No coloca una orden de parada en un punto distante, en su lugar mira hacia atrás y si el desplazamiento cumple con la desviación esperada se ejecuta la parada de la pérdida
Como usarlo:
Presione la opción "Indicadores", ubíquese en el segmento "Libreria Publica", escriba el nombre "MACD-Extendido-Estrategia por Neil", haga doble clic sobre el registro en cuestión y lo tendrá agregado en su panel de trabajo, ahora, solo resta usarlo para identificar las entradas y salidas y puede hacerlo de forma visual o definiendo las alertas de notificación automática.

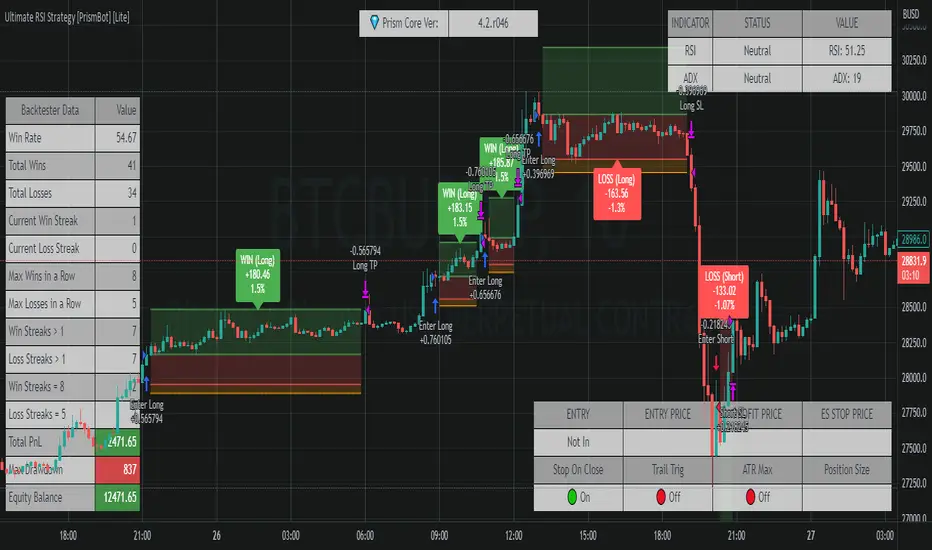
Ultimate RSI Strategy [PrismBot] [Lite]Included in this Ultimate MACD Lite Strategy:
✔️ Tweak a multitude of specific settings (MA lengths, R:R, SL distance etc)
✔️ Enable advanced setup filters
✔️ Use money management and risk calculations
✔️ Draw trade info directly to chart (eg. SL size in percent, win rate etc)
✔️ Use various filters (eg. time filter, date filter, MA slope angle etc)
✔️ Manage risk per position when auto-trading forex through AutoView
✔️ Choose from various alert conditions!
✔️ Sync to any bot or algorithmic trading system
Some details about this strategy:
There are several strategies that people use for the RSI , and one of my favorites is very different than one you have probably heard from every online RSI strategy source.
In order to compliment the RSI , there is also a built-in ADX / DMI strategy (per our All-In-One strategy on my profile as well) and you will also find a Global Trend filter (200 EMA by default).
You can also use a pullback confirmation prior to a trade entering. I.E., you have the RSI signal, wait for a pullback to the pullback EMA , and then the strategy will enter a trade.
You can easily enable and disable strategies using the checkbox.
This strategy incorporates a risk to reward system where the user can select between ATR and Percent based stop losses and take profit targets. This means that the user has much better control over money management when utilizing this strategy and it doesn't require you to babysit the strategy to ensure it's entering and existing strategies in an ideal place.
Ultimate MACD Strategy [PrismBot] [Lite]Included in this Ultimate MACD Lite Strategy:
✔️ Tweak a multitude of specific settings (MA lengths, R:R, SL distance etc)
✔️ Enable advanced setup filters
✔️ Use money management and risk calculations
✔️ Draw trade info directly to chart (eg. SL size in percent, win rate etc)
✔️ Use various filters (eg. time filter, date filter, MA slope angle etc)
✔️ Manage risk per position when auto-trading forex through AutoView
✔️ Choose from various alert conditions!
✔️ Sync to any bot or algorithmic trading system
Some details about this strategy:
LONG SIGNAL
When the MACD is below the zero line of the histogram, close is above the 200EMA, and the MACD line crosses above the signal line, longs are taken
SHORT SIGNAL
When the MACD is above the zero line of the histogram, close is below the 200EMA, and the MACD line crosses below the signal line, shorts are taken
A couple of options are given for how to calculator stop losses.
The Take profit is calculated by the risk of the stop loss. So a 1.5 take profit target is 1.5 times the stop loss added to the entry price.
There is also an option to filter out trades by the histogram deviation. This prevents crossovers that are too close to the histogram from being taken.
Please note I used the code for the PPO instead of the traditional MACD to make calculating these percentage deviations more consistent across multiple asset types.
You can easily enable and disable strategies using the checkbox.
This strategy incorporates a risk to reward system where the user can select between ATR and Percent based stop losses and take profit targets. This means that the user has much better control over money management when utilizing this strategy and it doesn't require you to babysit the strategy to ensure it's entering and existing strategies in an ideal place.
You can also enter custom messages for alerts for use with bots (set alerts to "alert() function calls only")

Keltner Worm Strategy [PrismBot] [Lite]Included in this Keltner Worm Lite Strategy:
✔️ Tweak a multitude of specific settings (MA lengths, R:R, SL distance etc)
✔️ Enable advanced setup filters
✔️ Use money management and risk calculations
✔️ Draw trade info directly to chart (eg. SL size in percent, win rate etc)
✔️ Use various filters (eg. time filter, date filter, MA slope angle etc)
✔️ Manage risk per position when auto-trading forex through AutoView
✔️ Choose from various alert conditions!
✔️ Sync to any bot or algorithmic trading system
Some details about this strategy:
- it incorporates 2 strategies - Keltner Re-entry and Baseline MA Crossing
- it uses a take profit and stop loss level fixed
- there are up to 6 allowable "worms"
- the worm multipliers are exponential, so a value of 2 will mean that the 6th worm is multiplied by 6
- you can multiply the offset or the Keltner Channel default values
- You can enable alerts for order entry, take profit, and stop loss values
- You can easily enable and disable strategies using the checkbox.
- This strategy incorporates a risk to reward system where the user can select between ATR and Percent based stop losses and take profit targets. This means that the user has much better control over money management when utilizing this strategy and it doesn't require you to babysit the strategy to ensure it's entering and existing strategies in an ideal place.

ADX MULTICOLOR
ENGLISH:
ADX (AVERAGE DIRECTIONAL INDEX):
It is a non-directional oscillator type indicator, that is, it quantifies the strength of a trend regardless of its direction. In Spanish ADX means index of average direction. It is common to use it together with directional indicators of movement such as the (Squeeze Momentum Indicator), which show us the direction or predominant trend of the market.
HOW TO USE THE ADX INDICATOR
When the ADX is greater than 30, the market is in a strong trend, when it is between 23 and 30 it is not well defined and when it is less than 23 it indicates that the market is in range.
QUANTIFYING THE STRENGTH OF TREND:
ADX values help traders identify the strongest and most profitable trends to trade. Values are also important to distinguish between trending and non-trending conditions. Many traders will use ADX readings above 23 to suggest that the trend is strong enough for trend trading strategies. Conversely, when the ADX is below 23, many will avoid trending trading strategies.
ADX value Trend strength
0-23 Trend absent or weak
23-30 Strong trend
30-75 Very strong trend
75-100 Extremely strong trend
+ DI: (Green Color)
The + DI (Positive Directional Indicator) would be the indicator of positive direction and it would be showing us that the movements are trending upward.
-DI: (Red Color)
The –DI (Negative Directionl Indicator) would be the indicator of negative direction and it would be showing us that the movements have a downward trend.
IMPROVEMENTS IN THE DEVELOPMENT OF THE OSCILLATOR:
It is known that the ADX as a whole is composed of three lines, the first is the ADX itself, which measures the strength of the trend, when it has upward directionality, it means that there is strength in the movement.
The other two lines named (+ DI and -DI) mark if the force is bearish, bullish or, failing that, neutral.
When the + DI is above the -DI, it speaks of Bullish force. On the contrary, when these lines are reversed, we would be in the presence of a bearish force.
On the other hand, when the ADX is below the 23 point, it is considered that there is no force in the movement.
FUSION OF ADX AND LOS (+ DI and -DI):
To simplify this vision, we have merged the three lines that we talked about at the beginning of this section, attributing the color resulting from the crosses of the (+ DI and -DI) to the ADX itself, resulting in a single line that has the color of the type of present force.
CANDLE COLOR:
To help the more inexperienced trader, we have activated a function that will paint the candles the color of the ADX, providing a visual aid to the trader using this indicator.
THE ADX HAS 5 COLORS:
• ADX: Dark Green (Bullish force).
• ADX: Light Green (Loss of bullish strength).
• ADX: Dark Red (Bearish Force).
• ADX: Light Red (Loss of bearish strength).
• ADX: Orange (Lost strength, Disinterest and low volume).
NOTE:
It is possible to activate the lines (+ DI and -DI) in the indicator if you want to use the indicator independently, however, it is recommended to combine this indicator with a directional oscillator, such as the Squeeze Momentum Indicator.
---------------------------------------------------------------------------------------------------------------------------------------------------------------------------------------------------------------------------------------------------
ESPAÑOL:
ADX (ÍNDICE DIRECCIONAL PROMEDIO):
Es un indicador de tipo oscilador no direccional, es decir, cuantifica la fuerza de una tendencia independientemente de su dirección. En español ADX significa índice de dirección media. Es común usarlo junto con indicadores direccionales de movimiento como el (Squeeze Momentum Indicator), que nos muestran la dirección o tendencia predominante del mercado.
CÓMO USAR EL INDICADOR ADX
Cuando el ADX es mayor a 30, el mercado está en fuerte tendencia, cuando está entre 23 y 30 no está bien definido y cuando es menor a 23 indica que el mercado está en rango.
CUANTIFICACIÓN DE LA FUERZA DE LA TENDENCIA:
Los valores de ADX ayudan a los operadores a identificar las tendencias más fuertes y rentables para operar. Los valores también son importantes para distinguir entre condiciones con tendencia y sin tendencia. Muchos operadores utilizarán lecturas de ADX por encima de 23 para sugerir que la tendencia es lo suficientemente fuerte para las estrategias de negociación de tendencias. Por el contrario, cuando el ADX está por debajo de 23, muchos evitarán las estrategias comerciales de tendencia.
Valor ADX Fuerza de la tendencia
0-23 Tendencia ausente o débil
23-30 Fuerte tendencia
30-75 Tendencia muy fuerte
75-100 Tendencia extremadamente fuerte
+ DI: (Color verde)
El + DI (indicador direccional positivo) sería el indicador de dirección positiva y nos estaría mostrando que los movimientos tienen una tendencia alcista.
-DI: (Color rojo)
El –DI (indicador de dirección negativa) sería el indicador de dirección negativa y nos estaría mostrando que los movimientos tienen una tendencia a la baja.
MEJORAS EN EL DESARROLLO DEL OSCILADOR:
Se sabe que el ADX en su conjunto está compuesto por tres líneas, la primera es el propio ADX, que mide la fuerza de la tendencia, cuando tiene direccionalidad ascendente, significa que hay fuerza en el movimiento.
Las otras dos líneas denominadas (+ DI y -DI) marcan si la fuerza es bajista, alcista o, en su defecto, neutral.
Cuando el + DI está por encima del -DI, habla de fuerza alcista. Por el contrario, cuando estas líneas se invierten, estaríamos en presencia de una fuerza bajista.
Por otro lado, cuando el ADX está por debajo del punto 23, se considera que no hay fuerza en el movimiento.
FUSIÓN DE ADX Y LOS (+ DI y -DI):
Para simplificar esta visión, hemos fusionado las tres líneas de las que hablamos al principio de esta sección, atribuyendo el color resultante de los cruces de (+ DI y -DI) al propio ADX, dando como resultado una sola línea que tiene el color del tipo de fuerza presente.
COLOR DE VELAS:
Para ayudar al trader más inexperto, hemos activado una función que pintará las velas del color del ADX, proporcionando una ayuda visual al trader que usa este indicador.
EL ADX TIENE 5 COLORES:
• ADX: Verde oscuro (fuerza alcista).
• ADX: Verde Claro (Pérdida de fuerza alcista).
• ADX: rojo oscuro (fuerza bajista).
• ADX: Light Red (Pérdida de fuerza bajista).
• ADX: Naranja (Pérdida de fuerza, Desinterés y bajo volumen).
NOTA:
Es posible activar las líneas (+ DI y -DI) en el indicador si desea utilizar el indicador de forma independiente, sin embargo, se recomienda combinar este indicador con un oscilador direccional, como el Squeeze Momentum Indicator.

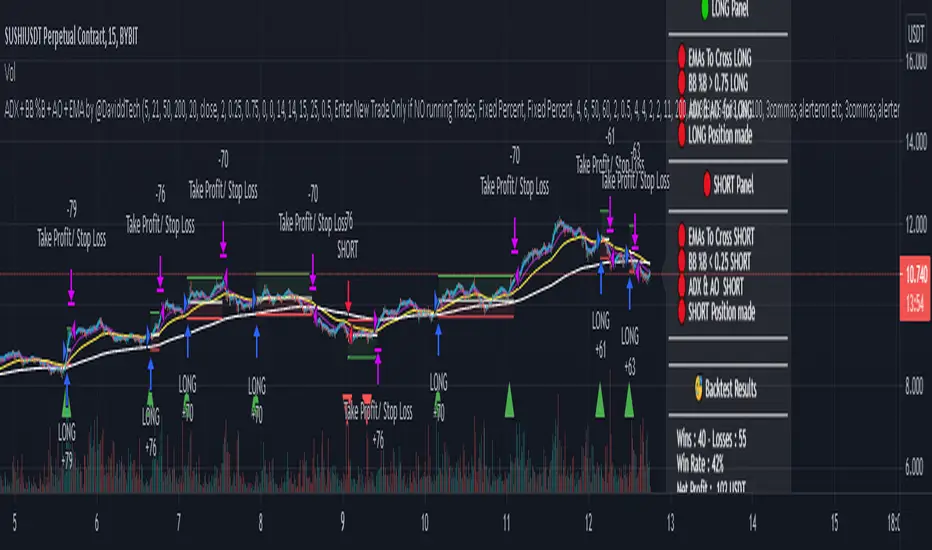
ADX + BB %B + AO + EMA by @DaviddTechThis trading strategy combines different indicators:
1) ADX , Average Directional Movement to make sure we are in a trend.
2) BB %B Bollinger Band %B: to spots relative price position to Bollinger Bands
3) AO Awesome Oscillator for momentum - you will need to configure this to fit the pair.
4) EMA 5, EMA 21, EMA 50, EMA 200: crossovers to get our entry short or long & trend direction
This script was inspired by TraderPro - Crazy 78% Win Rate Proven Trading Strategy Revealed - ADX + BB %B + AO + EMA
My settings are pretty much as default.
- I have added a 10,000 USD default
- 7% of portfolio is used to create the results.
You can of course optimize all of this in the settings.
WARNING:
- For purpose educate only
- Plots EMAs and other values on chart.
- This script to change bars colors.
DCA_PREMIUMOur new indicator tracks trends to create buy and sell alerts, see below how it works.
HOW IT WORKS:
It uses RMA which is the same moving average used by RSI and HMA, they intersect give us an entry signal, be it a buy or sell, as the entry signal the script will color the bars according to the signal.
When a GREEN candle appears, it indicates a large purchase volume and when a PURPLE candle appears, it indicates a large sales volume.
The indicator will alert for entries only according to the trend of the traded asset
FOR EXAMPLE:
I am trading USDJPY in an uptrend, the indicator will only alert me for buy entries, if it applies to downtrend.
DASHBOARD:
Our dashboard indicates the volatility of the traded asset, the short-term trend and the trade signal.
HOW TO USE:
Choose the asset you want to trade and, in the settings, change the time period you want for your trading style, for example: Swing Trade, Day Trade or Position.
See regions with large trading volumes indicating price manipulation or just supports and resistances too strong to break.

ADX / RSI Strategy by Trade Rush (created by SirPoggy) This is one of many new strategies coming soon which were seen on Trade Rush
This one is the ADX / RSI Strategy seen here:
https:www.youtube.com/watch?v=uSkGE0ujyn4
While the strategy has been modified slightly to use the DMI instead of the ADX, the core of the strategy is essentially the same
Long signals are generated when the RSI is above 70, close is above the 200EMA, and the ADX is above 25 (added is the plus DMI over 25 and minus DMI below 20)
Stop loss is placed below /above the 21 EMA, however, there is a deviation required to ensure price is not too close to where a stop loss would be placed.
Short signals are generated when the RSI is below 30, close is below the 200EMA, and the ADX is above 25 (added is the minus DMI over 25 and plus DMI below 20)
I do not recommend using this strategy but I have provided this code for educational purposes.
Thanks!
Let me know which strategy you'd like coded next in the comments below.

Natural Directional Index [CC]The Natural Directional Index was created by Jim Sloman and this is another indicator that I'm publishing from the collection of Ocean indicators. I want to make sure his legacy is covered by as many eyes as possible. This is his version of the directional index indicator but he uses his weighting method to use the square root of time and you can see that the signals are very smooth. Big thanks of course to @altcoinz and @tmac87 for helping me get the full source code and files for all of his work. This indicator captures the current trend and I have used my strong buy and sell signals to let you know the strength of the current trend. Darker colors are for strong signals and lighter colors are for normal ones. Buy when the line turns green and sell when it turns red.
Let me know if there are any other indicators you would like to see me publish!

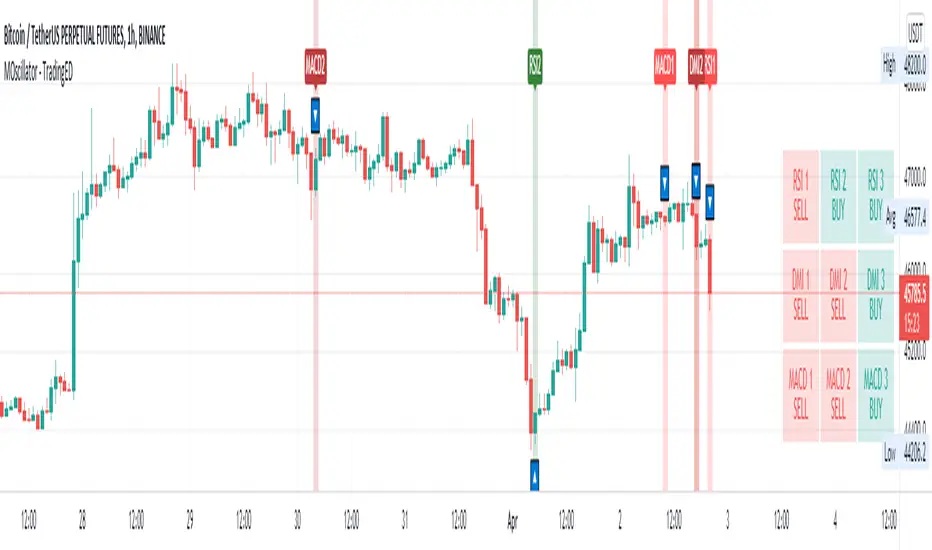
Multiple Oscillator Crossing - TradingEDThis case study is based on different previous studies: ADX Triple , MACD Triple & RSI Triple , with three different counts to compare different oscillations of each indicator. Actually, this indicator is complementary to those previously mentioned . The use of this indicator is restricted to private use, and it can be used only by invitation. Different functionalities have been added to the original codes, such as alerts and signals that seek to make trading much easier to interpret by any type of trading operator of any experience level , from beginner to intermediate and advanced .
Key components of the original ADX indicator:
• The DIRECTIONAL MOVEMENT INDEX (DMI) is a technical indicator that measures both the strength and direction of a price movement and is intended to reduce false signals.
• The DMI uses two standard indicators, one negative ( -DI ) and one positive ( +DI ), in conjunction with a third, the AVERAGE DIRECTIONAL INDEX ( ADX ), which is non-directional but shows momentum.
• The larger the spread between the two primary lines, the stronger the price trend. If +DI is way above -DI the price trend is strongly up. If -DI is way above +DI then the price trend is strongly down.
• ADX measures the strength of the trend, either up or down; a reading above 20 indicates a strong trend.
ADX is plotted as a single line with values ranging from a low of zero to a high of 100. ADX is non-directional; it registers trend strength whether price is trending up or down. The indicator is usually plotted in the same window as the two DMI lines, from which ADX is derived. When +DI is above -DI, there is more upward pressure than downward pressure in the price. Conversely, if -DI is above +DI, then there is more downward pressure on the price. This indicator may help traders assess the trend direction. Crossovers between the lines are also sometimes used as trade signals to buy or sell, theay are the main trade signals. A long trade is taken when the +DI crosses above the -DI and an uptrend could be underway. Meanwhile, a sell signal occurs when the +DI instead crosses below the -DI.
Key components of the original RSI indicator:
● The Relative Strength Index ( RSI ) is a popular momentum oscillator developed in 1978.
● The RSI provides technical traders signals about bullish and bearish price momentum, and it is often plotted beneath the graph of an asset's price.
● An asset is usually considered overbought when the RSI is above 70% and oversold when it is below 30%.
It is a momentum indicator used in technical analysis that measures the magnitude of recent price changes to assess overbought or oversold conditions in the price of an asset. The RSI is displayed as an oscillator (a line chart moving between two extremes) and can read from 0 to 100. Overbought does not necessarily mean that the price will reverse lower, just as oversold does not mean that the price will reverse higher. Rather, the overbought and oversold conditions simply alert traders that the RSI is near the extremes of its recent readings.
Key components of the original MACD indicator:
● The Moving Average Convergence Divergence ( MACD ) is calculated by subtracting a long period (26) Exponential Moving Average ( EMA ) from a short (12) period EMA .
● MACD triggers technical signals when it crosses above (to buy) or below (to sell) its signal line.
● The speed of crossovers is also taken as a signal of a market is overbought or oversold.
● MACD helps traders to understand whether the bullish or bearish movement in the price is strengthening or weakening.
It is a momentum indicator that follows the trend and shows the relationship between two moving averages of the price of a security. It can function as a trigger for buy and sell signals, when you cross above (to buy) or below (to sell) your signal line. It helps to understand if the movement is bullish or bearish , if it is getting stronger or weaker. The further the MACD is above or below its baseline, it indicates that the distance between the two EMAs will be growing, often shown with a histogram that graphically represents the distance between the MACD and its signal line, and It is used to identify when the bullish or bearish momentum.
Main functions of this modified indicator:
1) The SOURCE for the counts can be determined by the trader (close, open, etc).
2) In some cases, you can select the type of MOVING AVERAGE , among many available options ( SMA , EMA , DEMA , HMA , etc.)
3) The MEASURE can be based on a CANDLES count if you are trading OHLC Charts from 1D onwards , or if your trading is intraday, you can also select counts by MINUTES , HOURS or DAYS , depending on your trading style.
4) LENGTH , by default it will be loaded as in the STRATEGY , but considering the previous point, you can modify it according to your convenience.
5) You have the option to hide or show a LABEL at the top of the chart, with respect to the signals: BULLISH green, BEARISH red. *
6) You have the option to hide or show INDICATORS or SIGNALS based on EACH OSCILLATION .
Main performance functions of this modified indicator:
I) In the case of the PERFORMANCE that appears at the right of the chart, you have the option to adjust the WIDTH of each box.
II) The TEXT of the PERFORMANCE is not modifiable, but you can customize the default color. *
III) The BACKGROUND of the PERFORMANCE , you can customize the default color. *
IV) You have the option to hide or show a PERFORMANCE that appears at the right of the chart.
Main functions to customize the style of this indicator:
a) For any type of SIGNAL , it is painted as a VERTICAL LINE in the graph, you can change the color that comes by default. *
b) In the case of the LABELS that appear at the top, the text is not modifiable, but you can customize both the type of label and change the default color. *
c) When you have a SHORT SIGNAL or a LONG SIGNAL , you can change the EMOTICON that comes by default. **
* By default, they are marked as red for downtrends and green for uptrends.
** By default, they are marked with an emoticon indicating the possible direction of the price, down if it is bearish or up if it is bullish .
VWMA with kNN Machine Learning: MFI/ADXThis is an experimental strategy that uses a Volume-weighted MA (VWMA) crossing together with Machine Learning kNN filter that uses ADX and MFI to predict, whether the signal is useful. k-nearest neighbours (kNN) is one of the simplest Machine Learning classification algorithms: it puts input parameters in a multidimensional space, and then when a new set of parameters are given, it makes a prediction based on plurality vote of its k neighbours.
Money Flow Index (MFI) is an oscillator similar to RSI, but with volume taken into account. Average Directional Index (ADX) is an indicator of trend strength. By putting them together on two-dimensional space and checking, whether nearby values have indicated a strong uptrend or downtrend, we hope to filter out bad signals from the MA crossing strategy.
This is an experiment, so any feedback would be appreciated. It was tested on BTC/USDT pair on 5 minute timeframe. I am planning to expand this strategy in the future to include more moving averages and filters.

VIX Fix Double PleasureFULL README: github.com/samgozman/vix-fix-double-pleasure
The idea of an oscillator is quite simple. It is based on the popular VIX Fix oscillator, the purpose of which is to find local bottoms within the scope of trend movement. But in addition to the classic VIX fix, I built an oscillator opposite to it, which serves as a potential signal of the end of local growth.
Components
VIX Fix classic (red lines)
VIX Fix reversed (green lines)
Buy/sell signals (colored dots)
Parameters
VIXFix_length - defval: 22. Classic length for VIX fix
VIXFix_arraySize - defval: 22. The number of periods among which to look for lows and highs. If there are too many signals, reduce this value.
plotMarks - defval: true. Plot high/low marks
How it is calculated
VIX fix classic: (highest(close, VIXFix_length) - low) / highest(close, VIXFix_length) * -100
VIX fix reversed: (lowest(close, VIXFix_length) - high) / lowest(close, VIXFix_length) * -100
Signals
🟢 Buy signal if current "VIX fix classic" or "VIX Fix reversed" value is lowest from the last VIXFix_arraySize periods.
🔴 Sell signal if current "VIX fix classic" or "VIX Fix reversed" value is highest from the last VIXFix_arraySize periods.
General recommendations
I advise you not to use this oscillator for a short positions. Long only . It is recommended to set a long position by pyramiding.

SADX+DI - Smoothed Average Directional Index by CrypTauxThis script is based on ADX/DI and I use it to enter when trend is in early stage, then ride it & exit at the right time (that's the theory)
ADX is shown as histogram :
- light silver bars = price is under thresold but still no trend, be patient.
- strong gray bars = prepare to enter the trade soon
- blue bars = price momentum so ride the trend
- yellow bars = do not trade (price reverts or consolidates)
Background color/bottom area based on DI+/DI- :
- green = uptrend
- red = downtrend
Top pink triangles appears when ADX is relatively low based on "lookback" history (not based on previous static threshold) so a new trend may happens so stay alerts.
- Prepare for enter when bars turn dark gray and/or pink triangles appears.
- Enter position as soon as you see blue bar (Long or Short as indicated by the area color)
- and Exit on first yellow bar.
Quite simple, works on multiple HTF/LTF and might be used with graphical analysis to find best opportunities.
Enjoy :)
--
Version 35.
DMI With Crosses (MyNewTrade)Directional Movement Indicator:
+DI and -DI
I changed the color of the bar bars according to the crossed of +DI and -DI . It helps us to have an idea of whether the trend is continuing or not.
+DI crossover to -DI barcolor is Aqua, if not bar color is Red.
It also helps us to find the lowest and highest points of the graph according to the positions of Adx +DI and -DI .
It gives warnings at the lowest and highest points, which helps us to detect the direction of the trend.

ADX Triple - Average Directional Movement Index - TradingEDThis case study is based on a previous ADX + DM study, but with three different counts to compare different trends. The use of this indicator is restricted to private use, and it can be used only by invitation. Different functionalities have been added to the original code, such as alerts and signals that seek to make trading much easier to interpret by any type of trading operator of any experience level, from beginner to intermediate and advanced.
Key components of the original indicator:
• The DIRECTIONAL MOVEMENT INDEX (DMI) is a technical indicator that measures both the strength and direction of a price movement and is intended to reduce false signals.
• The DMI uses two standard indicators, one negative (-DI) and one positive (+DI), in conjunction with a third, the AVERAGE DIRECTIONAL INDEX (ADX), which is non-directional but shows momentum.
• The larger the spread between the two primary lines, the stronger the price trend. If +DI is way above -DI the price trend is strongly up. If -DI is way above +DI then the price trend is strongly down.
• ADX measures the strength of the trend, either up or down; a reading above 20 indicates a strong trend.
ADX is plotted as a single line with values ranging from a low of zero to a high of 100. ADX is non-directional; it registers trend strength whether price is trending up or down. The indicator is usually plotted in the same window as the two DMI lines, from which ADX is derived. When +DI is above -DI , there is more upward pressure than downward pressure in the price. Conversely, if -DI is above +DI , then there is more downward pressure on the price. This indicator may help traders assess the trend direction. Crossovers between the lines are also sometimes used as trade signals to buy or sell, theay are the main trade signals. A long trade is taken when the +DI crosses above the -DI and an uptrend could be underway. Meanwhile, a sell signal occurs when the +DI instead crosses below the -DI .
Main functions of this modified indicator:
1) You can select the type of MOVING AVERAGE , among many available options (SMA, EMA, DEMA, HMA, etc.)
2) The SOURCE for the counts can be determined by the trader (close, open, etc).
3) The MEASURE can be based on a CANDLES count if you are trading OHLC Charts from 1D onwards , or if your trading is intraday, you can also select counts by MINUTES , HOURS or DAYS , depending on your trading style.
4) LENGTH , by default it will be loaded as in the STRATEGY , but considering the previous point, you can modify it according to your convenience.
5) You have the option to hide or show a LABEL at the top of the chart, with respect to the signals: BULLISH green, BEARISH red.
Main performance functions of this modified indicator:
I) In the case of the PERFORMANCE that appears at the right of the chart, you have the option to adjust the WIDTH of each box.
II) The TEXT of the PERFORMANCE is not modifiable, but you can customize the default color. *
III) The BACKGROUND of the PERFORMANCE , you can customize the default color. *
IV) You have the option to hide or show a PERFORMANCE that appears at the right of the chart.
Main functions to customize the style of this indicator:
a) You can select the color for ADX and for DMI , with the colors that best suit you.
b) The CROSSOVER/CROSSUNDER signal between DI+ and DI- can also be customized. *
c) For any type of SIGNAL , it is painted as a VERTICAL LINE in the graph, you can change the color that comes by default. *
d) In the case of the LABELS that appear at the top, the text is not modifiable, but you can customize both the type of label and change the default color. *
e) You can select the colors for the BACKGROUND of the indicator according to the trend, whether it is BEARISH or BULLISH , with the colors that best suit you. *
* By default, they are marked as red for downtrends and green for uptrends.

KINSKI ADXThis ADX indicator (Average Directional Index) tries to estimate the strength of a trend. The Average Directional Index is derived from the positive (+DI) and the negative directional indicator (-DI). The direction of movement is determined by comparing the highs and lows of the current and past periods.
As soon as the indicator determines a trend strength for upward or downward trend, a label is displayed. An upward trend is labelled "Bullish Trend". The downward trend bears the label "Bearish Trend".
The clouds in the background represent the movements of the Average Directional Index High/Low:
Color orange: neutral, uncertain in which direction it is going.
Color green: upward trend
Color red: downward trend
The line represents the average value of the ADX signal:
Color orange: neutral: still uncertain in which direction it is going
Color green / outgoing line: upward trend
Color green / descending line: weakening upward trend
Color red / exiting line: downward trend
Color red / descending line: weakening downward trend
The following configurable options are possible:
"ADX Smoothing
Directional Index Length
Level Range
Level Trend

Tradelivio's Ranging vs Trending Indicator ADXThis indicator is based on ADX and helps identify if a market is ranging/consolidating or trending.
Default setting are as follows:
0-15 Absent Trend
15-25 Weak Trend
25+ Strong Trend
FYI:
50-75 Very Strong Trend
75-100 Extremely Strong Trend
You can configure 3 levels of strength (Absent, Weak & Strong)
Please keep in mind that a falling ADX line only means that the trend strength is weakening, and it usually does not mean the trend is reversing, unless there has been a price climax.

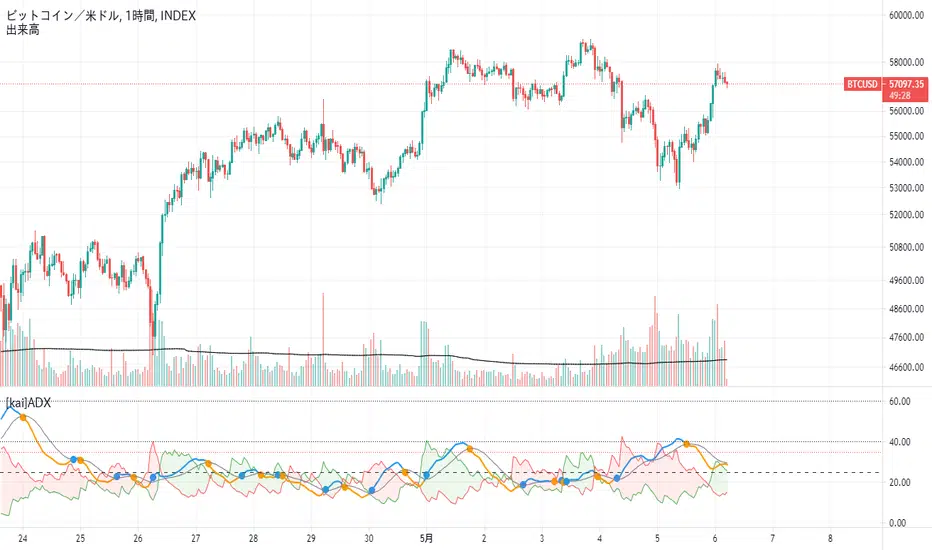
[kai]ADXIt is an indicator that makes it easy to understand the change of ADX by adding a moving average to the famous indicator ADX.
Since ADX and DI have a part where the calculation formula of DI + and DI- is fixed to one bar, there was a problem that it does not make much sense to increase the length.
The biggest feature of this indicator is that it allows you to calculate multiple bars by increasing the multipler option.
For example, by setting multipler = 4 in the 1-hour time frame, it is possible to resemble the calculation result of the 4-hour bar in a multi-time frame.
How to use this Inge is the same as how to use ADX and DI
When ADX (orange) GX (blue circle), take a position in the direction of DI (green zone, red zone),
I think the payment is good when ADX (blue) is DX (orange circle)
when DI +(green), DI-(red) is 35 or more, contrarian is dangerous.
有名なインジケーターのADXに移動平均を付けてADXの変化をわかりやすくしたインジケーターです
ADXとDIはDI+,DI-の計算式がバー一本固定の部分があるので、lengthを増やしてもあまり意味がない問題がありました
このインジではmultiplerオプションを増やすことによって、複数のバーを計算できるようにしたのが最大の特徴になります
例えば1時間足でmultipler=4にすることでかなりマルチタイムフレームの4時間足の計算結果に似せることができます
このインジの使い方は、ADX、DIの使い方と同じです
ADX(オレンジ)がGX(青丸)した時にDI(緑塗り、赤塗り)の方向にポジションを取って、
ADX(青)がDX(オレンジ丸)した時に、決済がよいと思います
DI+(緑),DI-(赤)が35以上の時に逆張りは危険です
Squeeze Momentum [Plus]The "Momentum" in this indicator is smoothed out using linear regression. The Momentum is what is displayed on the indicator as a histogram, its purpose is obvious (to show momentum).
What is a Squeeze? A squeeze occurs when Bollinger Bands tighten up enough to slip inside of Keltner Channels .
This is interpreted as price is compressing and building up energy before releasing it and making a big move.
Traditionally, John Carter's version uses 20 period SMAs as the basis lines on both the BB and the KC.
In this version, I've given the freedom to change this and try out different types of moving averages.
The original squeeze indicator had only one Squeeze setting, though this new one has three.
The gray dot Squeeze, call it a "low squeeze" or an "early squeeze" - this is the easiest Squeeze to form based on its settings.
The orange dot Squeeze is the original from the first Squeeze indicator.
And finally, the yellow dot squeeze, call it a "high squeeze" or "power squeeze" - is the most difficult to form and suggests price is under extreme levels of compression.
Now to explain the parameters:
Squeeze Input - This is just the source for the Squeeze to use, default value is closing price.
Length - This is the length of time used to calculate the Bollinger Bands and Keltner Channels .
Bollinger Bands Calculation Type - Selects the type of moving average used to create the Bollinger Bands .
Keltner Channel Calculation Type - Selects the type of moving average used to create the Keltner Channel.
Color Format - you to choose one of 5 different color schemes.
Draw Divergence - Self explanatory here, this will auto-draw divergence on the indicator.
Gray Background for Dark Mode - to make them more visually appealing.
Added ADX (Average Directional Index) that measure a trend’s strength. The higher the ADX value, the stronger the trend. The ADX line is white when it has a positive slope, otherwise it is gray. When the ADX has a very large dispersion with respect to the momentum histogram, increase the scale number.
Added "H (Hull Moving Average) Signal". Hull is a extremely responsive and smooth moving average created by Alan Hull in 2005. Have option to chose between 3 Hull variations.
Added "Williams Vix Fix" signal. The Vix is one of the most reliable indicators in history for finding market bottoms. The Williams Vix Fix is simply a code from Larry Williams creating almost identical results for creating the same ability the Vix has to all assets.
The VIX has always been much better at signaling bottoms than tops. Simple reason is when market falls retail traders panic and increase volatility, and professionals come in and capitalize on the situation. At market tops there is no one panicking... just liquidity drying up.
The FE green triangles are "Filtered Entries"
The AE green triangles are "Aggressive Filtered Entries"

(JS) Triple StochasticSo I ended up adding a ton of stuff to my prior Double Stochastic script which you can see here .
The concept of the Double was to smooth out the existing Stochastic by applying a Stochastic to the existing Stochastic (hence the Double). My concept for the Triple Stochastic is much different. It combines a regular stochastic, stochastic RSI, and the double stochastic to get a smoothed output based on all 3.
Also - since I love being able to see a Squeeze (see my Squeeze Pro indicators - Squeeze Pro 2 & Squeeze Pro Overlays ) I added the Squeeze to the Stochastic (the dots). If you're unfamiliar with how a Squeeze works, or what it is, check out my links for explanation. A quick explanation however is that the Squeeze is an indicator that was invented by John Carter that detects price compression before a big move out of a range. This is done by using Bollinger Bands and Keltner Channels, the BB shrink inside the KC. The color of the dots represent the depth of the BB in the KC, white (or black) being the lightest squeeze, red being the standard squeeze, and yellow being the strongest squeeze. Now on to the indicator:
The first thing you'll notice is the options available for the type of Stochastic you'd like to use:
Standard : This is a regular Stochastic
Stochastic RSI : This is the standard Stochastic RSI
Double : This is the Stochastic on top of a Stochastic from the prior version
Triple : This is simply an average of all 3 of the above combined together
(Top indicator shows the Triple Stochastic)
The options "K", "D", and "Smooth" are the settings from a regular Stochastic used to set up the type of Stochastic you choose to use.
Now let's say you're not sure how one type performs compared to another, or you like the quickest momentum change but also like to see the smoothest trend, or you want to use the same types of Stochastic and watch for them to cross like moving averages - for these reasons I added the ability to add a second Stochastic for comparison.
(2nd indicator shows a fast and slow Triple Stochastic together)
Quite obviously, the "K 2", "D 2", and "Smooth 2" are what is used in order to set the parameters for the second Stochastic.
Now another thing I added was the option to replace the regular Stochastic and instead look at the distance between the K and D. By turning off "Use K% and D%" you get to see this in action. To put it simply, a cross above zero would indicate a positive Stochastic crossover, and a cross below zero would represent the opposite. There's also an option titled "SMA Length using Difference" which, to smooth this out a bit, allows you to apply a moving average to the distance. By setting it at 1 you'd see the actual distance between K and D.
(3rd indicator shows the K and D distance used as a plot)
Another thing I wanted to do was add a different type of background that wasn't based on the indicator itself. I decided to use ADX & DMI which is a great way to determine the trend. When you select "ADX/DMI BG" the BG colors will change from being based on the indicator to being based on ADX and DMI.
(The 3rd indicator also shows the ADX/DMI BG being used).
And now finally the last feature I decided to add takes us back to the Squeeze. Essentially it is just the Stochastic shown through the lens of Squeeze momentum, as I ended up plugging the Stochastic output into the Squeeze momentum formula to create an oscillator. By selecting "Use Oscillator" you will see this in action as well.
(Bottom indicator shows the oscillator addition)
