IDX_ADROPT Alamtri Resources Indonesia Tbk (ADRO), formerly PT Adaro Energy Indonesia Tbk, is an integrated Indonesian mining and energy group focusing on coal, minerals, and renewable energy. The company is one of Indonesia's largest coal producers, operating across the entire supply chain from exploration to logistics. As of December 19, 2025, ADRO's stock price was IDR 1,900.0, with a market capitalization of approximately IDR 55.39 trillion.
النطاقات والقنوات

IDX_TLKMPT Telkom Indonesia (Persero) Tbk (TLKM) is Indonesia's largest state-owned telecommunications and information and communication technology (ICT) services provider. The company provides a comprehensive range of services, including mobile, fixed-line, internet, and data communication services through its extensive infrastructure network. As of December 19, 2025, TLKM's stock price was IDR 3,430.0, with a market capitalization of approximately IDR 337.8 trillion.

IDX_PANIPT Pantai Indah Kapuk Dua Tbk (PANI), formerly PT Pratama Abadi Nusa Industri Tbk, is an Indonesian property developer specializing in the Pantai Indah Kapuk 2 (PIK 2) area, a strategic region along the northern coastline of Jakarta and Tangerang. The company shifted its core business from can manufacturing and fishery to real estate development after a change in controlling shareholders in 2021.
As of December 19, 2025, PANI's stock price was IDR 13,150.0, with a market capitalization of approximately IDR 239.14 trillion.

IDX_UNVRPT Unilever Indonesia Tbk (UNVR) is a leading Indonesian fast-moving consumer goods (FMCG) company, producing and distributing a wide range of products across home care, personal care, beauty, wellbeing, and food segments. As of December 19, 2025, UNVR's stock price was IDR 2,640.0, with a market capitalization of approximately IDR 105.68 trillion

IDX_GGRMPT Gudang Garam Tbk (GGRM) is a prominent Indonesian tobacco company specializing in the manufacture and sale of kretek (clove) cigarettes both domestically and internationally. As of December 19, 2025, GGRM's stock price was IDR 13,025.0, with a market capitalization of approximately IDR 25.35 trillion.

IDX_INPCPT Bank Artha Graha Internasional Tbk (INPC) is an Indonesian private bank providing general banking services, including savings, loans, and e-banking, through a variety of segments. As of December 19, 2025, INPC's stock price was IDR 148.0, with a market capitalization of approximately IDR 2.96 trillion.

IDX_BNGAPT Bank CIMB Niaga Tbk (BNGA) is a major Indonesian private bank that provides a full range of banking products and services, including retail, corporate, and Sharia banking, through its extensive network and digital platforms. As of December 19, 2025, BNGA's stock price was IDR 1,755.0, with a market capitalization of approximately IDR 44.38 trillion.

IDX_BDMNPT Bank Danamon Indonesia Tbk (BDMN) is a diversified Indonesian bank that provides general and Sharia-based banking, with core business segments in retail (including micro-banking and consumer financing) and wholesale banking (serving commercial and corporate customers). As of December 19, 2025, BDMN's stock price was IDR 2,450.0 with a market capitalization of approximately IDR 23.71 trillion. The bank is majority-owned by the Japanese financial giant MUFG Bank, Ltd., which holds a 92.47% stake.

IDX_BBTNPT Bank Tabungan Negara (Persero) Tbk (BBTN) is an Indonesian state-owned bank that specializes in the housing finance sector, particularly providing mortgages (KPR) for low- to middle-income individuals and a range of conventional and Sharia banking services. As of December 19, 2025, BBTN's stock price was IDR 1,175.0, with a market capitalization of approximately IDR 16.42 trillion.

IDX_BBRIPT Bank Rakyat Indonesia (Persero) Tbk (BBRI) is the oldest commercial bank in Indonesia, predominantly focused on serving the micro, small, and medium enterprises (MSME) segment. As of December 19, 2025, BBRI's stock price was IDR 3,780.0 with a market capitalization of approximately IDR 566.7 trillion.

IDX_BRISPT Bank Syariah Indonesia Tbk (BRIS) is the largest Sharia bank in Indonesia, formed by the merger of three state-owned Islamic banks in February 2021. It offers a full range of Sharia-compliant personal and business banking services, including savings, financing (based on profit-sharing principles), cards, and digital banking solutions. As of December 19, 2025, BRIS's stock price was IDR 2,270.0 with a market capitalization of approximately IDR 103.3 trillion.

IDX_BMRIPT Bank Mandiri (Persero) Tbk (BMRI) is one of Indonesia's largest state-owned banks, offering a wide array of financial services including wholesale, retail, and Sharia banking. As of December 19, 2025, BMRI's stock price was IDR 5,175.0 with a market capitalization of approximately IDR 483 trillion.

IDX_BBNIPT Bank Negara Indonesia (Persero) Tbk (BBNI) is a leading Indonesian state-owned bank offering a comprehensive range of personal and business banking solutions, including loans, savings, credit cards, trade finance, and cash management. As of December 19, 2025, BBNI's stock price was IDR 4,340.0 with a market capitalization of over IDR 161.6 trillion.

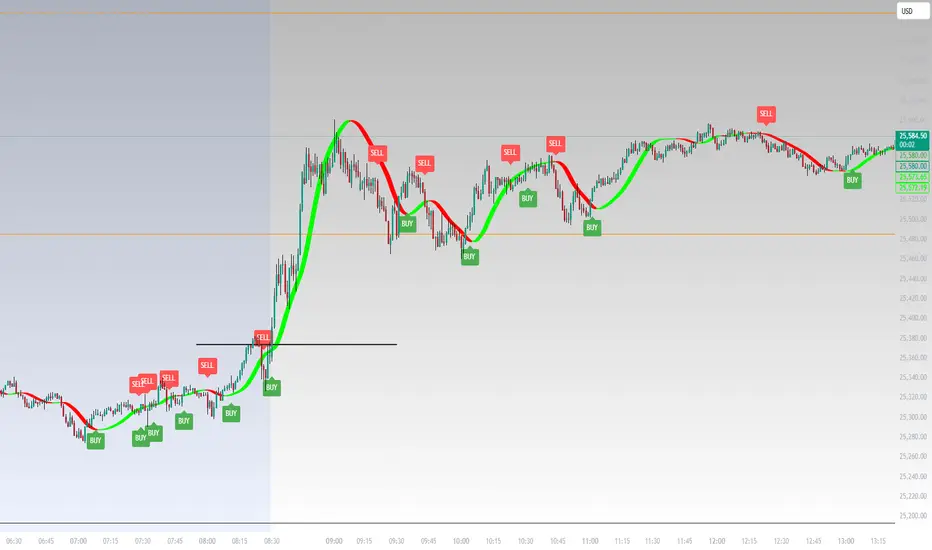
SK BAND SK BAND is a powerful TradingView indicator designed to generate clear and reliable Buy & Sell signals by identifying market trend and price momentum. It helps traders make disciplined and confident trading decisions across different market conditions.
🔹 Key Features
✔ Clear BUY and SELL signals on the chart
✔ Works on Stocks, Indices, Forex, Crypto & Commodities
✔ Suitable for Intraday, Swing, and Positional trading
✔ Helps identify trend direction and momentum
✔ Simple, clean, and beginner-friendly
📈 How It Works
BUY signal appears when bullish momentum strengthens
SELL signal appears when bearish momentum increases
For better accuracy:
Use proper risk management
Confirm signals with support & resistance or higher timeframes
Avoid sideways or low-volume markets
⚠ Disclaimer
This indicator is for educational purposes only.
SK BAND does not provide financial advice. Trading involves risk—always confirm signals with your own analysis.

Linear Regression Channel with Crossover SignalsLinear Regression Channel with Crossover Signals is an overlay indicator that plots a statistically derived **linear regression channel** around price and optionally generates **crossover / re-entry signals**, labels, alerts, and a small on-chart dashboard. It is designed to help visualize trend direction (via regression slope), typical price “containment” (via deviation bands), and potential breakout/mean-reversion events when price interacts with the channel.
---
## What this indicator shows
### 1) Linear Regression Midline (trend estimate)
The midline is the **linear regression value** of `close` over the selected *Regression Length*. It represents the “best fit” straight line through the last *N* bars, providing:
- **Trend direction** (via slope: rising/falling/flat)
- A dynamic reference level for midline cross signals (optional)
### 2) Upper / Lower Deviation Bands (channel)
A channel is built around the regression midline using the **standard deviation of price from the regression line**:
- Upper Band = midline + (stdDev × Deviation Multiplier)
- Lower Band = midline − (stdDev × Deviation Multiplier)
This creates a volatility-scaled envelope that adapts to how tightly or loosely price has been tracking the regression line.
### 3) Optional visual aids
You can independently toggle:
- Channel lines (upper/lower)
- Midline
- Channel fill (shaded area between bands)
- Background coloring to reflect whether price is **above / inside / below** the channel
A dashboard (optional) displays live values and context such as band values, distance from bands, current position, and trend direction.
---
## How it works (calculation overview)
### Regression calculation (manual)
The script calculates slope and intercept using a least-squares approach across the last `lengthInput` bars:
- It iterates over the window, builds sums (X, Y, XY, X²), and computes:
- **Slope** and **Intercept** of the regression line
- The midline value plotted is the regression value at the most recent point in the window.
### Standard deviation from the regression line
Instead of using standard deviation of closes directly, it measures the **deviation of each close from the regression line** and computes:
- variance = average of squared deviations
- stdDev = sqrt(variance)
This is what makes the channel represent “how far price typically strays from the trend line” over the lookback period.
---
## Signal logic (what triggers markers)
All signals are optional and controlled by the **Signal Types** toggles.
### A) Upper band cross signals (optional)
- **Upper Breakout (OB)**: price crosses **above** the Upper Band (`crossover(close, upperBand)`)
- **Upper Re-entry**: price crosses **back below** the Upper Band (`crossunder(close, upperBand)`)
These are often interpreted as “extension above channel” and “return from extension,” but interpretation depends on your style (breakout vs mean reversion).
### B) Lower band cross signals (optional)
- **Lower Breakdown (OS)**: price crosses **below** the Lower Band (`crossunder(close, lowerBand)`)
- **Lower Re-entry**: price crosses **back above** the Lower Band (`crossover(close, lowerBand)`)
### C) Midline cross signals (optional)
- **Mid Bullish**: price crosses above the regression midline
- **Mid Bearish**: price crosses below the regression midline
### D) Re-entry-to-channel signals (enabled by default)
The script tracks whether price was previously:
- **above** the channel (close > upperBand)
- **below** the channel (close < lowerBand)
- **inside** the channel
It then triggers “re-entry” when price returns inside the channel:
- **Bullish Re-entry (Bounce Support)**: price was below and crosses back above the Lower Band
- **Bearish Re-entry (Rejection Resistance)**: price was above and crosses back below the Upper Band
These are intended to highlight potential mean-reversion acceptance back into the “normal” channel range.
---
## Plot markers and labels (what you’ll see)
If enabled, the indicator can plot:
- Triangles and circles for band/midline crosses (with short text such as **OB**, **OS**, ▲, ▼)
- Diamond markers for re-entry confirmations (✓ / ✗)
- Optional text labels describing the event (e.g., “OVERBOUGHT Breakout”, “REJECTION Resistance”, etc.)
Note: this script sets high label/line limits (`max_labels_count` / `max_lines_count`) to reduce the chance of hitting platform limits when many signals occur.
---
## Alerts (optional)
When “Enable Alerts” is ON, the script can fire alerts for:
- Upper breakout / upper re-entry
- Lower breakdown / lower re-entry
- Re-entry bounce / re-entry rejection
- Midline bullish / bearish cross
Alerts are triggered **once per bar** when conditions occur. They are informational and should be validated within your trading plan.
---
## Inputs (how to tune it)
### Channel Settings
- **Regression Length**: larger = smoother and slower to react; smaller = more responsive but noisier
- **Deviation Multiplier**: larger = wider channel (fewer band touches); smaller = tighter channel (more touches)
- **Extend Forward**: present as an input, but this version does not draw forward-projected lines; it primarily affects nothing visually unless you add line objects later
### Signal Settings / Types
- Enable only the signal types you actually use to keep charts clean.
- Re-entry signals are ON by default because they depend on context (previously outside → back inside), which many traders find more meaningful than a single cross alone.
### Visual Settings
- Show/hide channel, midline, fill, background coloring
- Customize colors for upper/lower/mid and fill for readability
---
## Limitations / notes (important for public descriptions)
- This is an **indicator**, not a strategy; it does not backtest performance.
- Linear regression channels are **context-dependent**: strong trends can “ride” a band, and ranging markets can produce frequent crosses.
- Signals are based on **price crossing computed bands** and do not predict direction by themselves.
- Standard deviation bands reflect past dispersion around the regression line; volatility regime shifts can change behavior quickly.
- Always apply risk management and confirm with additional context (structure, volume, higher timeframe bias, session conditions, etc.).

Hulline AAAThis tool displays trendlines that simply show buyer or seller strength based on a combined set of MA and EMA lines
Composite Trend IndicatorsTrend recognition: Based on ZigZag (depth/deviation/backtracking adjustable) annotation HH/HL/LH/LL, draw high and low point lines and labels, and selectable up/down trend coloring and BOS dot hints.
Moving average group: Optional display of 21/55/89/200 EMA, distinguished by different colors.
Support and Resistance: The second segment ZigZag generates horizontal lines or boxes, which can be extended and have quantity limits; diagonal lines and SR lines can be drawn, and labeled HH/HL/LH/LL.
Trend bar: Adaptive moving average (based on efficiency ratio), coloring the K-line to show short-term bullish and bearish momentum.
Divergence Detection: Finds regular/hidden divergences for multiple indicators such as MACD/Hist/RSI/CCI/MOM/OBV/VWMACD/CMF/MFI, draws lines, and can display indicator abbreviations/counts.

ICT Killzones & Sessions Pro |MC|ICT Killzones & Sessions Pro |MC|
Credits go to LuxAlgo for the great work 👍
This indicator has been further developed and enhanced with additional features.
This indicator highlights key market sessions and killzones directly on your chart, helping traders identify high-probability trading periods.
💎 Key features include 💎
🔸Display of major market sessions such as Asia, London, and New York (AM/PM) with customizable times and colors.
🔸Transparent session highlighting for visual clarity without cluttering the chart.
🔸Configurable vertical border lines with adjustable style, width, and color.
🔸Timeframe-based display limits to hide killzones on higher timeframes.
🔸Fully adjustable label size for easy identification of sessions.
🔸Customizable UTC offset to align sessions with your preferred timezone.
Designed for day traders and scalpers, it visually separates market sessions for better trade planning and timing.
Happy Trading!

Opening Price Lines Pro |MC|Opening Price Lines Pro |MC|
Credits go to tradeforopp for the great work 👍
This indicator has been further developed and enhanced with additional features.
💎 Features 💎
This indicator plots key opening prices, session times, and previous day high/low levels directly on the chart. It allows users to:
🔸Display multiple horizontal lines for daily and session open prices with customizable colors, styles, and label sizes.
🔸Show previous day high (PDH), low (PDL), and midline (50% level) for quick reference.
🔸Add vertical timestamp lines for major market sessions or custom times.
🔸Set cutoff times to limit line extensions and control the number of drawn lines on the chart.
🔸Adjust timezone offsets for accurate session and open price visualization.
🔸Fully customize label positions, offsets, colors, and line styles.
🔸Limit visibility based on timeframe and number of days for cleaner charts.
It’s designed to help traders quickly identify key levels and market sessions while maintaining a clean and organized chart layout.
Happy Trading!

ICT CBDR Range |MC|This indicator plots the CBDR Range on the Chart (Credits go to TFlab)
💎 What Is the Central Bank Dealers Range (CBDR)? 💎
In the Inner Circle Trader (ICT) Strategy, the CBDR identifies the projected high and low of a trading day. This range is calculated between 2:00 PM and 8:00 PM New York time. By observing specific deviations from the average price within this window, traders estimate potential price movements for the next session.
The range is derived from average price action.
Deviation levels above and below this average help forecast price behavior.
These deviations indicate how far prices may extend from the central range.
💎 Ideal Range Parameters for CBDR 💎
To optimize CBDR effectiveness, traders should consider the following:
Range Height: Determined by measuring the highest and lowest price within the CBDR window. It is preferable to use candlestick bodies, although wicks can be considered when body size is minimal.
Optimal Range: The most reliable CBDR measurements occur within a range of 10 to 20 pips, ideally remaining under 40 pips.
Large Ranges: When the range exceeds 40 pips, short-term trades tend to perform more favorably.
💎 Benefits of Implementing CBDR 💎
Using the Central Bank Dealers Range offers multiple advantages:
Improved Price Forecasting: Enhances accuracy in predicting price movements.
Risk Minimization: Enables traders to avoid unfavorable trade conditions.
Higher Success Probability: Identifies high-probability trade setups.
Versatility: Applicable to various assets and timeframes.
💎 How to Apply CBDR in Daily Trading 💎
Each trading day, the market tends to move price 1–2 times the CBDR range against the prevailing trend to gather liquidity. Following this, a directional move in line with the trend often occurs, typically equivalent to four times the CBDR range.
💎 Bearish Market Scenario 💎
On bearish days:
Price may exceed the upper CBDR boundary by a maximum of two units.
A typical move is one unit above the range to collect stop orders.
The projected daily low is often three units below the CBDR, usually forming at the end of the London session.
💎 Bullish Market Scenario 💎
On bullish days:
Price generally drops no more than two units below the CBDR.
A downward movement of one unit is common to gather liquidity.
The projected high of the day appears three units above the CBDR, typically near the London session close.
💎 Best Timeframes for CBDR Strategy 💎
CBDR is most effective on the following intraday timeframes:
15-Minute Chart: Offers precise insight into short-term price fluctuations.
30-Minute Chart: Provides a broader perspective for swing trading and market planning.
💎 Most Suitable Markets and Pairs for CBDR 💎
Originally developed for NASDAQ and S&P 500, the CBDR approach has since been adapted for other financial instruments.
Recommended Currency Pairs:
GBP/USD
EUR/USD
Precious Metals:
XAU/USD
XAG/USD
These markets demonstrate favorable price behavior around the CBDR, making them ideal for this strategy.
Happy Trading!


Leg-In | Boring (Small/Medium) | Leg-Out Strategy jayendra//@version=5
indicator("Leg-In | Boring (Small/Medium) | Leg-Out Strategy", overlay=true)
// ================= INPUTS =================
emaLen = input.int(50, "EMA Length")
atrLen = input.int(14, "ATR Length")
slMult = input.float(1.0, "Stop-Loss ATR x", step=0.1)
tpMult = input.float(2.0, "Take-Profit ATR x", step=0.1)
// ================= COLORS =================
legInColor = color.black
boringColor = color.blue
legOutColor = color.purple
// ================= CALCULATIONS =================
emaVal = ta.ema(close, emaLen)
atrVal = ta.atr(atrLen)
// Candle body sizes
legInSize = math.abs(close - open )
boringSize = math.abs(close - open )
legOutSize = math.abs(close - open)
// ================= RULES =================
// Leg-In: strong directional candle
legInValid = legInSize >= boringSize * 2
// Boring: small or medium size (flexible)
boringValid = (boringSize > atrVal * 0.3) and (boringSize <= legInSize)
// Leg-Out: breakout candle
legOutValid = legOutSize >= boringSize * 4
breakUp = high > high
breakDown = low < low
// Pattern valid
patternValid = legInValid and boringValid and legOutValid
// ================= DIRECTION =================
buySignal = patternValid and close > open and breakUp and close > emaVal
sellSignal = patternValid and close < open and breakDown and close < emaVal
setupFound = buySignal or sellSignal
// ================= CANDLE COLORING =================
barcolor(setupFound ? legOutColor : na)
barcolor(setupFound ? boringColor : na, offset=-1)
barcolor(setupFound ? legInColor : na, offset=-2)
// ================= PLOTS =================
plot(emaVal, color=color.orange, linewidth=2, title="EMA")
plotshape(buySignal, title="BUY", text="BUY",
style=shape.labelup, location=location.belowbar,
color=color.green, textcolor=color.white)
plotshape(sellSignal, title="SELL", text="SELL",
style=shape.labeldown, location=location.abovebar,
color=color.red, textcolor=color.white)
// ================= ALERTS =================
alertcondition(buySignal, title="BUY Alert", message="BUY: Leg-In (Black) → Boring (Blue, small/medium) → Leg-Out (Purple)")
alertcondition(sellSignal, title="SELL Alert", message="SELL: Leg-In (Black) → Boring (Blue, small/medium) → Leg-Out (Purple)")
// ================= STOP LOSS / TAKE PROFIT =================
var float buySL = na
var float buyTP = na
var float sellSL = na
var float sellTP = na
if buySignal
buySL := close - atrVal * slMult
buyTP := close + atrVal * tpMult
if sellSignal
sellSL := close + atrVal * slMult
sellTP := close - atrVal * tpMult
plot(buySL, color=color.red, style=plot.style_linebr, title="Buy SL")
plot(buyTP, color=color.green, style=plot.style_linebr, title="Buy TP")
plot(sellSL, color=color.red, style=plot.style_linebr, title="Sell SL")
plot(sellTP, color=color.green, style=plot.style_linebr, title="Sell TP")

Custom Intraday Indicator with FII and Operator Activity//@version=5
indicator("Custom Intraday Indicator with FII and Operator Activity", overlay=true)
// Moving Averages for Entry/Exit Signals
shortMA = ta.sma(close, 9)
longMA = ta.sma(close, 21)
entrySignal = ta.crossover(shortMA, longMA)
exitSignal = ta.crossunder(shortMA, longMA)
// Open Interest and OI Change
oi = request.security(syminfo.ticker + ":OI", timeframe.period, close)
oiChange = oi - ta.valuewhen(oi != na, oi, 1)
// FII and Operator Activity (Assuming data is available from a custom source)
fiiBuying = request.security("FII_BUYING_DATA", timeframe.period, close)
fiiSelling = request.security("FII_SELLING_DATA", timeframe.period, close)
operatorBuying = request.security("OPERATOR_BUYING_DATA", timeframe.period, close)
operatorSelling = request.security("OPERATOR_SELLING_DATA", timeframe.period, close)
// Support and Resistance Levels
pivotHigh = ta.highest(high, 10)
pivotLow = ta.lowest(low, 10)
// Plotting
plot(shortMA, color=color.blue, title="Short MA")
plot(longMA, color=color.red, title="Long MA")
plotshape(entrySignal, style=shape.triangleup, location=location.belowbar, color=color.green, title="Entry Signal")
plotshape(exitSignal, style=shape.triangledown, location=location.abovebar, color=color.red, title="Exit Signal")
plot(pivotHigh, color=color.orange, style=plot.style_line, title="Pivot High")
plot(pivotLow, color=color.purple, style=plot.style_line, title="Pivot Low")
// Display OI and OI Change
plot(oi, color=color.blue, title="Open Interest")
plot(oiChange, color=color.fuchsia, title="OI Change")
// Display FII and Operator Activity
plot(fiiBuying, color=color.green, title="FII Buying")
plot(fiiSelling, color=color.red, title="FII Selling")
plot(operatorBuying, color=color.blue, title="Operator Buying")
plot(operatorSelling, color=color.purple, title="Operator Selling")
