[SCL] True Market StructureSee market structure at a glance with Higher Highs and Lower Lows. Bullish/Bearish/Ranging market bias is automatically derived. Optionally get alerted for breaks in market structure. Uses true Local Highs/Lows instead of simply the highest/lowest "pivot" for x bars. Can be useful as a support for learning market structure or for alerts for a change in structure while you're not at the computer.
النماذج الشرائية

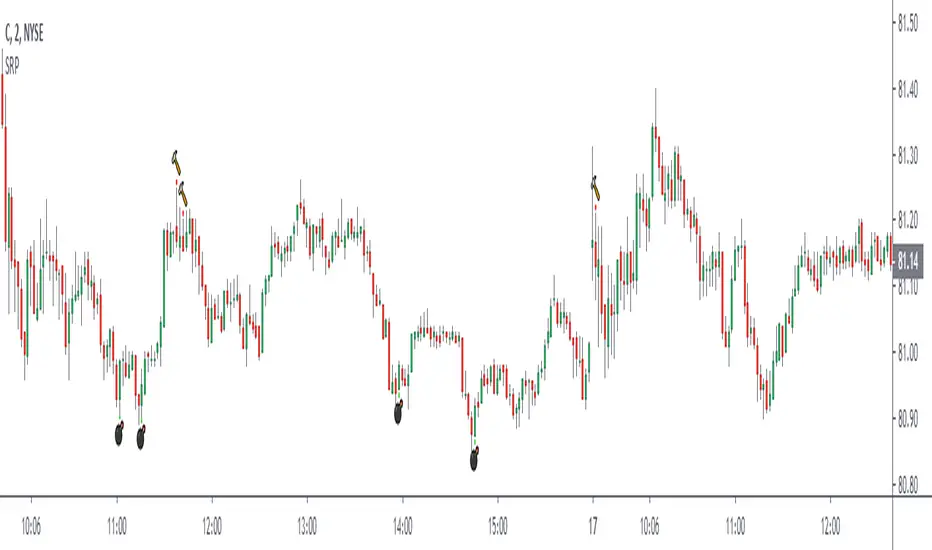
Bullish and Bearish by NicolErazoFThis indicator changes the color of the candlesticks when there’s a change in the trend to the rising or falling trend.
BEARISH ENGULFING: Yellow candlestick. It is an engulfing falling trend reversal; you must make a sell decision.
BEARISH HARAMI: White candlestick. Indicates a possible falling trend change, you must be alert for a possible sale.
BULLISH ENGULFING: Black candlestick. It is a change in the engulfing rising trend, you must make a purchase decision.
BULLISH HARAMI: Blue candlestick. Indicates a possible rising trend change, you should be alert for a possible purchase.
On the chart, you can see the 4 candles, on September 11 the black candle appears indicating a change in the uptrend. But today, the white candle is seen, which appears on September 8, indicating a rebound with a possible change in trend to bearish.
Previous days, on August 26, you see the blue candle with a possible change in the upward trend, which then, on August 28, a yellow candle appears with a change in the downward trend.
The Engulfing indicator (yellow and black) says that the candle has an engulfing change that is radical.
On the other hand, the Harami (blue and white) indicates a possible change in trend that must be previously analyzed.
Harami candles are smaller than Engulfing candles, since Harami in a Japanese term that means pregnancy, where the previous candle is the woman and the next candle is the baby.
___________________________________________________________________________
ESPAÑOL
Este indicador cambia las velas de color cuando ocurre un cambio de tendencia ALCISTA o BAJISTA
BEARISH ENGULFING: Vela de color amarillo. Es una cambio de tendencia bajista envolvente, debes tomar una decisión de venta.
BEARISH HARAMI: Vela de color blanco. Indica un posible cambio de tendencia bajista, debes estar alerta para una posible venta.
BULLISH ENGULFING: Vela de color negro. Es un cambio de tendencia alcista envolvente, debes tomar una decisión de compra.
BULLISH HARAMI: Vela de color azul. Indica un posible cambio de tendencia alcista, debes estar alerta para una posible compra.
En el gráfico, se pueden ver las 4 velas, el 11 de Septiembre aparece la vela negra que indica un cambio de tendencia alcista. Pero hoy, se ve la vela blanca, que aparece el 8 de septiembre, indicando un rebote con un posible cambio de tendencia a bajista.
Días anteriores, el 26 de Agosto, se ve la vela azul con un posible cambio de tendencia alcista, que luego, el 28 de agosto aparece una vela amarilla con cambio de tendencia bajista.
El indicador Engulfing (amarillo y negro) dice que la vela tiene un cambio envolvente que es radical.
En cambio, el Harami (azul y blanco) indica un posible cambio de tendencia que debe ser previamente analizado.
Las velas Harami son más pequeñas que las Engulfing , ya que Harami en un término japonés que significa embarazo, en donde la vela anterior es la mujer y la vela siguiente es el bebé.

Donchian WicksNote: This script does not perform well on its own and is meant to inspire other coders, just sharing it because why not :)
The idea is simple, highest only gets calculated for green candles, lowest only gets calculated for red candles. a yellow dot gets created when a candle gets below lowest line and closes bullish, vise versa for red dots.
Hope someone can use it.

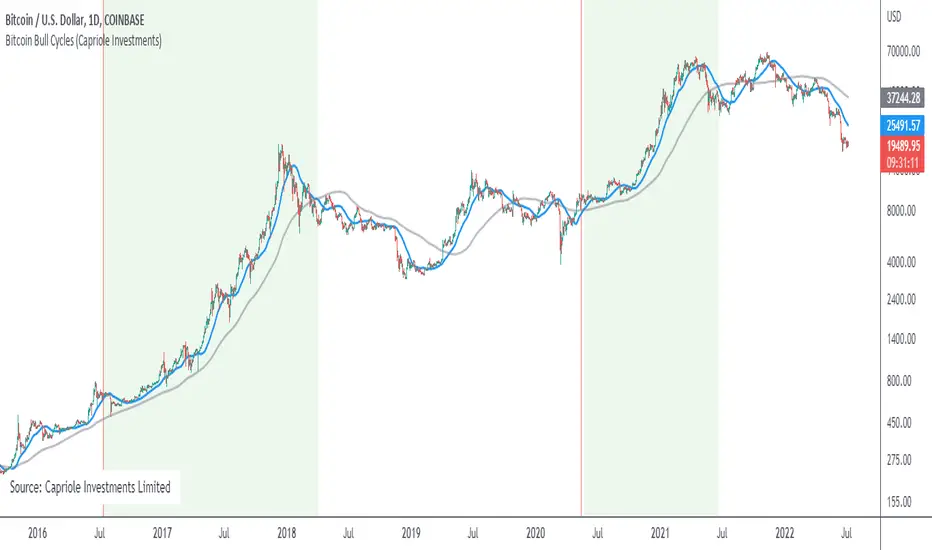
Bitcoin Bull CyclesA simple indicator that identifies the primary upswing of Bitcoin following each Halving, the "Bull Cycle".
A "Bull Cycle" is identified as the first period of positive momentum after each Halving date, defined as the 50 Daily Moving Average (DMA) being above the 200 DMA.
Bullish Piercing ScannerA piercing pattern is known in technical analysis to be a potential signal for a bullish reversal. The formation in its strictest form is rather rare, but tends to perform better the longer the downtrend in front of it. When technical studies such as RSI, Stochastic or MACD are showing a bullish divergence at the same time a piercing pattern appears, it strengthens the likelihood that this two-day pattern is meaningful.
This is a two-candle pattern. The previous candle must be bearish, the recent candle must open below the close of the previous candle, the recent candle must close above the middle of the previous candle. You can adjust the closing and opening gap between the two candles within this scanner's settings (price).

RSI Season Tracker by KrisWatersSeason tracker identifies the momentum with tracking dominance and market capitalization data of Bitcoin , Altcoin and USDT .
With this indicator you can able to get know about Bitcoin, Altcoin and USDT dominance and market capitalization easily.
Backgrond Color Definations:
If the background color of indicator is ORANGE means that Bitcoin dominance is the most powerful. It is a good sign for Bitcoin.
If the background color of indicator is BLUE means that Altcoin dominance is the most powerful. It is a good sign for Altcoins.
If the background color of indicator is GREEN means that USDT dominance is the most powerful. It is a good sign for USDT.
Plus Sign (+) Meaning and Color Definations:
If ORANGE plus sign is visible on indicator means that market capitalization of Bitcoin is increasing. It is a good sign for Bitcoin.
If BLUE plus sign is visible on indicator means that market capitalization of Altcoin is increasing. It is a good sign for Altcoins.
If GREEN plus sign is visible on indicator means that market capitalization of Bitcoin and Altcoins are decreasing. It is not a good sign for both.
Light and Dark RSI Line Color Definations:
If the line of Bitcoin color is Orange means that, RSI value was increased compared with previous bar. It is one of the good sign of the momentum strength.
If the line of Bitcoin color is Yellow means that, RSI value was decreased compared with previous bar. It is not a good sign.
If the line of Altcoin color is Navy means that, RSI value was increased compared with previous bar. It is one of the good sign of the momentum strength.
If the line of Altcoin color is Blue means that, RSI value was decreased compared with previous bar. It is not a good sign.
If the line of USDT color is Green means that, RSI value was increased compared with previous bar. It is one of good the sign of the momentum strength.
If the line of USDT color is Lime means that, RSI value was decreased compared with previous bar. It is not a good sign.
Simple RSI rules are valid for this indicator.
RSI value is under 30 indicates that asset is OVERSOLD .
RSI value is upper 70 indicates that asset is OVERBOUGHT .
Important Notice: Dominance data is not correlated with price. For example; sometimes dominance is increasing but the price is not. And that's where the market capitalization comes in.
If the plus sign is not visible , you can get questioning for the movement. It is not a good sign at all.
If the plus sign is visible and RSI is increasing , It is a good sign for the strength of assets movement.
I recommended to use on DAILY timeframe . But you can use different timeframes as well.
Please leave comment below If you have any question or development idea.

Separated ATR - evoThis script plots two ATR (Average True Range) values, one based on only bullish and the other based on only bearish bars. If the current bar is positive, the negative ATR will use its last known negative bar for the calculation. You can smooth bar directions by using the Heikin Ashi setting.
Use this the same way how you would use the regular ATR indicator, but with the added value of knowing which side of the market has more volatility.


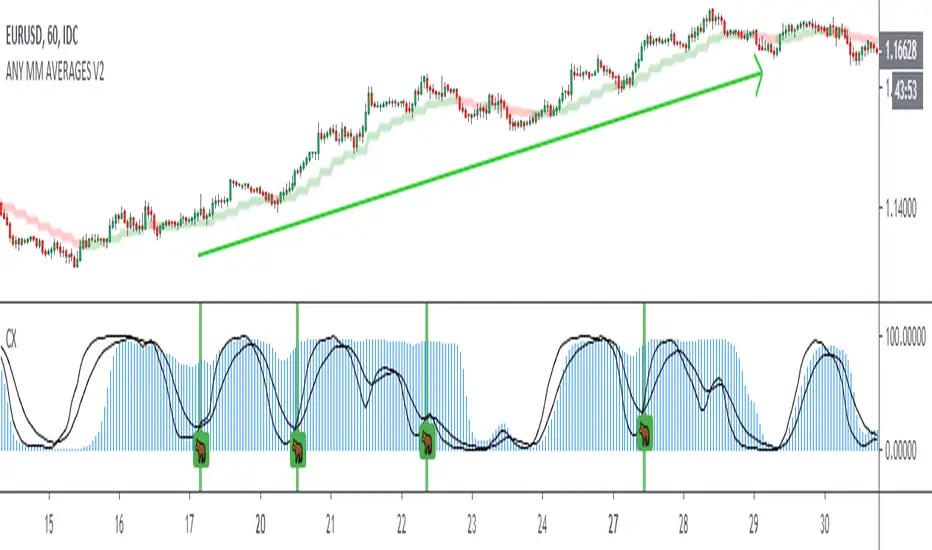
Follow Line MTF Any MM AverageThe original version uses SMA, in this new version you can choose any type of MA and time frame.
- RMA,SMA,EMA,WMA,VWMA,SMMA,KMA,TMA,HullMA,DEMA,TEMA,CTI
- 1 min, 3 min, 5 min, 15 min, 30 min, 45min, 1h, 2h, 3h, 4h, 1d, 1w, 1M
- Alerts
Combine multiple time frames, this will come in handy ¡¡¡¡
Success in your trade ¡¡¡¡
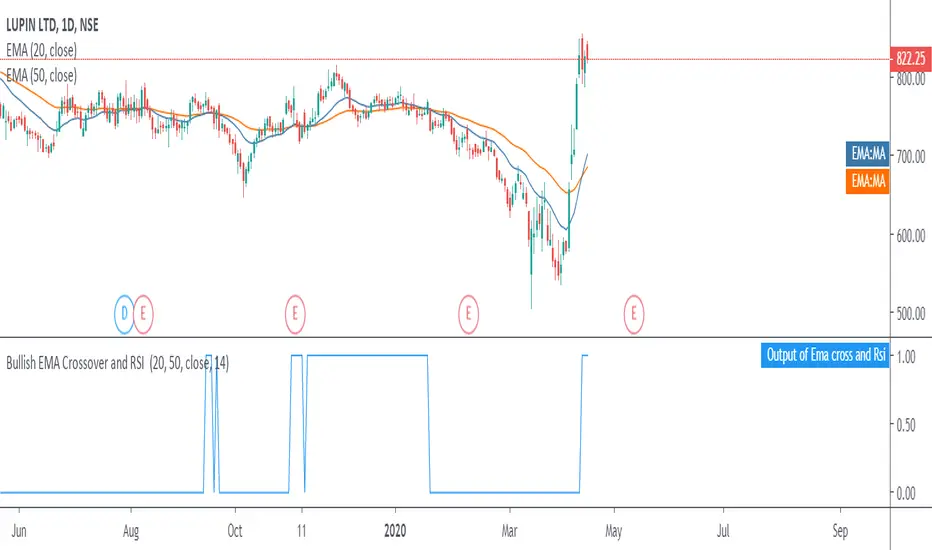
Moving Average Exponential crossover with bullish RSI signalsWhen the market is giving the signals for bullish trend, which shows the shorter period exponential(20) moving average crossing the longer period moving average(50), with a strength shown in the market i.e. RSI greater than 40.
So when all these conditions are met a buy signal is generated in output (Output of Ema cross and Rsi) having value as 1.
So a trader can enter into a long position when the value is 1 and exits a stock when value is 0.
This script is not to be used for selling the stocks in downtrend
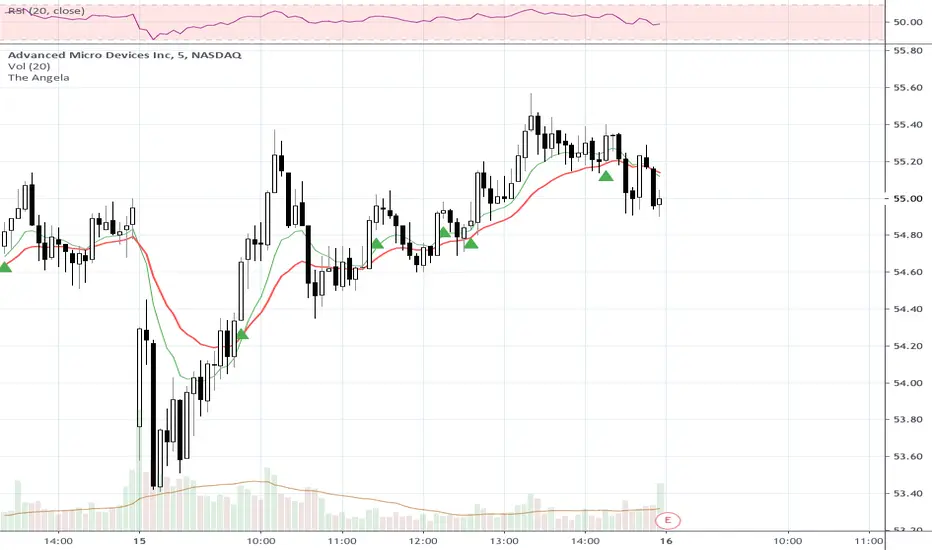
The AngelaThis script is based on Angela, an RLT trading LEGEND. The green line=10ema, red=20ema. The green triangle shows up when the buy signal is triggered. This script also has a BUY ZONE alert that can be setup as well.
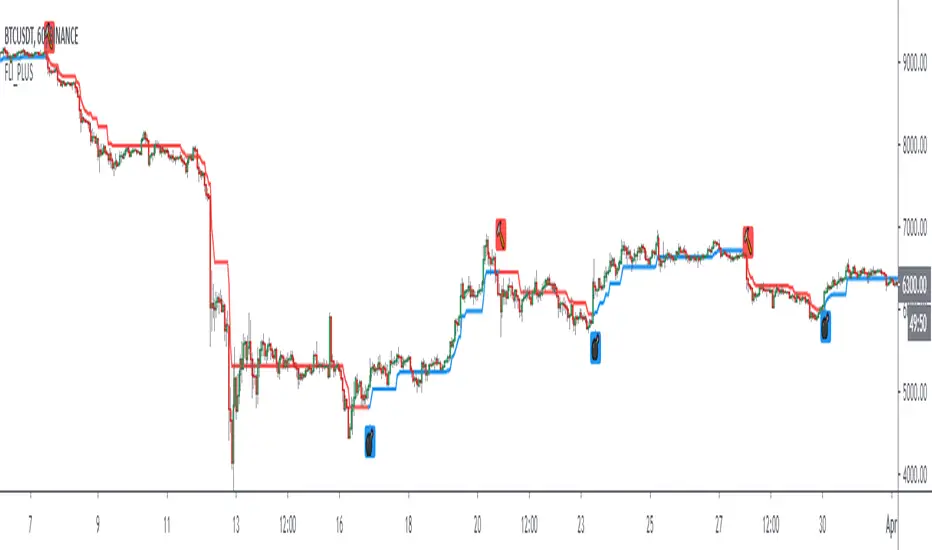
Follow Line IndicatorThe FollowLine indicator is a trend following indicator. The blue/red lines are activated when the price closes above the upper Bollinger band or below the lower one.
Once the trigger of the trend direction is made, the FollowLine will be placed at High or Low (depending of the trend).
An ATR filter can be selected to place the line at a more distance level than the normal mode settled at candles Highs/Lows.
Alerts Added

Superstock 10-30 WMA Band script I was reading Jesse Stine's Insider Buy Superstocks book, and one of the technical traits he mentioned of a superstock (read the book, seriously, very strongly recommended) was a breakout above the 30 weekly moving average. He goes on to mention that after breakout, the 10 WMA often acts as a support line where you can add to your position. This script is inspired by the visual direction of Chris Moody's slingshot system, and how it displays MA's. The skinny line is the 10 WMA and the bigger line is the 30.

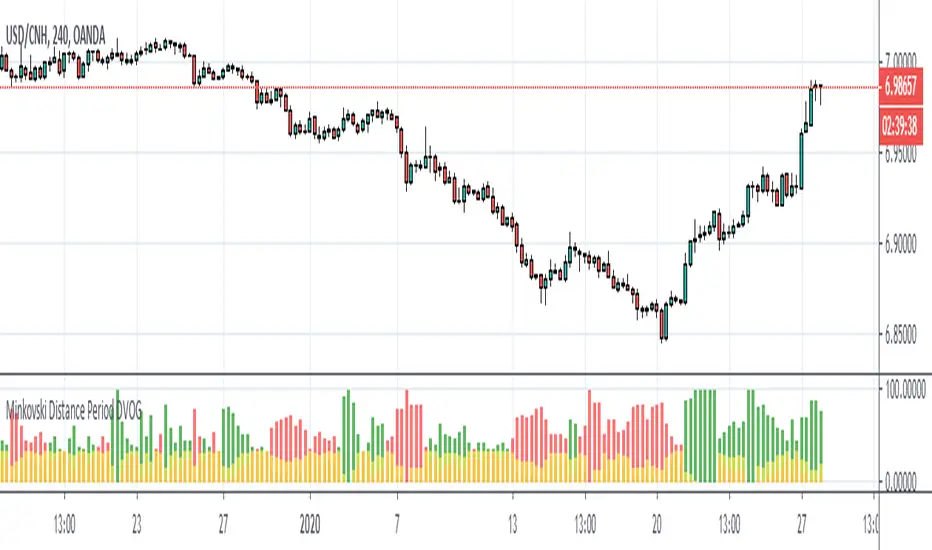
Minkovski Distance Period DVOGThis script was created by building my Dependent Variable Odd Generator script on the Minkovski Distance Adaptive Period.
I have tried this on MACD before.
Script related to MACD :
I used an older version that does not use Dow Factor to suit multi timeframe analysis.
In this way, market situations provide the opportunity to see histograms in an adaptive period as a Multi Timeframe.
Minkowski Distance Function Original Script by RicardoSantos :
Regards.
Simple Reversal PointThis indicator finds possible points of reversion, you can use it to stack positions and get a good average price for when the price changes direction, it is the trader responsibility to manage the position and make a profit.
-Added alerts
Crack XThis indicator looks for cracks (de-correlation of 2 indicators), what you have to do is simple, first look at the trend in a higher frame, there are many indicators for this, then look for cracks as wide as possible (you can configure the size in the configuration) and that they are not close to important supports / resistances. This indicator can be very useful for Swing, Coverages, to increase existing positions.The confirmation of the crack occurs when the black lines cross + bar closure.
- Added Alerts
Premium Stochastic OscillatorThe PSO is a rewired version of a short-period stochastic. Unlike a standard stochastic oscillator, this indicator is normalized to register neutral values at zero while providing greater sensitivity to short-term price moves. This indicator uses a central zero line as a reference point and will oscillate above and below this point as price fluctuates. In addition, the PSO is smoothed by using a double exponential moving average to provide a more even response to turns in the market.
(from TASC magazine, August 2008 issue).
The Premium Stochastic Oscillator was introduced by technical analyst Lee Leibfarth.

Normalized Smoothed MACDMACD normalized with its highest and lowest values over the last “Normalization period”
- includes alerts


KDJ Indicator The KDJ indicator is derived from the Stochastic with the one difference being the addition of the J line. This implies that the KDJ indicator has a total of three lines; %K%D%J. The %J is simply put, the difference between the %K and the %D lines, which is similar to the MACD.
The difference between the %J and that of the MACD is that it is plotted as a histogram and the second being that the value are weighted and as such delivers more emphasis on the shorter term %K line.
What we now have is a line that moves quite slowly and has the knack to move beyond the range of a normal stochastic indicator.

Divergence of DecisionPoint Breadth Swenlin Trading [LazyBear]// This source code is subject to the terms of the Mozilla Public License 2.0 at mozilla.org
// © 03.freeman
//This is indicator from LazyBear is very accurate for stocks and indexes.
//I added some code snippets for spot and draw divergences automatically
//
// @author LazyBear
//
//
Best use with daily time frame.
Enter when a divergence is found (Bull or Bear label) and wait at least a couple of candles before exit.
Next improvement: alerts ready made for webhooks and screener for multiple tickers.
Please use comment section for any feedback.

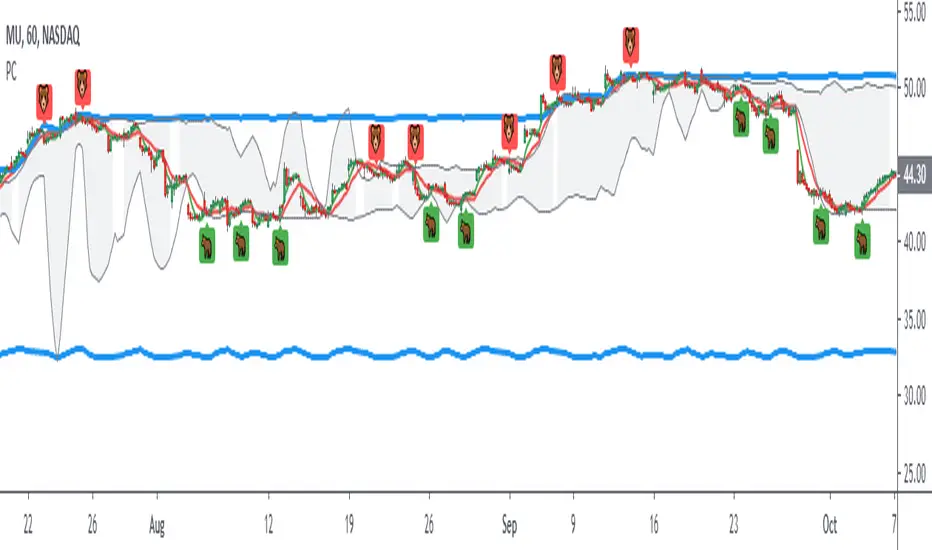
Market ModeThe Market Mode indicator seeks to identify trends and rebounds by identifying “phases” according to the principles of John Ehlers.
- When the oscillator passes above the top line, the market is in an uptrend.
- When the oscillator goes below the bottom line, the market is in a downtrend.
- Between these two levels, the market is calmer and could rebound in the direction of the initial trend and / or phase of trend change.
