RSI Overbought/Oversold + Divergence IndicatorDESCRIPTION:
This script combines the Relative Strength Index ( RSI ), Moving Average and Divergence indicator to make a better decision when to enter or exit a trade.
- The Moving Average line (MA) has been made hidden by default but enhanced with an RSIMA cloud.
- When the RSI is above the selected MA it turns into green and when the RSI is below the select MA it turns into red.
- When the RSI is moving into the Overbought or Oversold area, some highlighted areas will appear.
- When some divergences or hidden divergences are detected an extra indication will be highlighted.
- When the divergence appear in the Overbought or Oversold area the more weight it give to make a decision.
- The same color pallet has been used as the default candlestick colors so it looks familiar.
HOW TO USE:
The prerequisite is that we have some knowledge about the Elliot Wave Theory, the Fibonacci Retracement and the Fibonacci Extension tools.
Wave 1
(1) When we receive some buy signals we wait until we receive some extra indications.
(2) On the RSI Overbought/Oversold + Divergence Indicator we can see a Bullish Divergence and our RSI is changing from red to green ( RSI is higher then the MA).
(3) If we are getting here into the trade then we need to use a stop loss. We put our stop loss 1 a 2 pips just below the lowest wick. We also invest maximum 50% of the total amount we want to invest.
Wave 2
(4) Now we wait until we see a clear reversal and here we starting to use the Fibonacci Retracement tool. We draw a line from the lowest point of wave(1) till the highest point of wave (1). When we are retraced till the 0.618 fib also called the golden ratio we check again the RSI Overbought/Oversold + Divergence Indicator. When we see a reversal we do our second buy. We set again a stop loss just below the lowest wick (this is the yellow line on the chart). We also move the stop loss we have set in step (3) to this level.
Wave 3
(5) To identify how far the uptrend can go we need to use the Fibonacci Extension tool. We draw a line from the lowest point of wave(1) till the highest point of wave (1) and draw it back to the lowest point of wave (2). Wave (3) is most of the time the longest wave and can go till it has reached the 1.618 or 2.618 fib. On the 1.618 we can take some profit. If we don't want to sell we move our stop loss to the 1 fib line (yellow line on the chart).
(6) We wait until we see a clear reversal on the Overbought/Oversold + Divergence Indicator and sell 33% to 50% of our investment.
Wave 4
(7) Now we wait again until we see a clear reversal and here we starting to use the Fibonacci Retracement tool. We draw a line from the lowest point of wave(2) till the highest point of wave (3). When we are retraced till the 0.618 fib also called the golden ratio we check again the RSI Overbought/Oversold + Divergence Indicator. When we see a reversal we buy again. We set again a stop loss just below the lowest wick (this is the yellow line on the chart).
(8) If we bought at the first reversal ours stop los was triggered (9) and we got out of the trade.
(9) If we did not bought at step (7) because our candle did not hit the 0.618 fib or we got stopped out of the trade we buy again at the reversal.
Wave 5
(10) To identify how far the uptrend can go we need to use the Fibonacci Extension tool. We draw a line from the lowest point of wave(2) till the highest point of wave (3) and draw it back to the lowest point of wave (4). Most of the time wave 5 goes up till it has reached the 1 fib. And that is the point where we got out of the trade with all of our investment. In this trade we got out of the trade a bit earlier. We received the sell signals and got a reversal on the Overbought/Oversold + Divergence Indicator.
We are hoping you learned something so you can make better decisions when to get into or out of a trade.
If you have any question just drop it into the comments below.
FEATURES:
• You can show/hide the RSI .
• You can show/hide the MA.
• You can show/hide the lRSIMA cloud.
• You can show/hide the Stoch RSI cloud.
• You can show/hide and adjust the Overbought and Oversold zones.
• You can show/hide and adjust the Overbought Extended and Oversold Extended zones.
• You can show/hide the Overbought and Oversold highlighted zones.
• Etc...
HOW TO GET ACCESS TO THE SCRIPT:
• Favorite the script and add it to your chart.
REMARKS:
• This advice is NOT financial advice.
• We do not provide personal investment advice and we are not a qualified licensed investment advisor.
• All information found here, including any ideas, opinions, views, predictions, forecasts, commentaries, suggestions, or stock picks, expressed or implied herein, are for informational, entertainment or educational purposes only and should not be construed as personal investment advice.
• We will not and cannot be held liable for any actions you take as a result of anything you read here.
• We only provide this information to help you make a better decision.
• While the information provided is believed to be accurate, it may include errors or inaccuracies.
Good Luck and have fun,
The CryptoSignalScanner Team
النماذج الشرائية

The Ganesh TrendThe Ganesh Trend is an indicator developed by Ganesh to help Traders to identify potential trend showing candle .This indicator identifies bullish and bearish candle with some specific rules. This gives fair idea of direction of market .It is very helpful if you use it on Nifty 50 index . Candlestick developed by me is my original work . It is very helpful for new traders looking for proper entry and exit . It has stop loss and target as well . red dot shows the stop loss and green dot shows the target . taking 2-3 trades a day is good . Thank You . NSE:NIFTY

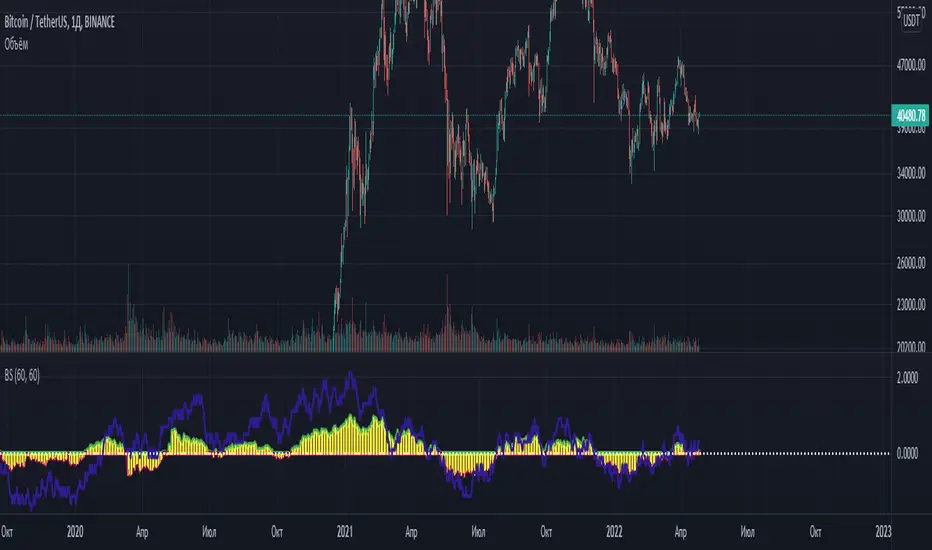
Quantum CDV HistogramThis script is an addition to Fixed Quantum Cdv.
It shows vector cdv ratio in columns.
You can select the length as an input to how many bars to look back for the whole calculation.
The green bars represent the bullish values and the red bars the bearish values.
The green line represents an ema of the bullish value and the red line the ema of the bearish value.
The momentum ema (in purple) represent the cdv ratio (bullish - bearish).
When the momentum ema is at 100% or more it’s a good sell opportunity and when the momentum ema is at or under 100% it’s a good buy opportunity. It is not financial advise. Make sure to make your own analysis. This script help to make entries, but do not enter positions only based on this signal.
In the inputs you can select the emas that you want to display on your histogram.
The original script is the Cumulative Delta Volume by LonesomeTheBlue.

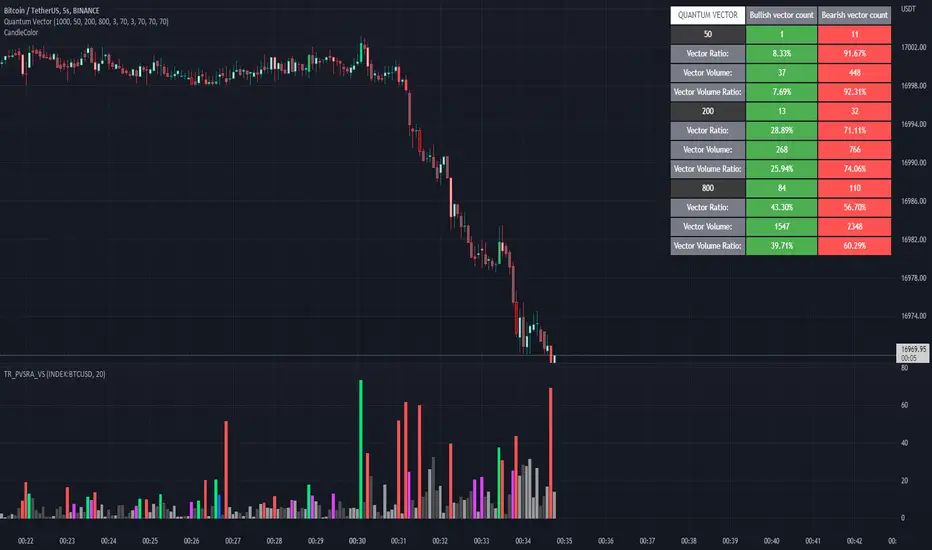
Quantum Vector AlertsIts the part 2 of Multiple Indicators 50EMA Cross Alerts.
Its more suitable for the seconds chart. Beside, you can use it in higher timeframe.
The input bars length is the sample size that the code will use to trigger all alert. 20 mean 20 bar after the current candle.
When you activate volume alert you can select an amount of volume that when volume cross it you will be notified. The volume of every bar is displayed in the screener below volume.
In the section percentage vector counting the script do the sum of the red vector and green vector and give a ratio. In bullish vector count percentage for alert, you can select the percentage difference that you want to receive an alert. If your sample have 3 red vectors and 7 green vectors you will receive an alert saying that there is an imbalance of 70% showing more green vectors.
You can select a variant of percentage vector. The variant will do a summation of volume. If 1 vector candle is the size of the 3 other vector, they will have the same ponderation.
Normal alert counting count the number of vectors in the bars length. You can count the red and green candle only or add the blue and violet.
Bullish vector count will show a notification when the number of green candle will appear on the chart in the selected length. The same process is valid for bearish vector count. For example, if you want 3 bullish candle in 20 bar. You select bars length 20 and bullish vector count 3.
These alerts are suitable to the hybrid system. Thanks to our teacher Trader Reality and to all the member that contribute to this great discord community.
Cheat Code's RedemptionWELCOME TO THE CHEAT CODE REDEMPTION PACK!!!!
I want to take a deep dive into what this indicator consists of and how you can use it to improve your trading strategy.
-What does the CCR consist of?
The Oscillator:
The oscillator is a combination of a true strength index sampled from on-balance volume and a regular RSI at default settings. The reason I added the on-balance volume is that it does not tend to remain at overbought or oversold conditions as traditional momentum oscillators do.
The Histogram:
The histogram is copied to a tee from the MACD histogram, the only difference here is that I extended the moving averages to depict a special pairing; the ema55 slow and ema21 fast. I then converted it into another true strength index, as the calculations fit all time frames.
The Divergences:
The divergences of an indicator can be extremely useful in catching scalp opportunities, a DARK RED/GREEN represents a REGULAR divergence, while a SALMON/LIGHT GREEN color represents a HIDDEN divergence.
The moving average:
The moving average built into this indicator is depicted as an aqua or yellow line, when the oscillator is moving in an uptrend, the moving average will appear aqua, when the oscillator is in a downtrend it will appear yellow. Use this as confirmation bias or as the third derivative of market position.
Oscillator Colors:
The Oscillator color is an important thesis of this indicator. When the line is green, it means the market is effectively in an uptrend, when it is red, it means the market is in a downtrend. Use this to prevent longing in a serious downtrend and vice versa.
If you have any questions regarding the indicator(s), feel free to reach out to me in the comments or through Direct Message!!!
Safe Trading, Don't get Rekt
- CheatCode1 <3

Breakout Candles + RSIHello!
This is my firt script :)
This indicator looks for candles that are significantly larger than the previous X candle.
It is possible to set the following:
Multiplier: deviation from the size of the previous X candle (if set to 3 the size of the actual candle's body /abs(open - close)/ must be larger than the size of the bigger candle from the prevous X candles)
Previous candles: the number of previous candles to size check
Upper RSI limit: if the RSI14 close higher than the specified number, the candle will ignore
Lower RSI limit: if the RSI14 close lower than the specified number, the candle will ignore
Without dojis: if checked, watches candles only that do not have a bottom spike (bullish) or top spike (bearish). Useful for Heikin-Ashi candles
Feel free to left any suggestion!
Thank You!

Bull/Bear Candle % Oscillator█ OVERVIEW
This script determines the proportion of bullish and bearish candles in a given sample size. It will produce an oscillator that fluctuates between 100 and -100, where values > 0 indicate more bullish candles in the sample and values < 0 indicate more bearish candles in the sample. Data produced by this oscillator is normalized around the 50% value, meaning that an even 50/50 split between bullish and bearish candles makes this oscillator produce 0; this oscillator indirectly represents the percent proportion of bullish and bearish candles in the sample (see HOW TO USE/INTERPRETATION OF DATA ).
It has two overarching settings: 'classic' and 'range'.
█ CONCEPTS
This script will cover concepts related to candlestick analysis, volumetric analysis, and lower timeframes.
Candlestick Analysis - The idea behind this script is to solely look at the candlesticks themselves and derive information from them in a given sample. It separates candles into two categories, bullish (close > open) and bearish (close < open).
If the indicator's setting is set to 'classic', the size of candles do not matter and all are assigned a value of 1 or 0.
If the indicator's setting is set to 'range', specific candle ranges modify the proportion of bullish/bearish values. Bullish candle values include all bullish candles in the set from their lows to the close, plus the lower wicks of all bearish candles. Bearish candle values include all bearish candles in the set from their highs to the close, plus the upper wicks of all bullish candles.
Volumetric Analysis - One of this script's features allows the user to modify the bullish and bearish candle proportions by its 'weight' determined by its volume compared to the sample set's total volume. Volumetric analysis for the 'range' setting are more complex than 'classic' as described below.
Lower Timeframes - For volumetric analysis to be done on candle wicks, there needed to be a way to determine how much volume had occurred in the wick by itself to find the weight of upper and lower wicks. To accomplish this, I employed PineScrypt's request.security_lower_tf function to grab OHLC values of lower timeframe candles (as well as volume) to determine how much volume had occurred in the wicks of the chart resolution's candle. The default OHLC values used here are the lows for upper wicks and highs for lower wicks. These OHLC values are then compared to the chart resolution candle's close to determine if the volume of that lower timeframe candle should be shifted to the wick weight or stay in the current weight of that candle. The reason 'low' and 'high' are used here is to guarantee that 100% of the volume of a lower timeframe candle had occurred in the wick of the candle at the current resolution (see LIMITATIONS ).
Bullish candles will exclude volume of all lower timeframe candles whose lows were greater than that candle's close. Bearish candles will exclude volume of all lower timeframe candles whose highs were less than that candle's close. These wick volumes are then divided by the volume of the sample set, and wick sizes are then multiplied by this weight before being added to their specific bullish/bearish sums (lower wicks to bullish and upper wicks to bearish).
█ FEATURES
There are 13 inputs for the user to modify the behavior/visual representation of this script.
Sample Length - This determines how many candles are in the sample set to find the proportion of bullish and bearish candles.
Colors and Invert Colors - There are three colors set by the user: a bullish color, neutral color, and bearish color. The oscillator plots two lines, one at 0 and another that represents the proportion of bullish or bearish candles in the sample set (we'll call this the 'signal line'). If the oscillator is above 0, bullish color is used, bearish otherwise. This script generates a gradient to color a filled area between the 0 line and the signal line based on the historical values of the oscillator itself and the signal line. For bullish values, the closer the signal line is to the max (or restricted max described below) that the oscillator has experienced, the more colored toward bullish color the shaded area will be, using the neutral color as a starting point. The same is applied to the bearish values using the bearish color.
There is an additional input to invert the colors so that the bearish color is associated with bullish values and vise-versa.
Calculation Type - This determines the overarching behavior of the oscillator and has two settings:
Classic - The weight of candles are either 1 if they occurred and 0 if not.
Range - The weight of candles is determined by the size of specific sections as described in CONCEPTS - Candlestick Analysis .
Volume Weighted - This enables modifying the weights of candles as described in CONCEPTS - Volumetric Analysis and Lower Timeframes based on which Calculation Type is used.
Wick Slice Resolution - This is the lower timeframe resolution that will be used to slice the chart resolution's candle when determining the volumetric weight of wicks. Lower timeframe resolutions like '1 minute' will yield more precise results as they will give more data points to go off of (see LIMITATIONS ).
Upper/Lower Wick Source - These two inputs allow the user to select which OHLC values to compare against the chart resolution's candle close when determining which lower timeframe candles will have their volumes associated with the wicks of candles being analyzed at the chart's resolution.
Restrict Min/Max Data and Restriction - This will restrict the maximum and minimum values that will be used for the signal line when comparing its value to previous oscillator values and change how the color gradient is generated for the indicator. Restriction is the number of candles back that will determine these maximum and minimum values.
Display Min/Max Guide - This will plot two lines that are colored the corresponding bullish and bearish colors which follow what the maximum and minimum values are currently for the oscillator.
█ HOW TO USE/INTERPRETATION OF DATA
As mentioned in the OVERVIEW section, this oscillator provides an indirect representation of the percent proportion of bullish or bearish candles in a given sample. If the oscillator reads 80, this does not mean that 80% of all candles in the sample were bullish . To find the percentage of candles that were bullish or bearish, the user needs to perform the following:
50% + ((|oscillator value| / 100) * 50)%
If the oscillator value is negative, the value from above will represent the percentage of bearish candles in the sample. If it is positive, this value represents the percentage of bullish candles in the sample.
Example 1 (oscillator value = 80):
50% + ((|80| / 100) * 50)%
50% + ((0.80) * 50)%
50% + 40% = 90%
90% of the candles in the sample were bullish.
Example 2 (oscillator value = -43):
50% + ((|-43| / 100) * 50)%
50% + ((0.43) * 50)%
50% + 21.5% = 71.5%
71.5% of the candles in the sample were bearish.
An example use of this indicator would be to put in a 'buy' order when its value shows a significant proportion of the sampled candles were bearish, and put in a 'sell' order when a significant proportion of candles were bullish. Potential divergences of this oscillator may also be used to plan trades accordingly such as bearish divergence - price continues higher as the oscillator decreases in value and vise-versa.*
* Nothing in this script constitutes any form of financial advice. The user is solely responsible for their trading decisions and I will not be held liable for any losses or gains incurred with the use of this script. Please proceed with caution when using this script to assist with trading decisions.
█ LIMITATIONS
Range Volumetric Weights :
Because of the conditions that must be met in order for volume to be considered part of wicks, it is possible that the default settings and their intended reasoning will not produce reliable results. If all lower timeframe candles have highs or lows that are within the body of the candle at the chart's resolution, the volume for the wicks will effectively be 0, which is not an accurate representation of those wicks. This is one of the reasons why I included the ability to change the source values used for these conditions as certain OHLC values may produce more reliable/intended results under these conditions.
Wick Slice Resolution :
PineScript restricts the number of intrabar references to 100,000 total. This script uses 3 separate request.security_lower_tf calls and has a default resolution of 1 minute. This means that if the user were to set the oscillator to the Range setting, enable volume weighted, and had the Wick Slice Resolution set to 1 minute, this script will exceed this 100,000 reference restriction within 24 days of data and will not produce any results beyond the previous 23.14 days.
Below are example uses of all the different settings of this script, these are done on the 1D chart of COINBASE:BTCUSD :
Default Settings:
Classic - Volume Weighted:
Range - no Volume Weight:
Range - Volume Weighted (1 min slices):
Range - Volume Weighted (1 hour slices):
Display Min/Max Guide - No Restriction:
Display Min/Max Guide - Restriction:
Invert Colors:

ATR Trailing Stop Loss [V5]A complete ATR Trailing Stop Loss in version 5.
Features Include:
Timeframe Option
Long/Short Triggers (Green/Red Triangles)
Long/Short Conditions (Bottom Colored Line)
"Golden" Long/Short Triggers (Yellow Triangles)(Hanging Man or Shooting Star Candlestick patterns breaking ATR trailing stop)
Alerts

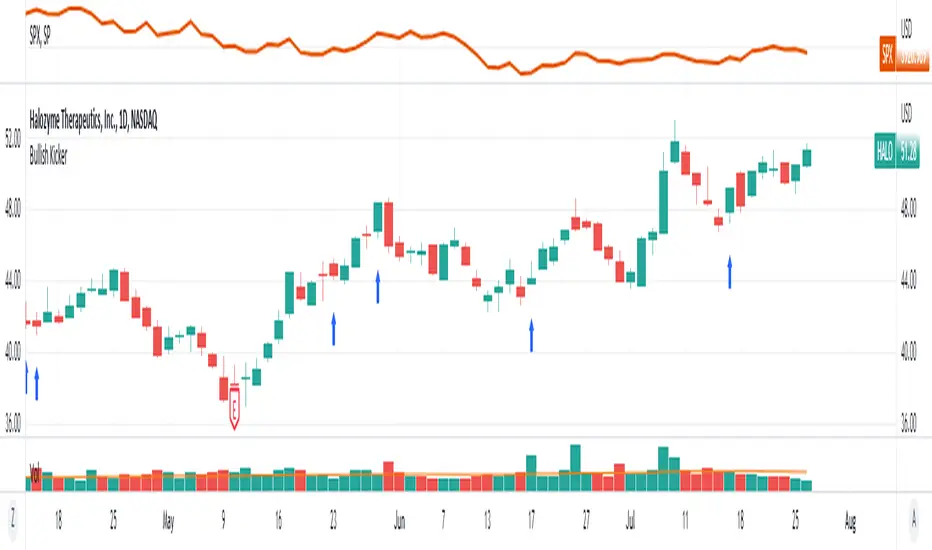
Bullish KickerIdentify bullish kicker candles on the chart. A bullish kicker candle occurs when the opening price is above the body of the previous candle. The previous candle must close lower than the open to qualify.
Indicator Settings
You can chose which shape and color to plot when a kicker candle occurs, as well as placement above, below or in a separate pane.
Bullish Kickers are indicated by blue arrows on the chart
Current price & Daily openFor those who likes clean chart:
I made a simple script that shows Current price based on the last candle color.
Also can show Daily open line based on the daily candle color.
Daily open line is same as strong support and resistance levels.
Mostly price shows strong responces on daily open line.
1: Daily open line color is blue if current price is above the daily open line.
And daily open line is red if current price is below the daily open line.
This means blue daily open line represents bullish daily candle and red daily open line represents bearish daily candle.
Simply you can expect Buy setup on the daily open line if it is blue and vice versa. That means you are following the daily trend, nothing else.
Always double confirm with your own trading style. It's not guaranteed.
You can use this script when you want to see daily price action or to find daily high lows.
This script helps to identify the following day high and lows too on the lower timeframe.
2: When you add drawing tools on your chart price labels are overlapping or if you choose not overlap then price moves up or down so you are not able to see current price easily.
This script helps to show current price on the last candle. You can easily see the current price.
Current price color is blue when last candle is bullish and it's red when last candle is bearish .
It always calculates last candle. So it could be weekly or 1 minute candle, whatever timeframe you working on.
Thank you.

Dante Bullish/Bearish EngulfingBearish and Bullish engulfings as taught by Tom Dante Piccin. Different from other bullish/bearish engulfing indicators because other indicators only want the body of the current candle to engulf the previous body.
This indicator needs the low and high of the current candle to engulf the previous one and also in the example of a bullish engulfing close above the previous candle high or in a bearish engulfing example close below the low of the previous candle.

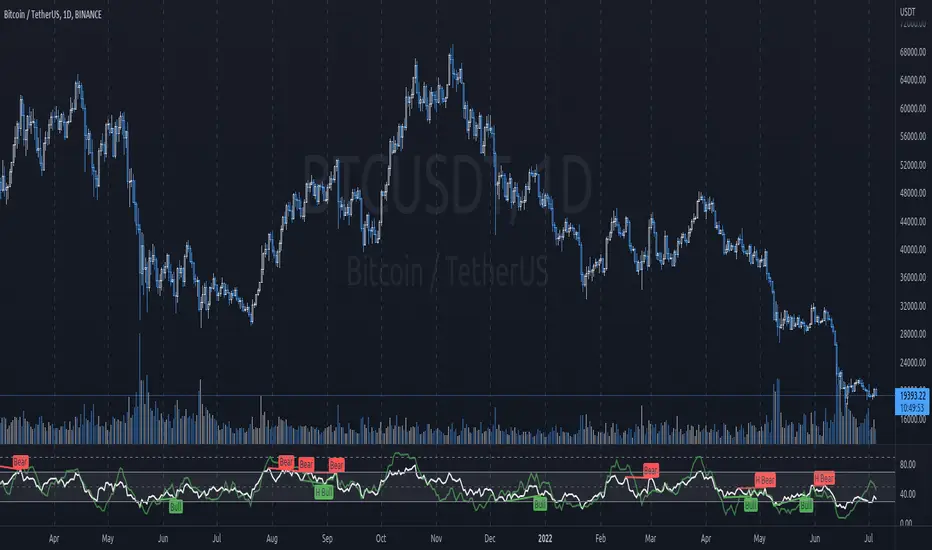
JG RSI/MFI/divergence IndicatorThis is a combination of
- RSI (relative strength index)
- MFI (money flow index)
- Divergences on the RSI
MFI behaves much the same as RSI but it more responsive/to some degree a leading indicator. I find it helps having this overlayed with RSI to help gauge price action and sentiment, as well as for confluence with RSI.
MACD Multiple AlertsThis script help traders to catch bullish and bearish momentum. It creates an alert for 40 altcoins based on the MACD cross over and cross under.
The MACD input are adjustable in the settings and you can choose your favorite assets.
Simply add this indicator to the chart wait that if finish to load and then create an alert on the time frame of your choice.
Enjoy your trading
F_rank_01

LOKEN (v4) BULLISH SMART MONEYThis indicator is based on Smart Money MCDX
(Pine editor @v4)
Indicator built for cryptocurrencies.
Best for day trading.
The coin seems overbought but still pump? Check this indicator
This indicator help you see when institutional buyer enter/exit trade and is a good combination with RSI + Stochastic RSI .
This indicator focus on buying activity by big players and is built for LONG or SPOT, shorter can still use it to determine when to exit short (if smart money appear on a significant TF you may not enter/stay in a short).
Banker plot show strong buyer activities (appear generally when RSI already overbought but still increasing).
It appear as a Histogram with a color code to better see the fading strength of the institutional activity :
Light Blue Bar = Institutional presence ( bullish )
Green Bar = Pump candle (very bullish ), (Banker > Banker MA)
Orange Bar = Retest candle = natural decline after a growth (Banker < Banker MA)
Black Bar = Down candle = progressive exit of institutional leads to this candle, you must have TP before.
Red Bar = Dump candle = steep decline, the institutional take profit hard. You better be out before that one.
Hot-Money plot show momentum and react fast to price action.
It appear as a filled zone (red or green) depending on the plot position compared to its average.
In a downtrend you may only see this one.
Key-Signals:
"Bullish signal 𓃓" = open a long
"Sell signal 💲" = close the long
I recommend you don't keep all the signals enabled at first.
(feel free to ask me the use of the other signals)
It seemed to me that SMART MONEY MCDX was counter-intuitive and archaic,
So i made this one for personal use,
I'm happy if this indicator helps you,
Have a good trade

AMACD - All Moving Average Convergence DivergenceThis indicator displays the Moving Average Convergane and Divergence ( MACD ) of individually configured Fast, Slow and Signal Moving Averages. Buy and sell alerts can be set based on moving average crossovers, consecutive convergence/divergence of the moving averages, and directional changes in the histogram moving averages.
The Fast, Slow and Signal Moving Averages can be set to:
Exponential Moving Average ( EMA )
Volume-Weighted Moving Average ( VWMA )
Simple Moving Average ( SMA )
Weighted Moving Average ( WMA )
Hull Moving Average ( HMA )
Exponentially Weighted Moving Average (RMA) ( SMMA )
Symmetrically Weighted Moving Average ( SWMA )
Arnaud Legoux Moving Average ( ALMA )
Double EMA ( DEMA )
Double SMA (DSMA)
Double WMA (DWMA)
Double RMA ( DRMA )
Triple EMA ( TEMA )
Triple SMA (TSMA)
Triple WMA (TWMA)
Triple RMA (TRMA)
Linear regression curve Moving Average ( LSMA )
Variable Index Dynamic Average ( VIDYA )
Fractal Adaptive Moving Average ( FRAMA )
If you have a strategy that can buy based on External Indicators use 'Backtest Signal' which returns a 1 for a Buy and a 2 for a sell.
'Backtest Signal' is plotted to display.none, so change the Style Settings for the chart if you need to see it for testing.

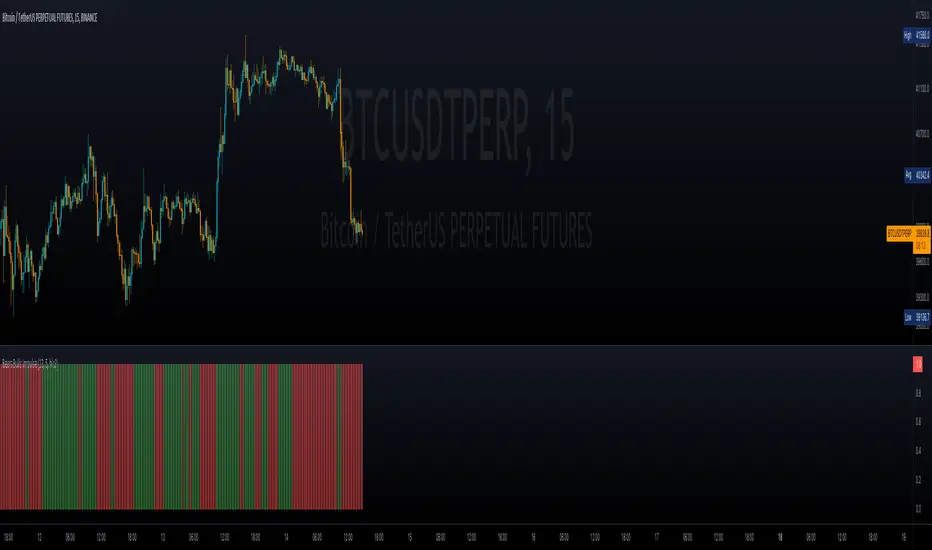
Bears Bulls Impulse█ OVERVIEW
Maybe another version of the Bears Bulls indicator, but with a unique interpretation on the scripts found here on Tradingview. Again, this indicator is not meant to be used alone but as an entry/exit confirmation with other indicators.
█ CONCEPTS
Using a modified version of the WMA indicator, the LWMA , this indicator will work similarly to the Bears Bulls Power indicator. Quoting from Admiral Markets, "Bulls Power measures the capability of buyers in the market to lift prices above an average consensus of value. Bears Power measures the capability of sellers to drag prices below an average consensus of value. Using them in tandem with a trend measure allows you to identify favorable entry points."
█ HOW TO USE IT
As soon as the color changes, it indicates a change in the price direction and divergences. Green buy, red sell? Not that simple, but following that pattern for scalping may result in some good entries. Following this indicator blindly will not be accurate as using another indicator to filter the signals in favor of a major trend (that indicator could be another Bears Bulls Inpulse from a higher time frame)
Botvenko ScriptI just test&learn pine script...
Damn, what should I write here? So... Its just a differense between the logarithms of two prices of different periods (You can set the period you want)... And it looks really nice... Ahem...
I hope, you enjoy this piece of... Have a nice day, my dear.
Lankou VS BTC all
/!\ To make it work well use -> pin at new right scale
This script displays the comparison with BTCUSDT
it permits to see if an asset is gaining value against BTC, and fastly scan USDT asset to determine if they are bullish
It works for ANY asset, as it's dividing it's price by the BTCUSDT one

Bias Pivot PointA simple indicator that uses Pivot Points as a filter and to generate a Directional Bias .
How to use this indicator?
1. Directional Bias
Bullish => Closing Price > Pivot Point
Bearish => Closing Price < Pivot Point
2. Support / Resistance
Each Pivot Points can be used as Support or Resistance
3. Take Profit Targets
Each Pivot Points can be used as targets for taking profit

Naked Bar Upward ReversalAMEX:SPY
The Naked Bar Upward Reversal is a three bar candlestick pattern with an inside candle as a entry point. This pattern is bullish since it has a candle closing red from the previous candle; the most bearish pattern possible. The following inside candle is a reversal of its previous candle with an open above the previous candle's close. Look to buy the next open above the inside candle's close.
This is a bullish reversal pattern and should be used in this context. Successful entries are found in corrections along an upward trend, or buying into a dip. Performance drops when the pattern appears at tops. To improve profitability, use a cluster of evidence to enhance the performance of this pattern. The intended time frame is within the daily and weekly.

K's EnvelopesTrading is all about finding reactionary levels from where we assume prices will take a certain direction. And from that assumption, we initiate either a long (Buy) position or a short (Sell) position. Many techniques can be used to find support and resistance levels such as pivot points, Fibonacci retracements, and graphical levels. However, these techniques are all static in time, i.e. they do not move with real time data. In contrast, moving averages are dynamic and do a great job at finding support and resistance levels.
The idea of K's Envelopes is to form support and resistance zones so that we find good entry points. It is a combination of two 800-period moving averages where one is applied to the highs and the other applied to the lows, thus forming a moving zone used to support or place a ceiling on the market price.

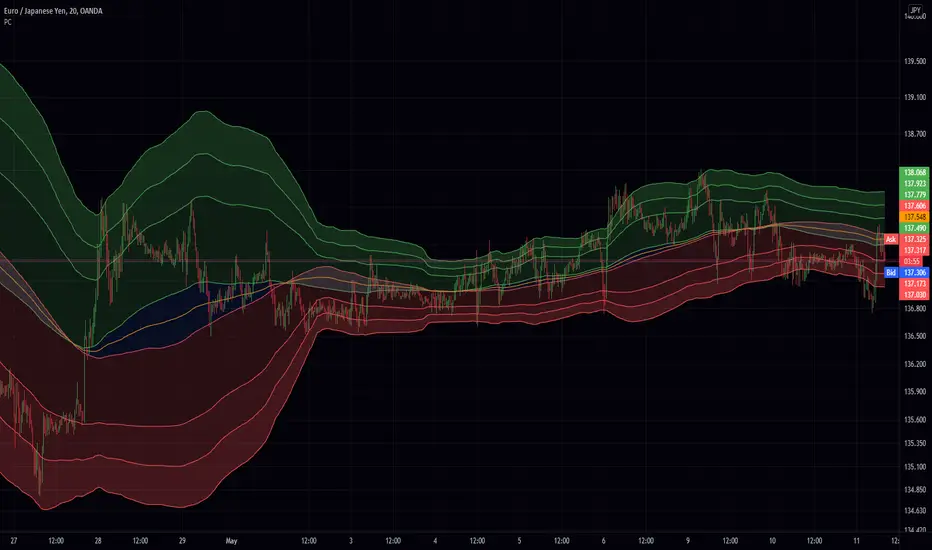
Price Clouds (PS)Price could shows you dynamic support resistance levels. It also displays two bands (ie clouds) that show you where the trend is. If the price hits the bottom of the high band thats a buy and if it hits the top of the high band its a sell. During times of volatility the price can break support but you will find that the opposite band will work as the next level. I added tool tips for every option to help explain what everything does and I also left suggestions for other settings.
This works great on everything! That being said I have this setup in a general way that works really well for 20m forex. If you are scalping you might want to speed up the indicator. This is also true if you want go to the daily chart or above. Adjust the Stdev to match the market.. and I mean really play around with.. dont be shy! With all that out of the way this really will work out of the box. If you like this indicator its actually the same thing as my (PBS) but this one is an overlay on the chart. (Also as of publishing this script the code for this version is way cleaner. In fact I plan on replacing PBS with this as its base)
If you find this indicator is useful to you, Star it, Follow, Donate, Like and Share.
Your support is a highly motivation for me.
4x Stochastic Dingue4 Stochastic indicator into 1.
Different lengths produce short-term and long-term indicators that can help with finding the trend and impulses within the trend.
It can also find reversal points when all 4 are at the extreme at the same time. Ex. All 4 Stoch are above 90 or under 10 !! This could signal a bottom or top is soon to happen. (This is not always true as it depends on many factors.)
Many visual options make it even more customizable. Fill between Stoch, background colors, Crosses.
Divergences are not always accurate, depending on settings and timeframe, but they can be useful in certain situations.
---------------------
In closing, no indicator can give perfect signals, you need to use them in conjunction with other information to make better decisions.
I hope you like my indicators and that they help your trading.
If you have any questions please ask.
Thank you.
