Bitcoin Bull Runs Mid Cycle Aligned This script plots 2 lines which are the 2013 and 2016 bull run. The plots are aligned on their mid cycles to the 2021 mid cycle.
Settings:
You can move the plots on the x and y axis in the settings for the Daily, Weekly and Monthly TFs.
The plot is weird on the Monthly TF, best to use the Daily and Weekly.
If it doesn't load at first you have to zoom out fully and go back to 2013 for it to load. Then it will load.
النماذج الشرائية

Harmonic Pattern Educational Volume 0 (Source Code)This indicator was intended as educational purpose only for Harmonic Patterns using XABCD Pattern Tool.
Gartley and Butterfly patterns were ideal patterns explained from The Harmonic Trader written by Scott M Carney.
Some values are further updated later in Harmonic Trading: Volume Three, also by Scott M Carney.
The Harmonic Trader book was also known as Harmonic Trading: Volume Zero.
Usually Bullish Patterns show as "M" shape while Bearish Patterns show as "W" shape.
";" indicates range, example : 1.27;1.618 meaning that value between 1.27 to 1.618.
Indikator ini bertujuan sebagai pendidikan sahaja untuk Harmonic Pattern menggunakan XABCD Pattern Tool.
Pattern Gartley dan Butterfly, juga sebagai pattern ideal telah diterangkan dari buku The Harmonic Trader ditulis oleh Scott M Carney.
Beberapa nilai kemudiannya telah dikemaskini dalam Harmonic Trading: Volume Three, juga oleh Scott M Carney.
Buku The Harmonic Trader book juga dikenali sebagai Harmonic Trading: Volume Zero.
Kebiasaanya Bullish Pattern tunjuk sebagai bentuk "M" manakala Bearish Pattern tunjuk sebagai bentuk "W".
";" menunjukkan range, contoh : 1.27;1.618 bermaksud nilai 1.27 hingga 1.618.
Indicator features :
1. List XAB=CD patterns including ratio and reference page.
2. For desktop display only, not for mobile.
Kemampuan indikator :
1. Senarai XAB=CD pattern termasuk ratio and rujukan muka surat.
2. Untuk paparan desktop sahaja, bukan untuk mobile.
FAQ
1. Credits / Kredit
Scott M Carney, The Harmonic Trader
2. Pattern and Chapter involved / Pattern dan Bab terlibat
Bullish Ideal Gartley - Page 160
Bearish Ideal Gartley - Page 171
Bullish Ideal Butterfly - Page 194
Bearish Ideal Butterfly - Page 204
3. Code Usage / Penggunaan Kod
Free to use for personal usage but credits are most welcomed especially for credits to Scott M Carney.
Bebas untuk kegunaan peribadi tetapi kredit adalah amat dialu-alukan terutamanya kredit kepada Scott M Carney.
Bullish (M) / Bearish (W) Ideal Gartley
Bullish (M) / Bearish (W) Ideal Butterfly

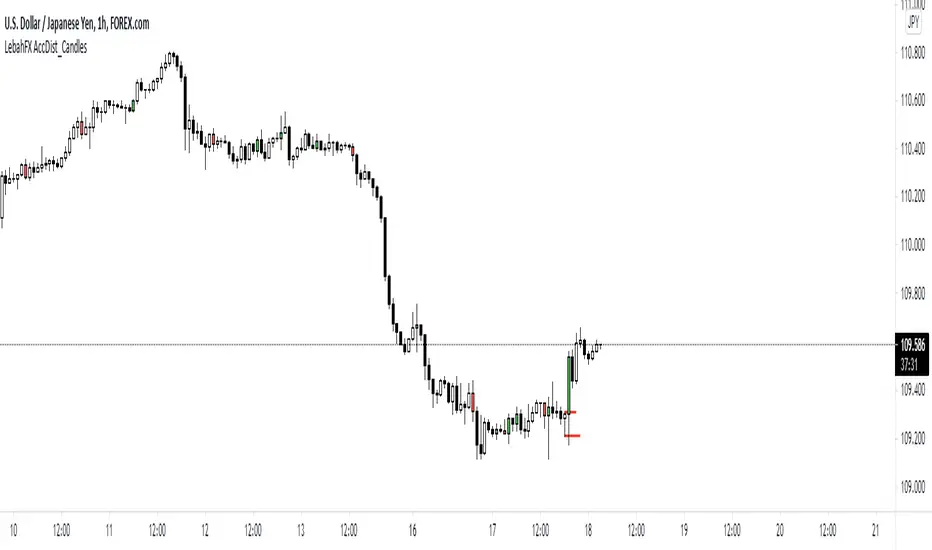
LebahFX AccDist_CandlesLebahFX Indicator that showing Accumulation and Distribution Signal in HTF Candlestick
Percentage Oscillator SwingThe percentage price oscillator (PPO) is a technical momentum indicator.
It shows the relationship between the close of a candle and the highest/lowest point with a specific lenght in percentage terms.
Rules
The higher percentage on the values upwards, compared to those downwards, the higher the power of the bull trend.
The higher percentage on the values downwards, compared to those upwards, the higher the power of the bear trend.

Bull and Bear Marubozus Candlestick PatternMarubozus are an interesting candle pattern wherein the close and open of the candle are also the high / low points of the candle. In other words, a candle with no shadows or wicks.
How reliable are they, though? Probably not very reliable on their own. It may also depend on the size of the candle. You would probably want to incorporate this candle pattern with other filters, like RSI, MACD, to filter trade opportunities.

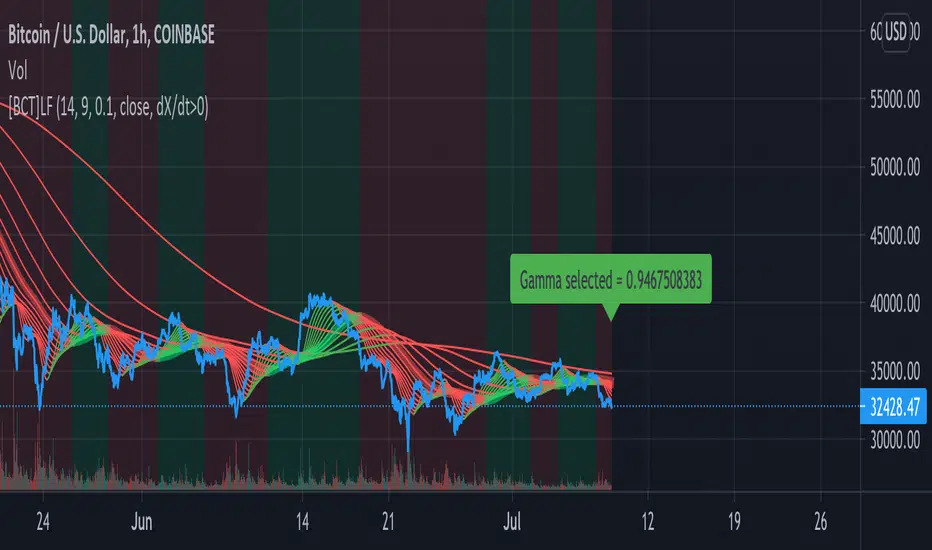
[BCT] Identify BULL / BEAR regimes - Laguerre FilterThe Adaptive Laguerre is based on the Laguerre filter, described by John Ehlers in his paper “Time Warp – Without Space Travel”
forex-station.com
MAs obtained using a Laguerre filter tend to have much lower lag than MAs obtained from an SMA or EMA.
Use cases:
- Identify market regime (BULL vs BEAR)
- Smooth out a noisy signal (e.g. apply to RSI, prices, log returns, variance, etc) without adding excessive lag
Highlight based on:
- Smoothed indicator > or < 0
- Derivative of the indicator ("speed") > or < 0
- Second derivative of the indicator ("acceleration" or "momentum") > or < 0
BTC > bull market supportPlots the natural log of the price divided by the 20w SMA and 21w EMA, color coded by the Bitcoin price (green if above, red if below). Use this when comparing Altcoins to Bitcoin's performance. Works in daily & weekly timeframes only!

CM_Twiggs Money FlowFull Credit goes to LazyBear for publishing Original Code.
I added:
Threshold lines that changes the color of Histogram based on if it exceeds Threshold lines. Ability to turn off and on.
Ability to Turn Histogram Off/On
Ability to turn Twiggs Money Flow Line Off/On


KINSKI ADXThis ADX indicator (Average Directional Index) tries to estimate the strength of a trend. The Average Directional Index is derived from the positive (+DI) and the negative directional indicator (-DI). The direction of movement is determined by comparing the highs and lows of the current and past periods.
As soon as the indicator determines a trend strength for upward or downward trend, a label is displayed. An upward trend is labelled "Bullish Trend". The downward trend bears the label "Bearish Trend".
The clouds in the background represent the movements of the Average Directional Index High/Low:
Color orange: neutral, uncertain in which direction it is going.
Color green: upward trend
Color red: downward trend
The line represents the average value of the ADX signal:
Color orange: neutral: still uncertain in which direction it is going
Color green / outgoing line: upward trend
Color green / descending line: weakening upward trend
Color red / exiting line: downward trend
Color red / descending line: weakening downward trend
The following configurable options are possible:
"ADX Smoothing
Directional Index Length
Level Range
Level Trend

Bulls and BearsIntroduction to the Bulls and Bears Indicator
HAVE YOU EVER WANTED TO SEE VISUALLY WHO IS IN CONTROL, THE BULLS OR BEARS?
This indicator aspires to make it much easier for the trader to read the market in a clear and concise manner.
This is an easy to use Bulls and Bears indicator that works very simply:
If the closing price is greater than the 20, 50 or 200 moving average it indicates with a '+'.
If the closing price is less than the 20, 50 or 200 moving average it indicates with a '-'.
There are also some additional indicators that if all three above are flagged, then a 'B' symbol appears below the candle, to indicate it a highly Bullish.
If all three closing prices are below all of the moving averages a 'B' symbol appears above the candle to indicate high Bearish pressure.

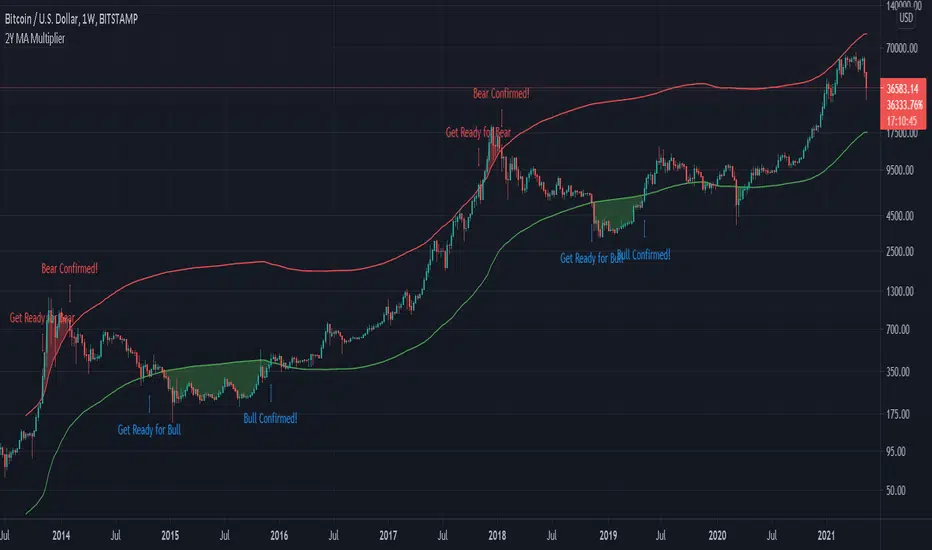
Bitcoin 2-Year MA Multiplier by GodtrixHi guys, I found this tool very useful and accurate, but can't find it on Trading View, so I made one for myself and everyone here ;)
Alert is available too.
Indicator Overview
The 2-Year MA Multiplier is intended to be used as a long term investment tool.
It highlights periods where buying or selling Bitcoin during those times would have produced outsized returns.
To do this, it uses a moving average (MA) line, the 2yr MA, and also a multiplication of that moving average line, 2yr MA x5.
Note: the x5 multiplication is of the price values of the 2yr moving average, not of its time period.
Buying Bitcoin when price drops below the 2yr MA (green line) has historically generated outsized returns. Selling Bitcoin when price goes above the 2yr MA x 5 (red line) has been historically effective for taking profit.
Why This Happens
As Bitcoin is adopted, it moves through market cycles. These are created by periods where market participants are over-excited causing the price to over-extend, and periods where they are overly pessimistic where the price over-contracts. Identifying and understanding these periods can be beneficial to the long term investor.
This tool is a simple and effective way to highlight those periods.
Credit to & Created By
Philip Swift
Date Created
July 2017
BITSTAMP:BTCUSD

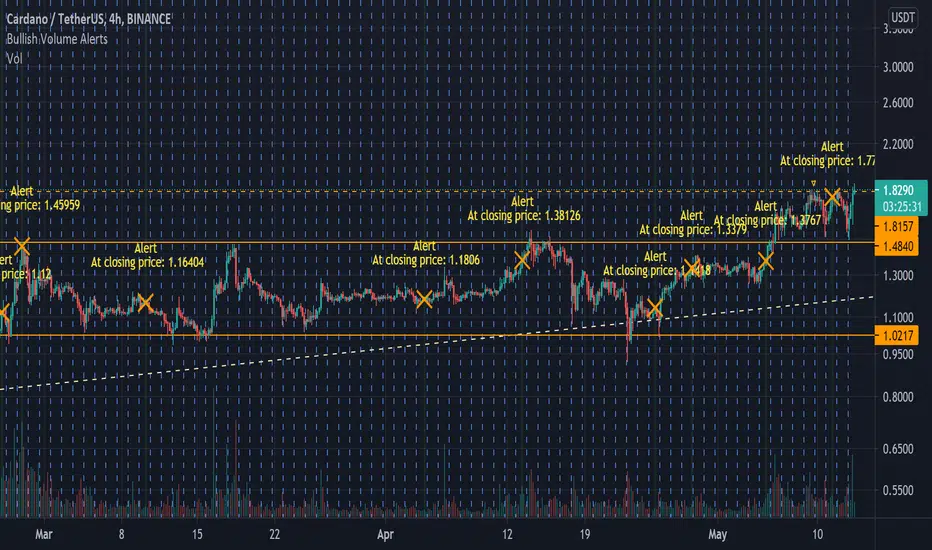
Bullish Volume [Alerts]A really simple script I made for someone, but also noticed I couldn't find anything like it that's as quick or simple (I may just be dumb)
Simply labels out and alerts you when three consequently higher volume bars appear, pretty useless on its own but for crypto, it works great to quickly notice if some important fundamentals suddenly cause the price to rocket. It works best with hour timeframes. Personally I'd use it with 4h.
I find it useful to know if something in a market is stirring attention and hope others can find it useful.
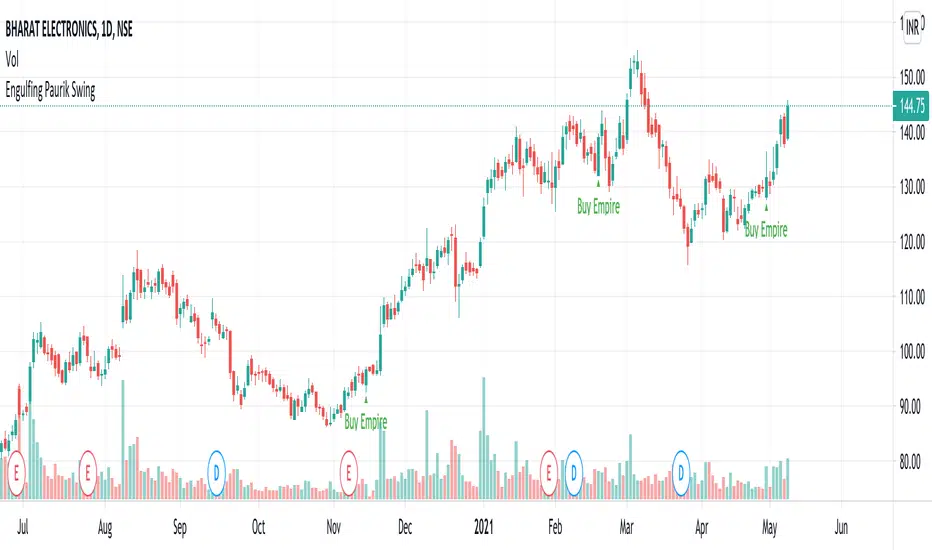
Engulfing Empire at over Sold Over <50 Bought >50Shows bulling engulfing patterns only if above >50 rsi and Shows Bearish engulfing patterns only if above <50 rsi
. Very simple.
Indicator Conditions RSI above 50 overbought/below 50 oversold, price is above/below)
Entry Reasons (eg. a bullish or bearish engulfing candle)
Bear & Bull Zone Trend AlertsThis script was requested based on what I previously had in my other scripts.
I did do some tweaks based on some assumptions of what I think it will be used for.

Angle Attack Follow Line Indicator This indicator works with Follow Line Indicator , evaluates the angle for possible additions or reductions of the position. Many settings to play with:
s3.tradingview.com
- FOLLOW LINE CURRENT CHART RESOLUTION
- FOLLOW LINE HIGHER TIME FRAME
- FILTER HIGHER TIME FRAME
- NO FILTER HIGHER TIME FRAME
- ANGLE CONFIGURATION
- ANGLE LEVELS
- BUY / SELL
- OPTIONS TO ADD
- OPTIONS TO REDUCE
- BAR COLOR
- LABELS
-ALERTS
MANAGE YOUR RISK AND CAPITAL WELL IF YOU DO NOT WANT TO LOSE EVERYTHING¡¡¡
TO PLAY¡¡¡

Percentile Rank Market FilterA simple script to filter bull and bear markets by using percentile rank filter. Using market regimes to filter by bull/bear/sideways markets helps to understand how your strategy will
behave in various market regimes and allows you to avoid unprofitable regimes and only trade in profitable ones.
The idea of market regime filtering is used in the most successful technical algorithmic trading strategies, as one should always design a trading strategy with a particular market in mind according to trading legend, Larry Connors
Feel free to use this script in your strategies to improve your profits and lower drawdowns.

Altered True Strength Indicator (TSI) Reupload-
Altered TSI provides a slightly more volatile signal that demonstrates extremities in price action with greater success than standard TSI. In addition, I added bull/bear cross indicators (green/red) to make it easier to notice the crosses to save time when the market is moving fast (I couldn't find a regular TSI script with this addition). Finally, the signal also has overextension parameters (red and green lines)
I think this is best used on Intraday time frames as the signals respond to volatility very well and using Heikin Ashi candles, trend is more visual. In this particular example, I am showing SPY on the 3m time chart (my favorite short time frame) and the signal alone provided many opportunities for trades when using simple divergences and countering overextension direction when short term (blue) signal crosses either
In the first example (purple lines), SPY ramps but it was a dull signal given the signal strength flatlining- we would be looking for a short entry. When the signal fires, it provides a clean $1.50 move down in spy.
In the second example (orange), the blue signal provides a nice V shape (rebound signal) in which we are looking for a long entry. 390.50 is a strong SPY support in confluence with 2nd std dev VWAP extension, but disregarding that bull signal fires resulting in a 2 dollar move upwards. Exit is provided when blue line crosses green overextension.
In the third example (white), we are searching for a short entry at 392.5 resistance in confluence with divergently higher highs. Bear cross signal when fired and a significant cross is visible provides a $2.50 move to the downside with a potential exit provided when blue line crosses red overextension line in confluence with previous LOD area.
In the fourth example (green), we watch as the blue line provides a V pattern, we are searching for a long entry. If you didn't take a riskier long at 2nd std dev VWAP overextension with V recovery on blue line at red overextension for a ride to vwap, then you are looking for a secondary entry long as you wouldn't take the trade at resistance (vwap). Bullishly divergent lows provide this entry and the signal does not bear cross at all (but looking for significant crosses is more important even if the signal were to make a minor bear cross). Bullishly divergent double bottom provides a long entry to end of day with a nice clean signal for a $5.00 move until eod or when signal crosses overextension range.
Ideally, close to the money options or SPY/SPXS/SPXL are best used in the intraday time frame.
Again, this is not a standalone indicator but it's best used in conjunction with other indicators/trading strategies
Any questions feel free to comment

Bull Market Support Band (20w SMA, 21w EMA)This moving average indicator is a bull market support band. It's significance comes from the previous bull runs where the price was bouncing off or riding from a distance the support band until the end of the market cycle. For example, during the 2017 bull run, Bitcoin had several 30-40% corrections to the support band.
The green line represents the 20 weeks simple moving average and the red line represents the 21 weeks exponential moving average. The best way to read the current value is to look at the weekly chart, but any time frame will display the same values.
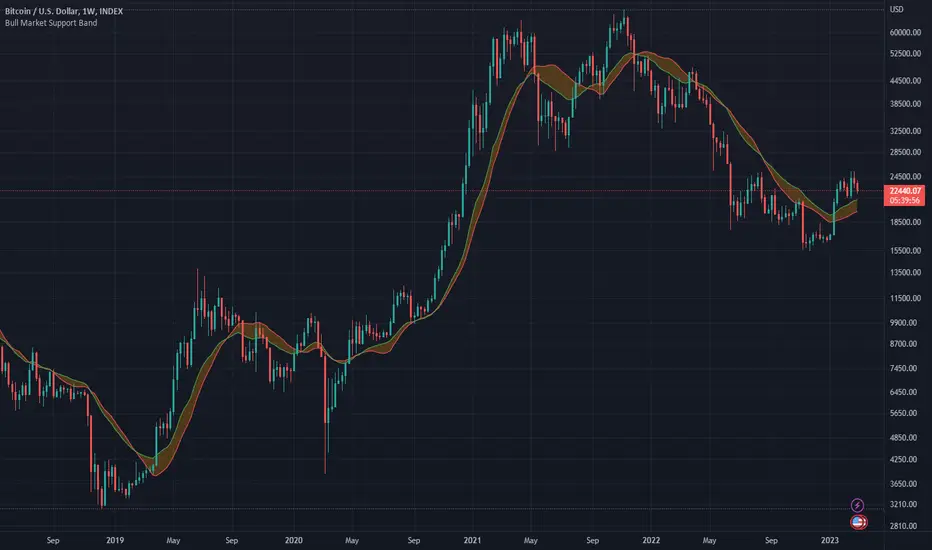
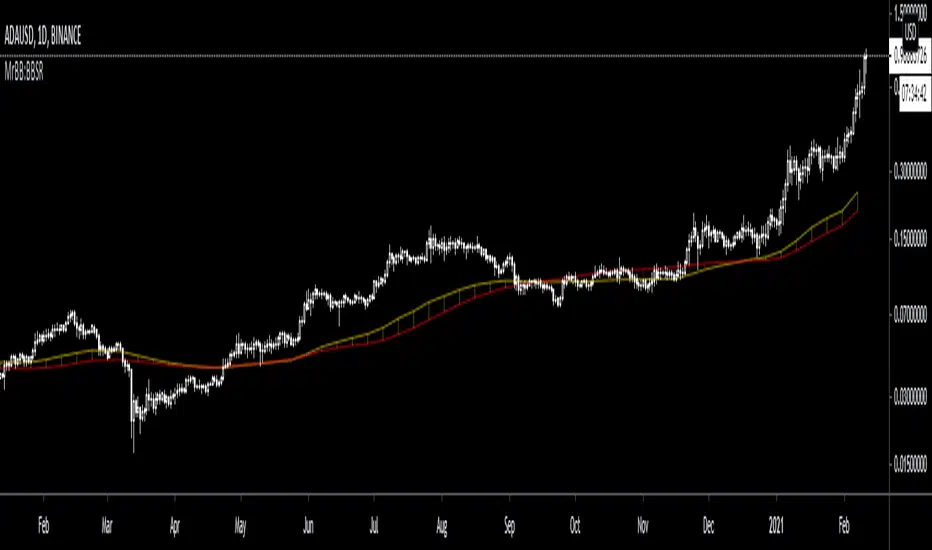
MrBB:BullBear Support BandVery simple and effective S/R band. Created bycombining the weekly 21EMA and weekly 20SMA, it provides strong support/resistance depending on market direction, and works as a basing area for retraces during parabolic (and normal) bull markets.
Decomposed Average True RangeThis simple script decomposes the value of the Average True Range into a bullish component and a bearish component .
The script supports two plotting methods; Mirrored and Two Lines . If Mirrored is chosen, the indicator plots the bullish component as a positive number, and the bearish component as a negative number. If Two Lines is chosen, the indicator plots two lines, both of positive values. It is the same data, just visualized differently.
Side note: This is very similar to how the strength (average gain) part in the Relative Strength Index calculation works. However, the RSI uses the realized range (close - previous close) rather than true range. If we were to use the bullish component of the ATR as the average bullish gain part in the RSI calculation, and the bearish component of the ATR as the average bearish gain part in the RSI calculation, we would get very similar (but not equal) results to the standard RSI. This shows how the ATR and the RSI are related to each other.

Bitcoin Bulls and Bears by @dbtrBitcoin 🔥 Bulls & Bears 🔥
v1.0
This free-of-charge BTC market analysis indicator helps you better understand what's going with Bitcoin from a high-level perspective. At a glance, it will give you an immediate understanding of Bitcoin’s historic price channel dating back to 2011, past and current market cycles, as well as current key support levels.
Usage
Use this indicator with any BTCUSD pairs , ideally with a long price history (such as BNC:BLX )
We recommend to use this indicator in log mode, combined with Weekly or Monthly timeframe.
Features
🕵🏻♂️ Historic price channel curve since 2011
🚨 Bull & bear market cycles (dynamic)
🔥 All-time highs (dynamic)
🌟 Weekly support (dynamic, based on 20 SMA )
💪 Long-term support (channel bottom)
🔝 Potential future price targets (dynamic)
❎ Overbought RSI coloring
📏 Log/non-log support
🌚 Dark mode support
Remarks
With exception of the price channel curve, anything in this indicator is calculated dynamically , including bull/bear market cycles (based on a tweaked 20SMA), ATHs, and so on. As a result, historic market cycles may not be 100% accurately reflected and may also differ slightly in between various time-frames (closest result: Monthly). The indicator may even consider periods of heavy ups/downs as their own market cycles, even though they weren’t. Due to its dynamic nature, this indicator can however adapt to the future and helps you quickly identify potential changes in market structure, even if the indicator is no longer updated.
On top of that bullmarket cycles (colored in green) feature an ingrained RSI: the darker the green color, the more the RSI is overbought and close to a correction (darkest color in the chart = 90 Weekly RSI). In comparison with past bull cycles, it helps you easily spot potential reversal zones.
Thanks
Thanks to @quantadelic and @mabonyi which both have worked on the BTC "growth zones" indicator including the price channel, of which I have used parts of the code as well as the actual price channel data.
Follow me
Follow me here on TradingView to be notified as soon as new free and premium indicators and trading strategies are published. Inquire me for any other requests.
Enjoy & happy trading!
