Draculapresley Daytrading STRAT O' DOOM 1.3Very excited with my results after extensive testing I present the Strat O Doom version 1.3!
Using some custom settings with a few indicators and a custom movement algorithm I have fine tuned my strat even further. The strat now lends itself to quick trades but also better at finding longer movements as well.
I appreciate everyone participating and engaging with my last version and anyone who has donated will get access to the new settings!
For access please consider a donation...
BTC
19sbyzKm9PqYizeFgTkT1gSRvyfBNa2bn7
ETH
0x6b8ef9f4979df6efd51e745ba996299349d67306
LTC
LLMUH5v5DeurLZEeX2Atu9W36vLA1pTX7o
For donation confirmations or script purchase you can email draculapresley@gmail.com
Buy

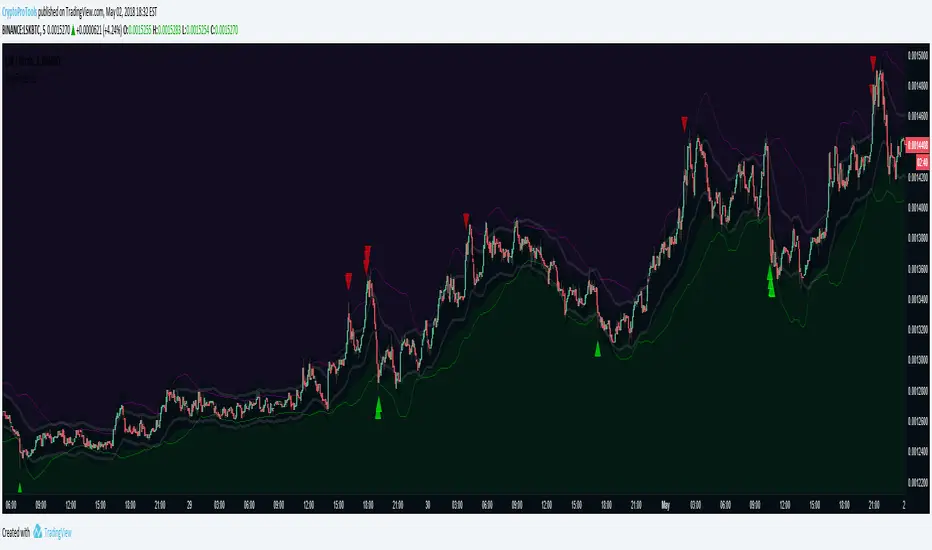
AutoTrader v2 by CryptoProToolsAutoTrader v2 comes with the ability to heavily customize / fine tune your Buying and Selling strategies separately.
Want to factor in RSI, LOWBB and EMAGAIN for Buys, but then only use MFI and EMA Channels for Sells?
THIS CAN DO THAT!
Choose from the following to create your ideal strategy :
- HIGH BB / LOW BB
- EMAGAIN
- RSI (Relative Strength Index)
- MFI (Money Flow)
- EMA Channels
------------------------------------
CryptoProTools Members Only
-----------------------------------
Hit me up to learn more about becoming a member.
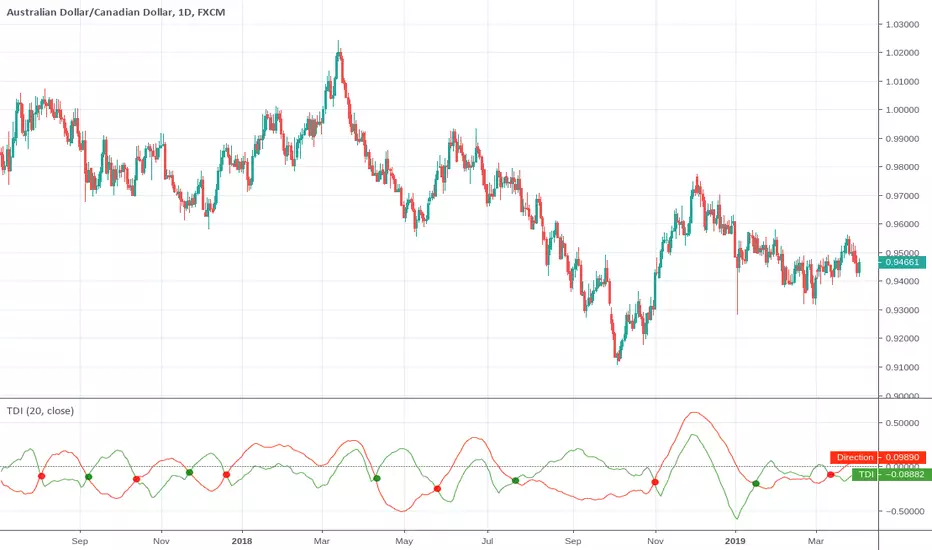
Trend Detection IndexTrend Detection Index indicator script.
This indicator was originally developed by M.H. Pee (Stocks & Commodities V. 19:10 (54-61): Trend Detection Index).
No Emotions indicator- Execute your trading plan EMOTIONLESSEmotions are one of the most important variable in trading
With this indicator you can execute your trade without any feelings ruining your plan
The idea is simple: you can monitor your trades by just looking at a row of colored squares, no need to watch the charts once entered a trade
Green square= you are in profit
Red square = you are in a loss
Yellow cross on green square = take profit hit
Purple cross on red square = stoploss hit
Just input the symbol, entry price (entrata), take profit and stoploss
From there, just watch the squares and no charts
Each row of squares is an entry, you can input up to 3 entries in this version
No Emotions= perfect trading execution
The code is protected but anyone can use it
if you enjoy this free indi, check out my main creation called "Stochastics Real Deal Indicator"

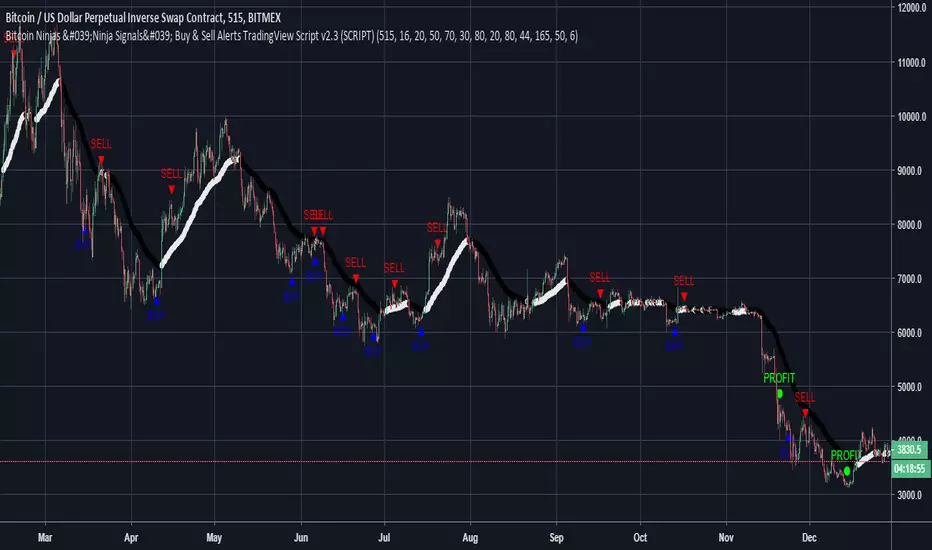
BitcoinNinjas Ninja Signals Buy Sell Alert Trading Strategy v2.0Bitcoin Ninjas 'Ninja Signals' Buy/Sell Alerts & Backtesting TradingView Script v2.0
(for Cryptocurrencies, Forex, GunBot, ProfitTrailer, automatic trading software, and more)
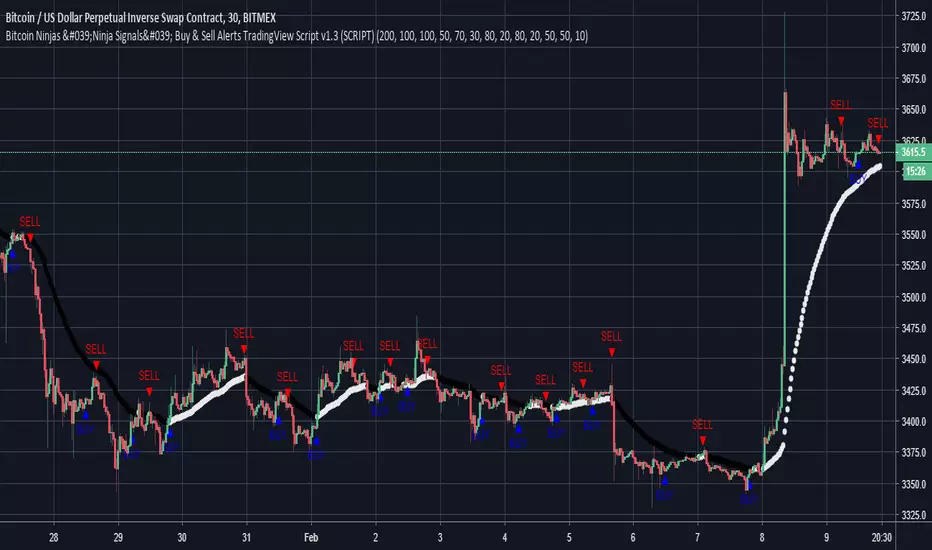
'Ninja Signals' v2.0 (SCRIPT)
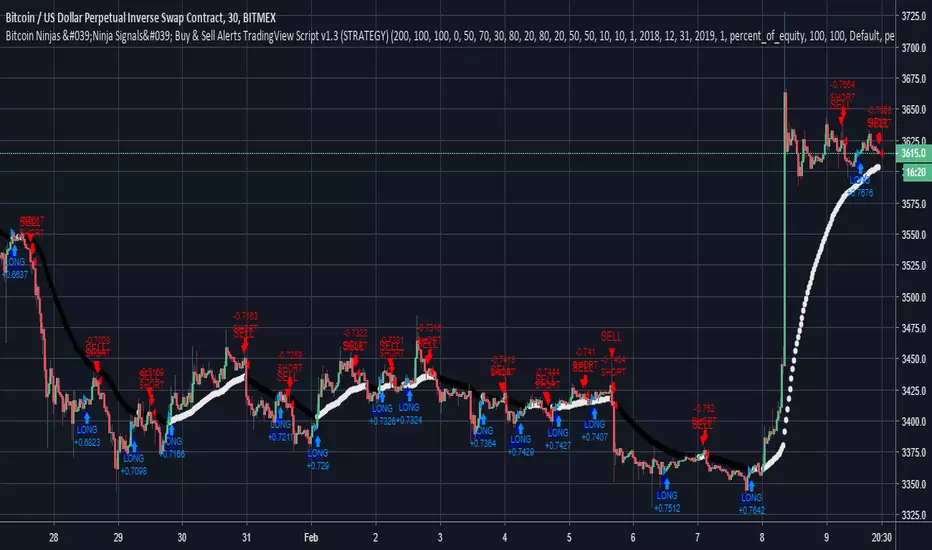
'Ninja Signals' v2.0 (STRATEGY)
'Ninja Signals' v1.0 (SCRIPT)
'Ninja Signals' v1.0 (STRATEGY)
-Allows users to easily set automated buy and sell alerts on TradingView for use with automatic and manual trading of cryptocurrencies, Forex securities, and more (alerts are compatible with automatic trading software such as GunBot, ProfitTrailer, and more).
-Synthesizes many powerful indicators [e.g. Relative Strength Index (RSI), stochastic RSI, Money Flow Index (MFI), Moving Average Convergence Divergence (MACD), etc.) into one super script to generate very precise buy and sell signals in almost any market condition.
-Buy arrows (blue) and sell arrows (red) can be changed or hidden for ease of viewing.
-No lag EMA trendline featuring trend-reversal color-coding (white uptrend, black downtrend).
-Adjustable ‘calibration’ setting allows users to customize the script to work for any currency or security available through TradingView, on any exchange, simply by adjusting a number.
-Complete with backtesting strategy version of script which allows users to test various buy and sell strategies based on the alerts the script generates (see info and screenshots below).
-Backtesting strategy incorporates a user-defined adjustable date range, so users can estimate the script’s performance over specific periods of time, such as the last day, week, or month.
-Backtesting strategy utilizes a minimum protective gain setting to help you never sell for a loss. Simply adjust your minimum profit (%) per trade, and the test results will update.
-Backtesting strategy allows for pyramid buying to test various average down / double up buying strategies. Simply adjust the number of pyramid buys and the quantity of each buy.
- Free 7-day trial available for TradingView users who join our free BitcoinNinjas community.
-Free 24/7 support via BitcoinNinjas Telegram GunBot support group with script purchase.
-Fully compatible with GunBot automatic trading software (TradingView plugin is required).
-Special discount available for traders who purchase GunBot automatic trading software and the GunBot TradingView plugin from BitcoinNinjas, allowing for fully automatic trading.
-Contact us via Email or Telegram for more information, to request additional / custom screenshots, or to start your free trial.
DISCLAIMER: By using this BitcoinNinjas document or ‘Ninja Signals’ planning script, you agree to the BitcoinNinjas 'Terms of Use', as presented on our website (www.BitcoinNinjas.org) and as stated here. No sharing, copying, reselling, modifying, or any other forms of use are authorized for our documents, script / strategy, and the information published with them. This informational document and planning script / strategy is strictly for individual use and educational purposes only. This is not financial or investment advice. Investments are always made at your own risk and are based on your personal judgement. BitcoinNinjas is not responsible for any losses you may incur. Please invest wisely.

BitcoinNinjas Ninja Signals Buy/Sell Alert Trading Script v2.0Bitcoin Ninjas 'Ninja Signals' Buy/Sell Alerts & Backtesting TradingView Script v2.0
(for Cryptocurrencies, Forex, GunBot, ProfitTrailer, automatic trading software, and more)
'Ninja Signals' v2.0 (STRATEGY)
'Ninja Signals' v2.0 (SCRIPT)
'Ninja Signals' v1.0 (STRATEGY)
'Ninja Signals' v1.0 (SCRIPT)
-Allows users to easily set automated buy and sell alerts on TradingView for use with automatic and manual trading of cryptocurrencies, Forex securities, and more (alerts are compatible with automatic trading software such as GunBot, ProfitTrailer, and more).
-Synthesizes many powerful indicators [e.g. Relative Strength Index (RSI), stochastic RSI, Money Flow Index (MFI), Moving Average Convergence Divergence (MACD), etc.) into one super script to generate very precise buy and sell signals in almost any market condition.
-Buy arrows (blue) and sell arrows (red) can be changed or hidden for ease of viewing.
-No lag EMA trendline featuring trend-reversal color-coding (white uptrend, black downtrend).
-Adjustable ‘calibration’ setting allows users to customize the script to work for any currency or security available through TradingView, on any exchange, simply by adjusting a number.
-Complete with backtesting strategy version of script which allows users to test various buy and sell strategies based on the alerts the script generates (see info and screenshots below).
-Backtesting strategy incorporates a user-defined adjustable date range, so users can estimate the script’s performance over specific periods of time, such as the last day, week, or month.
-Backtesting strategy utilizes a minimum protective gain setting to help you never sell for a loss. Simply adjust your minimum profit (%) per trade, and the test results will update.
-Backtesting strategy allows for pyramid buying to test various average down / double up buying strategies. Simply adjust the number of pyramid buys and the quantity of each buy.
- Free 7-day trial available for TradingView users who join our free BitcoinNinjas community.
-Free 24/7 support via BitcoinNinjas Telegram GunBot support group with script purchase.
-Fully compatible with GunBot automatic trading software (TradingView plugin is required).
-Special discount available for traders who purchase GunBot automatic trading software and the GunBot TradingView plugin from BitcoinNinjas, allowing for fully automatic trading.
-Contact us via Email or Telegram for more information, to request additional / custom screenshots, or to start your free trial.
DISCLAIMER: By using this BitcoinNinjas document or ‘Ninja Signals’ planning script, you agree to the BitcoinNinjas 'Terms of Use', as presented on our website (www.BitcoinNinjas.org) and as stated here. No sharing, copying, reselling, modifying, or any other forms of use are authorized for our documents, script / strategy, and the information published with them. This informational document and planning script / strategy is strictly for individual use and educational purposes only. This is not financial or investment advice. Investments are always made at your own risk and are based on your personal judgement. BitcoinNinjas is not responsible for any losses you may incur. Please invest wisely.

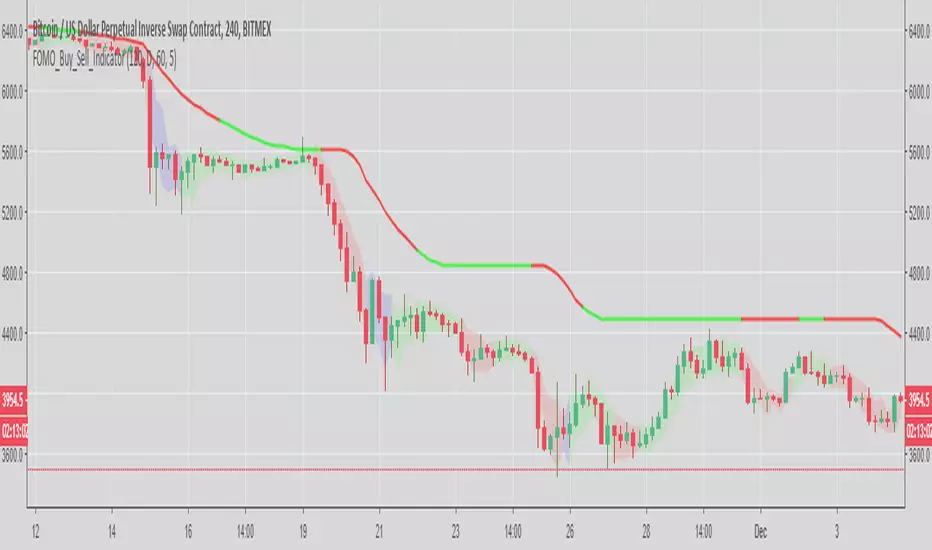
FOMO_Buy_Sell_IndicatorBuy and sell indicator that fits everyone's needs.
For noobs - You can use it even if you are not TA friendly. Green is buy and Red is sell.
For pros - It helps you second guess your ins and outs.
PM to gain access, please. Thanks
MadLad v0.01 (Buy/Entry Signals)This script is a very rough, very early release of a project called madlad (www.twitter.com).
Currently being used on BITSTAMP:XRPUSD 5 Min Heiken Ashi.
It's a very early concept. It is also very aggressive , therefore it spams buy signals. The buy symbols do not mean enter, they are simply potential entry points.
You can see this especially during heavy drops, I would generally wait for the end of the shading to make an entry. Aqua shading is simply confluence with another indicator.
Feel free to mess around with some of the settings, however most are just placeholders and do little to nothing.
I will eventually update this to remove some of the spammy buy signals. If you use this with some other indicators, it will definitely help remove a bit of the spammy-ness.
In the meantime though, if anyone is able to come up with their own solutions on avoiding bad trades while using the "buy" signals, feel free to DM me and or post in the comments.
Follow www.twitter.com
There we will be posting updates and entry/exits in realtime! For free, no signal group BS or anything, this comes at the cost of signals not always being correct so always trade at your own risk!

Bitfinex dominionThis indicator will show you which gang is dominating the market : the bearish gang (short masters),
or the bullish gang (long masters).
The bearish gang is drawn in red and the Bullish one is in green color.
If red is above green, that means we have a bearish tendency on the market.
if green goes above red, that means the market is going the bullish way.
It's nice to use it on 1H or 30 minutes intervals.
Here's what I do : When the dominion is changing hands (=a shift in color), then that mean the market
is moving in another direction. I then use my other indicators to make a decision so to create a trade
at the very moment of the dominance change or not...
NB1: make sure you know what you do before using this "what I do" strategy. It can be not suited to
everyone. Trading is a risky business. So don't take words as granted from people like me or others.
The best thing to do is : testing,testing then re-testing while having a good money management.
I've burnt myself many times before.
NB2: Margin trading can be really risky if you use this "what I do" strategy. Because price can go far in
counter direction before getting back to our target price. So you can risk a margin call. So it's better
using this "what I do" strategy on market trading only.

Draculapresley's Daytrading Scalping STRAT O' DoomUsing some custom settings with a few indicators and a custom movement algorithm I have backtested this script and used it with great results. Excellent for getting in and out for quick scalping trades. The results are typically 1% + and sometimes even a great deal more. The indicator gives you buy and sell points and works great with 15 min candles though you can modify the inputs to work with any time frame. Use all 3 indicators for safest bets but most of the time just using the Stoch input with the movement algorithm almost always yields positive results with tons of buys. Works pretty well even in a downturn but absolutely kills in a bull market.
Check out the screenshots below.
imgur.com

Bitcoin Ninjas 'Ninja Signals' Buy & Sell Alert Trading StrategyBitcoin Ninjas 'Ninja Signals' Buy/Sell Alerts & Backtesting TradingView Script
(for Cryptocurrencies, Forex, GunBot, ProfitTrailer, automatic trading software, and more)
Main Script:
-Allows users to easily set automated buy and sell alerts on TradingView for use with automatic and manual trading of cryptocurrencies, Forex securities, and more (alerts are compatible with automatic trading software such as GunBot, ProfitTrailer, and more).
-Synthesizes many powerful indicators [e.g. Relative Strength Index (RSI), stochastic RSI, Money Flow Index (MFI), Moving Average Convergence Divergence (MACD), etc.) into one super script to generate very precise buy and sell signals in almost any market condition.
-Buy arrows (blue) and sell arrows (red) can be changed or hidden for ease of viewing.
-No lag EMA trendline featuring trend-reversal color-coding (white uptrend, black downtrend).
-Adjustable ‘calibration’ setting allows users to customize the script to work for any currency or security available through TradingView, on any exchange, simply by adjusting a number.
-Complete with backtesting strategy version of script which allows users to test various buy and sell strategies based on the alerts the script generates (see info and screenshots below).
-Backtesting strategy incorporates a user-defined adjustable date range, so users can estimate the script’s performance over specific periods of time, such as the last day, week, or month.
-Backtesting strategy utilizes a minimum protective gain setting to help you never sell for a loss. Simply adjust your minimum profit (%) per trade, and the test results will update.
-Backtesting strategy allows for pyramid buying to test various average down / double up buying strategies. Simply adjust the number of pyramid buys and the quantity of each buy.
-Free 7-day trial available for TradingView users who join our free BitcoinNinjas community.
-Free 24/7 support via BitcoinNinjas Telegram GunBot support group with script purchase.
-Fully compatible with GunBot automatic trading software (TradingView plugin is required).
-Special discount available for traders who purchase GunBot automatic trading software and the GunBot TradingView plugin from BitcoinNinjas, allowing for fully automatic trading.
-Contact us via Email or Telegram for more information, to request additional / custom screenshots, or to start your free trial.
Screenshot (Script)
Screenshot (Backtesting Strategy)
Screenshot (Adjustable Calibration, Minimum Profit Per Trade, & Date Range)
Screenshot (Optional Pyramid / Average Down Buying)
Screenshot (Customizable Buy/Sell Arrows & Trend Reversal Line)
DISCLAIMER: By viewing and/or using this TradingView script, you agree to the BitcoinNinjas 'Terms of Use', as presented on our website ( BitcoinNinjas.org ) and as stated here. No sharing, copying, reselling, modifying, or any other forms of use, are authorized for this document. This document is strictly for individual use and informational purposes only. This is not financial or investment advice. Investments are always made at your own risk, and are based on yo
Bitcoin Ninjas 'Ninja Signals' Buy & Sell Alert Trading ScriptBitcoin Ninjas 'Ninja Signals' Buy/Sell Alerts & Backtesting TradingView Script
(for Cryptocurrencies, Forex, GunBot, ProfitTrailer, automatic trading software, and more)
-Allows users to easily set automated buy and sell alerts on TradingView for use with automatic and manual trading of cryptocurrencies, Forex securities, and more (alerts are compatible with automatic trading software such as GunBot, ProfitTrailer, and more).
-Synthesizes many powerful indicators [e.g. Relative Strength Index (RSI), stochastic RSI, Money Flow Index (MFI), Moving Average Convergence Divergence (MACD), etc.) into one super script to generate very precise buy and sell signals in almost any market condition.
-Buy arrows (blue) and sell arrows (red) can be changed or hidden for ease of viewing.
-No lag EMA trendline featuring trend-reversal color-coding (white uptrend, black downtrend).
-Adjustable ‘calibration’ setting allows users to customize the script to work for any currency or security available through TradingView, on any exchange, simply by adjusting a number.
-Complete with backtesting strategy version of script which allows users to test various buy and sell strategies based on the alerts the script generates (see info and screenshots below).
-Backtesting strategy incorporates a user-defined adjustable date range, so users can estimate the script’s performance over specific periods of time, such as the last day, week, or month.
-Backtesting strategy utilizes a minimum protective gain setting to help you never sell for a loss. Simply adjust your minimum profit (%) per trade, and the test results will update.
-Backtesting strategy allows for pyramid buying to test various average down / double up buying strategies. Simply adjust the number of pyramid buys and the quantity of each buy.
-Free 7-day trial available for TradingView users who join our free BitcoinNinjas community.
-Free 24/7 support via BitcoinNinjas Telegram GunBot support group with script purchase.
-Fully compatible with GunBot automatic trading software (TradingView plugin is required).
-Special discount available for traders who purchase GunBot automatic trading software and the GunBot TradingView plugin from BitcoinNinjas, allowing for fully automatic trading.
-Contact us for more information, to request additional / custom screenshots, or to start your free trial.
DISCLAIMER: By viewing and/or using this TradingView script, you agree to the BitcoinNinjas 'Terms of Use', as presented on our website and as stated here. No sharing, copying, reselling, modifying, or any other forms of use, are authorized for this document. This document is strictly for individual use and informational purposes only. This is not financial or investment advice. Investments are always made at your own risk, and are ba
Crypto Buy/Sell Signals - AutoView - CryptoProToolsOur first indicator for use with Autoview / Gunbot or any other TradingView compatible trade bot.
The script uses a bunch of rules to filter out as many bad signals as possible.
Consider this the BETA version with more updates to come.
Current CryptoProTools members who want access just message me.
Get 10% OFF any AutoView Subscription with the coupon : JVBHV-BUTY0-F863G

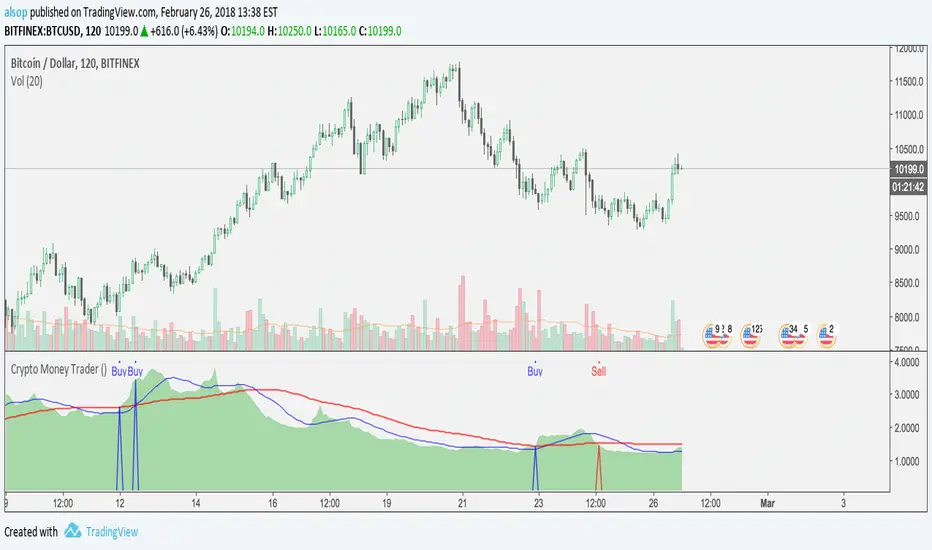
Crypto Money Trader - Indicator for Buy and Sell SignalsThis is it... the one that many have been waiting for.
We have taken everything we have learned from the Crypto Money Index and Crypto Money Bot and combined it into the best indicator possible for trading crypto currencies. This version also includes logic for shorts (sell) and another criteria for longs (buys).
The code is cleaner as well so there is less signal noise and more precise entries.
Before we released this script, we did backtesting on all the current supported USD pairs for optimal results.
Here is one set of results for BTC on 2 hour chats using $5,000 starting balance, 1 trade at once maximum, and 1 contract size:
www.cryptosignalsbot.com
Net Profit: $25,582, 511.64%
Total Trades: 17
Percent Profitable: 70.59%
Profit Factor: 4.304
Maximum Downdraw: $6,629
AvgTrade: $1,504.82, 30.1%
These results get even crazier when you get into settings where you can have 4 trades at once - beyond 700% return... crazy...
The indicator also includes alerts that you can setup so you are aware when a Buy or Sell signal is triggered. Just set an indicator alert for the Trigger Buy or Trigger Sell greater then a value of 0 and you will always know when it is time to look at the charts.
--== STRATEGY ==--
You can combine this indicator with other indicators in your strategy. Many of our most successful users of our previous scripts do just that as it helps them tune a perfect time for an entry.
Personally, we use the indicator and simple trendline entries. When a Buy or Sell triggers, draw a trendline and support / resistance lines and enter on a breakout. That's it.
Please note: this is not a "buy it or sell it now" kind of indicator. Sometimes it will signal a few hours early before a move.
--== SUPPORTED PAIRS ==--
We are always adding pairs, but as of February, 2018 this is our supported USD based pairs: BTC, ETH, LTC, XRP, NEO, BCH, IOT, EOS, BTG, ETC, ETP, OMG, EDO, ZEC, XMR, TRX, SAN, DSH, SNG
--== TELEGRAM CHANNEL ==--
All subscribers to this indicator will get access to our Exclusive Telegram Group where all the signals are analyzed and posted for you to see how we are playing the calls. You can either use this to learn how we use the indicator, or to trade from (at your own risk of course).
The alerts are all posted in this channel automatically and only the timeframes with the highest returns from extensive backtests are posted here automatically. However, we will sometimes post analysis on other timeframes as well.
--== BONUS ==--
As a subscriber, not only do you get this amazing indicator, but as a subscriber you will get access to our Crypto Money Index and the Crypto Money Bot
--== ACCESS ==--
Access is simple, go to our new website and register: Crypto Signals Bot
We will work to get you access to everything as quickly as possible. If you have any issues or questions, use the contact form on the website.
GR-Moving Average CrossA simple indicator that contains all the main Moving Averages you'll probably need.
This indicator can be used on any time frame you wish.
The default periods for the moving averages are 5, 10, 20, 50, 100 & 200.
However you can set these values to whatever works for you, for example 5, 8, 10, 21, etc.
Please let me know in the comments below which values you use the most, so that I can adjust the defaults accordingly.
The lines get darker and thinker the more periods the MA covers.
You can easily adjust the colours of the lines and their thickness too.
The current colours seem to work OK on both the light and dark TradingView themes, but please do make suggestions for better default value.
You can also choose between 7 different ways of calculating the moving averages:
!None = You don't want to see this line
SMA ( Simple Moving Average )
EMA ( Exponential Moving Average )
WMA ( Weighted Moving Average )
DEMA ( Double Exponential Moving Average )
TEMA (Triple Moving Average
HMA ( Hull Moving Average )
This indicator can also show basic buy & sell zones.
They work well after steep trends, but will give lots of poor signals in a sideways moving market.
I find that the sell signal is more reliable than the buy signal.
Use these indications with caution and definitely combine them with other data/indicators as they are only based on the moving averages.
Comments and suggestions are most welcome.
I'm available for hire to create custom indicators or to work on more complex projects.

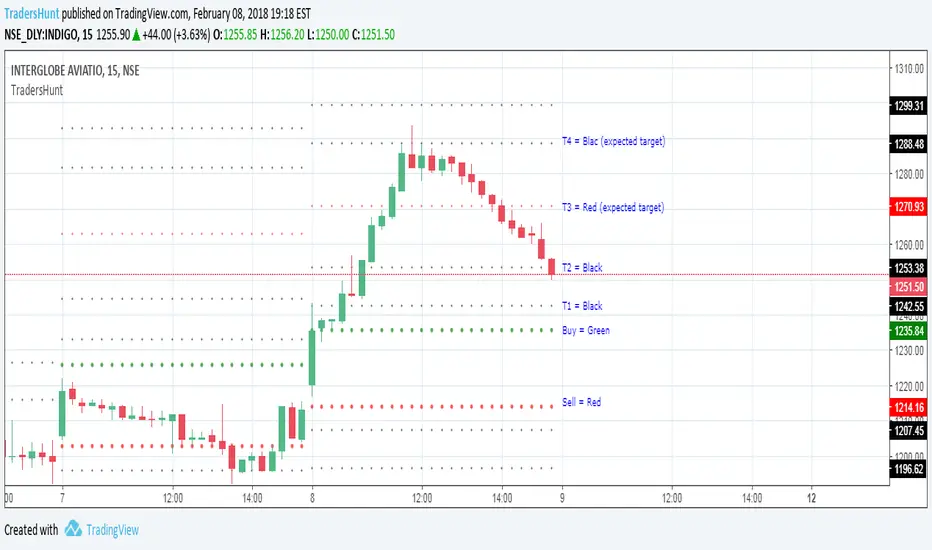
TradersHunt Buy & Sell LevelsTradersHunt's Buy & Sell Indicator is designed for Intraday Trading for Indian Market but it can also be used for Global Markets and Commodities. It is based on Support & Resistance Levels.
The details are as follows;
Green Level indicates buy price, a trader should wait for 15min candle to close above it and Red level can be used as SL if trader is taking long position. The Black colored levels above Green are Targets for taken Long Position. Similarly red colored level indicates Sell value and levels below it are targets for short position.
visit our website www.tradershunt.com for more information.
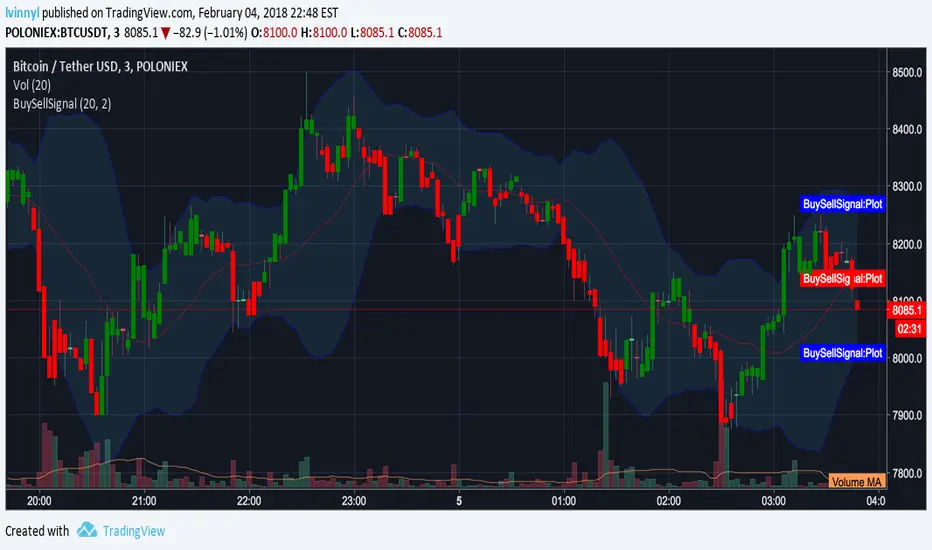
GreenRedSignal with Alerts by lvinnyl// Script created by JoinFree
// Modified by lvinnyl to trigger alerts
// Click on image below for original script...

Crypto Money Index - buy Signals for Bitcoin and MoreAn updated version of my previous script, this one includes buy alerts.
It has been tested with Bitcoin (BTC), Monero (XMR), Ethereum (ETH), Dash (DSH), Bitcoin Cash (BCH), LiteCoin (LTC), and IOTA (IOT).
To use for Futures on BitMex (as shown in examples), you need to use the Override feature and set the prefix. For example, Bitcoin futures on BitMex is XBTZ17 - so you would set the override to true and pair to BTC. For Ethereum futures on BitMex, you would turn the override to true and set the pair to ETH.
For USD based pairs (BTCUSD, ETHUSD) it will update automatically.
Ok, on to examples...
Here is how we can see the Bitcoin Cash pump that happened this week BEFORE it happened by seeing price action in the indicator:
Here is a similar example with DASH:
Here is another (again) example with Monero (XMR):
Lastly, IOTA (IOT) with lots of buying signals and double bottoms to play with... regardless if you got in early and rode a small loss for a bit, it popped as well.
ALERTS
To have an alert, create one on the chart and set it based on Trigger being greater than 0.
ACCESS
If you'd like to use my custom indicator - send 0.01 BTC to 32Hagdtq7PCR4inF4ZPkCReEjyecm2eNaP then email me at samurai_crypto@protonmail.com with your TradingView username and your transaction ID and I will add you.
Costs are lifetime with full support via email on how to use it.

BTC Buy Sell Guide (BSG) - MA & RSIhi BTChes,
green is when the price drops below the 100 day MA
red is the intensity of the 14 day RSI
BUY @ green
SELL @ the second or third RSI spike
most importantly, keep in mind fundamentals :)
-joie
Stochastics Real DealAfter years studying stochastics, here is the real deal
Stochastics comfirmation with very high probability setups
Green dots = it's time to consider stochastic signal of Buying
Red dots = it's time to consider stochastic signal of Selling
No dots = ignore stochastics signal
The formula for dots is really top secret
It works best on 1D timeframe
You can try the indicator for a trial period (just write in comments to have access), if you want unlimited access you can PM me after trial period
Remember: trading is a risky business, trade at your own risk. I'm not responsable for any gain or loss.

