TRADERS COMPANION BUY AND SELL INDICATORTHE 'PROBLEM'
A lot of buy and sell strategies are based on price action being at a particular (support) level, crossovers of different moving averages or of price action over moving averages. Whilst this is a safe way to trade, the price paid is lost earnings , whilst one waits for price/moving averages to reach a particular level/configuration. So for instance price may have to move X% before it crosses over a critical level and only then is a trade taken - the X% is usually 'lost'.
THE 'SOLUTION'
My motivation was to write a buy and sell indicator which makes (long) calls as early as possible therefore maximising profits and minimising losses whilst also identifying local tops at which profits may be taken if so desired.
THE METHOD
The philosophy of this indicator is centred around analysis of candlestick parameters for the present candle and comparing these to those of previous candles at set points. The results of these comparisons are then correlated with moving averages of price action and in so doing one is able to detect shift reversals earlier than conventional indicators would. Consequently, a signal can be created very close to the bottom of a rally. In addition, a 'take profit' signal can be created from what has been identified as a local top. Please refer to the attached chart where it becomes evident quite immediately that buy and TP signals allow for maximisation of a given trend, hence maximisation of profits.
MARKETS
The script may be applied to any market i.e. crypto, forex, stocks - as long as there's a chart on Tradingview, it will work.
CONDITIONS
The script works well in all time frames. Obviously at higher time frames one gets 'cleaner' signals since high time frames are themselves a kind of filter, given that lower time frames are 'busy' by nature.
CAVEAT
Whilst great care and attention has been put into polishing and re-polishing this script, it needs to be stated that it's not perfect. Two issues that one needs to be aware of:
1.) Sometimes signals will not be made as early as the actual bottom of a rally.
Mitigation for this is two fold:
a.) Most of the calls made by the script are close to a bottom and therefore profits realised from this are far more than any losses accrued from a late call.
b.) The script should never be used in isolation but along with TA strategies and common sense.
2. Sometimes a 'bad' call will be made.
Mitigation for this is two fold:
a.) The script has a 'smart' feature that calls for exit signals as soon as it's realised that the long call was not a favourable one. This enables one to minimise losses by cutting them quickly.
b.) The script should never be used in isolation but along with TA strategies and common sense.
PLEASE PERUSE ATTACHED CHART
I encourage you to please peruse the attached 'GOBTC' chart for a demonstration of the script in play.
HOW TO GET AND USE THE SCRIPT
Since its invite only, please PM me and I will be happy to add you. Once added, you will see the list under Indicators>Inviteonlyscripts>TRADERS COMPANION at which point you click and it will show on your chart. It also needs to be stated that there is a no obligation trial period during which one is encouraged to 'test-drive' the script to ones hearts content.
Buysignal

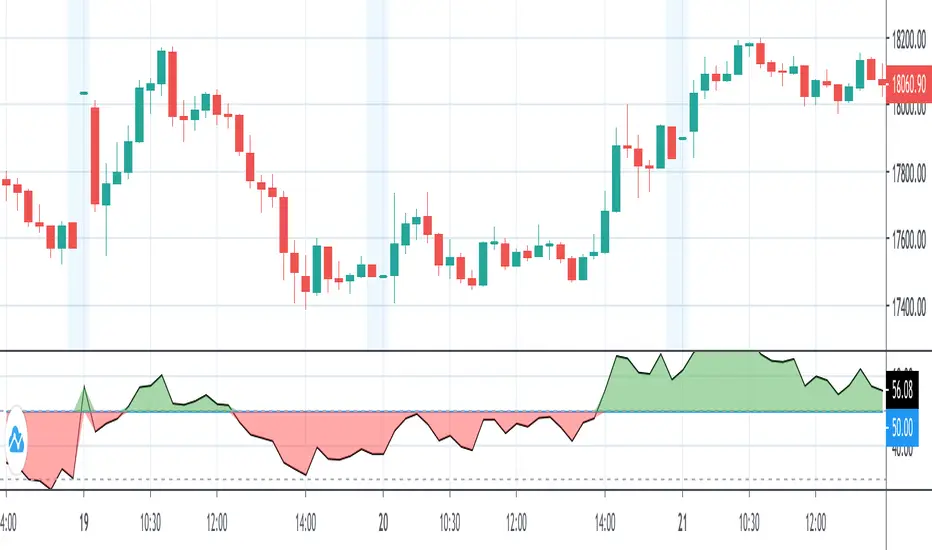
CryptoSignalScanner - OverBought/OverSold Zone IndicatorDESCRIPTION:
This indicator has been designed to do some swing trading on 4 hour and daily candles.
It also gives good results on the lower timeframes 5m, 15m and 1h but trading on those levels is time consuming and stressful.
• This indicator is based on RSI, Stochastic RSI and some other indicator(s).
• This indicator is based on our "CryptoSignalScanner - Advanced BUY/SELL Indicator" but with a small difference in calculation to define the OverBought and OverSold zones.
• It displays the OverBought and OverSold zones.
• It is also possibility to set an OverBought/OverSold, OverBought and OverSold alert.
HOW TO USE:
• When the OverBought zone is displayed it means that the trading pair is OverBought. Wait for the reversal to SELL. Use the Fibonacci tool together with the Eliot Waves Theory to SELL.
• When the OverSold zone is displayed it means that the trading pair is OverSold. Wait for the reversal to BUY. Use the Fibonacci tool together with the Eliot Waves Theory to BUY.
FEATURES:
• You can adjust the OverBought and OverSold zones.
• You can display/hide the RSI.
• You can adjust RSI values.
• You can display/hide the Stochastic RSI.
• You can adjust Stochastic RSI values.
• You can display/hide the ...
• You can adjust the ...
• You can set OverBought/OverSold alert.
• You can set OverBought alert.
• You can set OverSold alert.
• Etc...
REMARKS:
• This advice is NOT financial advice.
• We do not provide personal investment advice and we are not a qualified licensed investment advisor.
• All information found here, including any ideas, opinions, views, predictions, forecasts, commentaries, suggestions, or stock picks, expressed or implied herein, are for informational, entertainment or educational purposes only and should not be construed as personal investment advice.
• We will not and cannot be held liable for any actions you take as a result of anything you read here.
• We only provide this information to help you make a better decision.
• While the information provided is believed to be accurate, it may include errors or inaccuracies.
HOW TO GET ACCESS TO THE SCRIPT:
• Use the link below to subscribe to our indicators.
Good Luck,
SEOCO

[Alerts] Custom ORB with Target/StoplossThis Open Range Breakout (ORB) Indicator displays High, Low for the selected time frame.
Indicator Feature :-
Shows Long & Short signals based on the crossover.
You can use different alerts like Long, Short, Long-TP, Short-TP, Long-SL, Short-SL, Close
You can change Take profit points
Stop Loss will be low of breaking candle when Long signal is generated and high of breaking candle when Short signal is generated
Select Session time to get alerts only on that period
Select Square off and End Session to generate Close alert based on a specific time at the end of the day
In the future, I will Enhance and update this Indicator if needed
If you have any suggestion mention here
Thank you :-)

Dexie Indicator v1.0The Dexie Indicator is a Forex indicator system built for the 5 min chart. It is suitable for Forex traders and Nadex users and provides BUY/SELL signals with alerts and comes with a series of 8 custom built Moving Averages designed to reduce the need for chart drawing.
This indicator can be used by beginners out of the box and requires very little trading experience to be successful.
The more advanced trader can work with this tool to greatly increase their success rate and make for a much more enjoyable trading experience.
Please contact for more details.
Dexie Indicator with BUY/SELL signals displayed only:
Dexie Indicator with BUY/SELL signals, Bollinger Bands and custom Moving Averages:
Dexie Indicator with all custom Moving Averages displayed:
Dexie Indicator slower Moving average bull cross example:
Dexie Indicator slower Moving average bear cross example:

Dexie Indicator v1.0The Dexie Indicator is a complete Forex trading system built for the 5 min chart. It is suitable for Nadex users and provides BUY/SELL signals with alerts and comes with a series of 8 custom built Moving Averages designed to reduce the need for chart drawing.
This indicator can be used by beginners out of the box and requires very little trading experience to be successful.
The more advanced trader can work with this tool to greatly increase their success rate and make for a much more enjoyable trading experience.
Please contact for more details.
Dexie Indicator with BUY/SELL signals displayed only:
Dexie Indicator with BUY/SELL signals, Bollinger Bands and custom Moving Averages
Dexie Indicator with all custom Moving Averages displayed

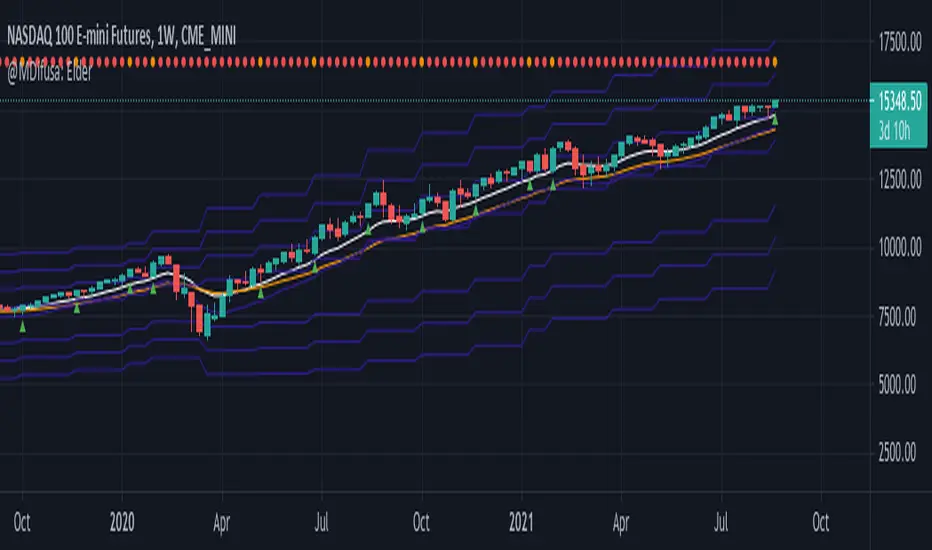
Elder EMA, ATR & MACD Indicator, 5X Time Frame & Divergences.This indicator is elaborated following the 3 window strategy described by Elder.
The fast, slow averages and MACD histogram are taken from a time frame 5 times higher than the active time frame and indicate bullish / bearish trends as well as divergences (bottom) of the hostogram with the price.
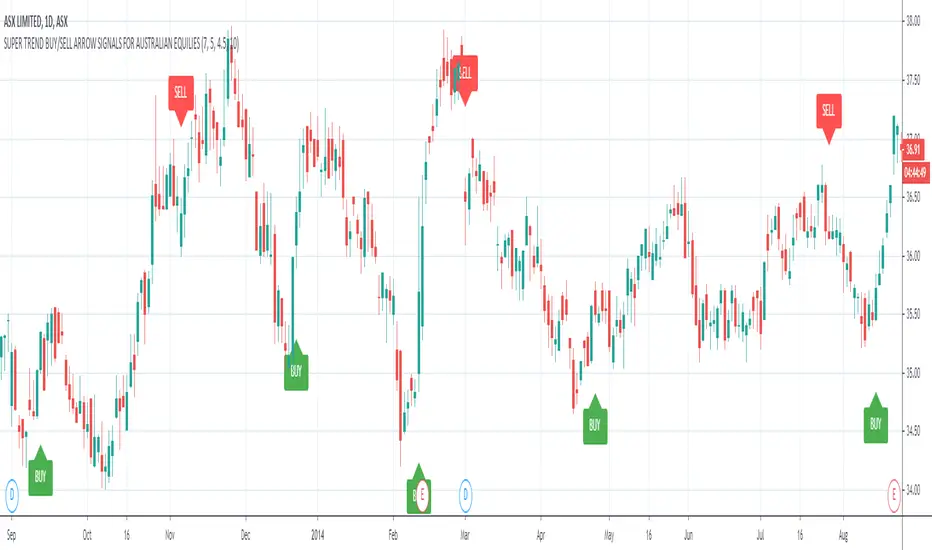
ASX Buy/Sell Arrow Signals For Australian Equities TradingASX Buy/Sell Arrow Signals For Australian Equities Trading.
ASX:ASX
This indicator is specifically designed to trade on assets on the Australian Stock Exchange.
The indicator analyzes historical data and predicts short-term trends and reversal points, as well as generates alert Buy/Sell or Long/Short trading signals.
A distinctive feature of this indicator is that the signals are filtered and high-precision signals are displayed.
The script is useful for trading as an independent trading system, as well as in combination with other indicators, as an addition to any existent trading system.
This script was compiled at the request of our subscribers and we hope it will be useful in trading.
The indicator uses a combination of few popular indicators such as MACD, RSI, Moving Averages.
Recommended for trading on timeframes: D1, W1.
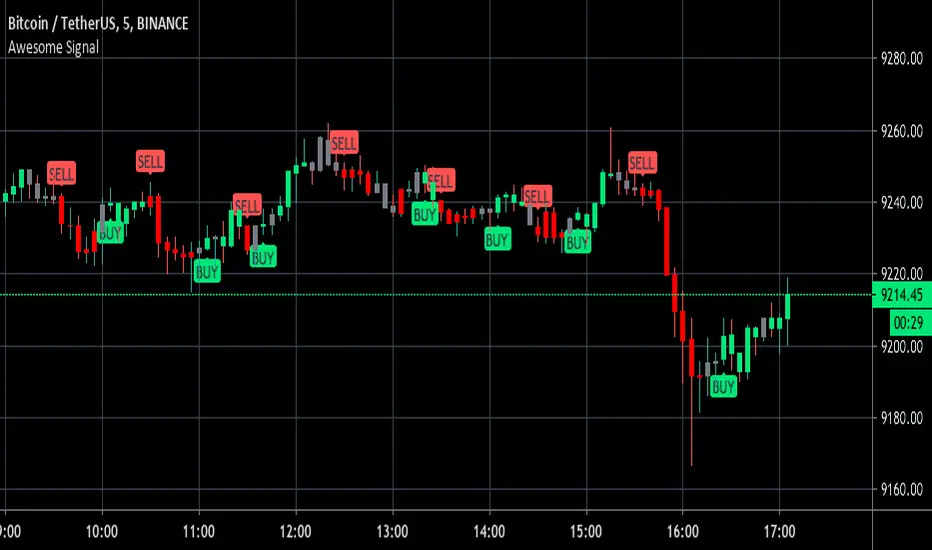
Awesome Buy/Sell SignalBuy and Sell signals using Bill William oscillators. Works for anything with high volume both crypto and stocks.
Optimal at Lower time frames and larger time frames can give you trend.
Green painted bars bullish momentum
Grey painted bars undecided momentum
Red painted bars bearish momentum.
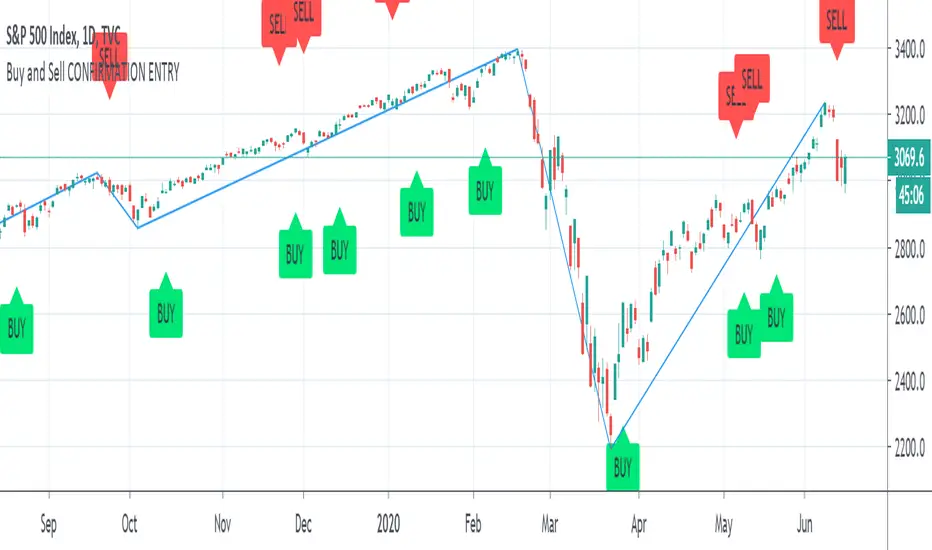
Buy and Sell CONFIRMATION ENTRY"Buy and Sell CONFIRMATION ENTRY" Product Description:
The indicator identifies market trends with visual buy/sell alerts on the chart.
Useful on higher timeframes available on Tradingview (ex: 4 hours, 1 Day).
The "Buy and Sell Confirmation" Indicator combines Moving Average Convergence Divergence and Relative Strength Index, which triggers technical signals when it crosses above (to buy) or below (to sell) its signal line. The crossovers transformed in buy and sell indicators is also taken as a signal of a market is overbought or oversold. The swing lines help you draw Elliott Waves to understand better where the market is heading.
The indicator can be used for every type of market: indices, stocks, cryptocurrencies, currencies and others.
This study is not a guarantee profit. You should backtest or trade virtual money before using this study on your real portfolio, as it is intended to be a tool and not a fortune teller.
Disclaimer: Trading and investing in the stock market and cryptocurrencies involves substantial risk of loss and is not suitable for every investor. The content covered in this videos is NOT to be considered as investment advice. I’m NOT a financial adviser. All trading strategies are used at your own risk.
Please send me a private message on TradingView to gain access to the script.
Buy/Sell IndicatorBased on logic from many top contributors here, the script utilizes LazyBear's WaveTrend Oscillator Indicator along with custom code to plot a few key components for daily trading;
Boundaries for entry and exit points which are based on a 6-day trend in OPEN/HIGH and OPEN/LOW prices.
Daily HIGH and LOW points to establish a good view of stock's movements
Entry and exit points with confidence levels. These can be treated as entry points for short to medium term investments
Entry points come in the colours of White and Lime, where white is slightly confident and lime is extremely confident
Exit points come in the colours of Maroon, and Red, where maroon is slightly confident and red is extremely confident
Each Entry and Exit point also comes without text, or with a M or H above it, where M indicates medium confidence on the point and an O indicates overconfidence.
Use Case:
The best possible use case is to enter a trade on a LIME point with O text, this means that is an overconfident entry point.
The trade should be exited on a RED point with O text, this means that is an overconfident exit point.
But you can do with the indicators as you please.
In addition to LazyBear's code, the following existing models and indicators are taken into account:
RSI of closing price over a period of 25
EMA of RSI

Volume Based Buy/SellThis is my very first scrip on this platform. It's the first version of the script, It works on the volume-based moving averages and exponential moving average.
I have added the buy/sell signals for educational purposes only. While adding the buy/sell signal I have an additional check on the strength of the trend to reduce loss to a minimum.
How to use:
1. Use with Heikin Ashi Chart.
2. Use 15 Min timeframe for intraday.
Some improvements I am working in the near future is:
1. Exit tread with the maximum profit.
2. Reduce down false trad to 0%.
To encourage and support please like the script try using for your own paper trading.
Dont forget to leave a comment on if you see any improvement in the script or any idea you have. Happy treading together.

RSI Market trendClear indication of market up and down trend so that you can stick to Buy or Sell strategy based on RSI.
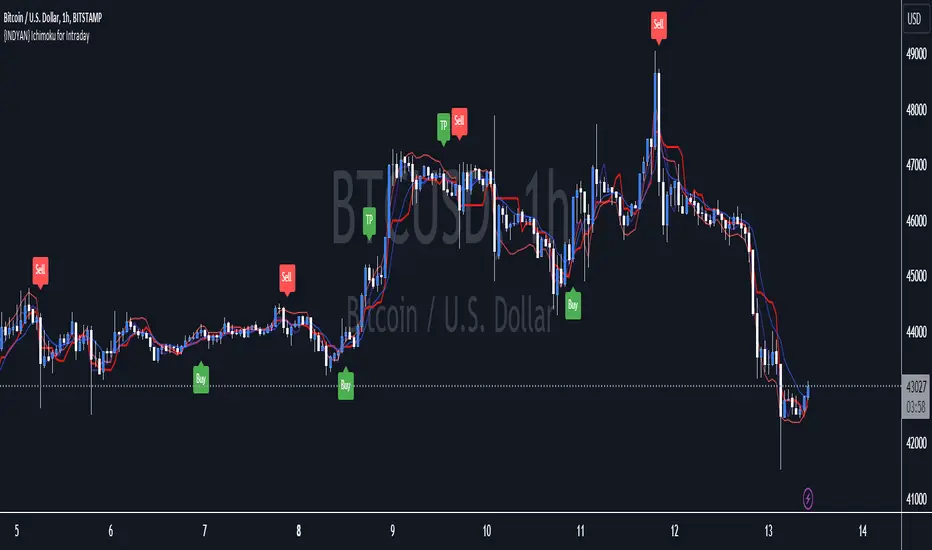
{INDYAN} Ichimoku for IntradayIts based on ichimoku, i removed cloud and mod some changes for better use in intraday trading. It can be used in stocks and index as well.Not tested on MCX and Forex.
Just watch at crossover of tenkan and kijun that RSI macd is above 60 and zero or not? If all three parameters meet go for long... exit when again another cross happen or rsi go below 40.for sell side watch for rsi below 40 and macd below zero line while crossover of kijun tenkan.
Better to use it with RSI+Macd Fast to get more accurate results.
#for better confirmation look value of VWAP and decide accordingly
Do back test before using it.
Happy Trading
Love INDyAN
#change line color as per ur wish but value should be same as it was default entered.
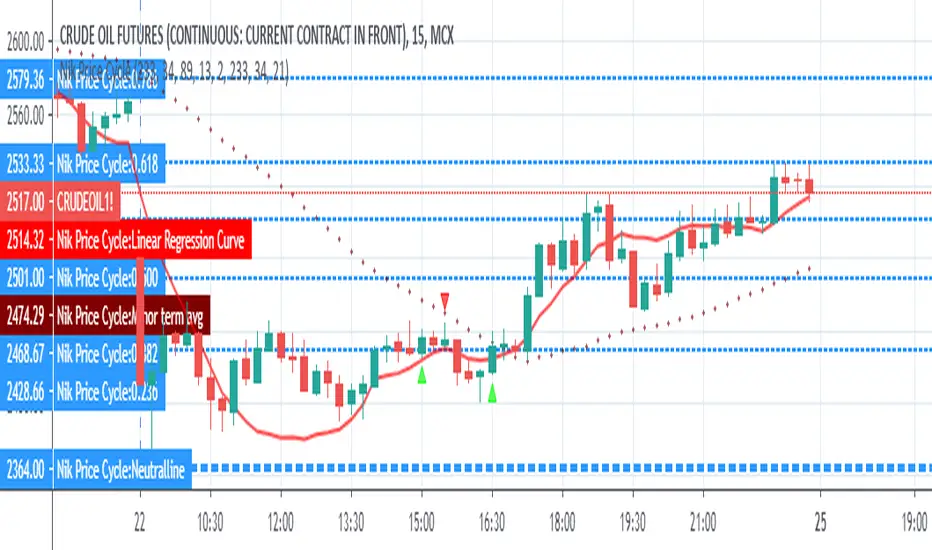
Nikesh Price CycleEvery Script has a pattern and it follows a cyclic movement which results into many small and big swings. We have tried to capture these cyclic pattern. Division line acts here as a pivot point which defines a holistic view of bulls and bear power. Price moving above division line indicates bullish trend and price moving below division line indicates bearish trend. Price scale bar defines trend momentum. when price crosses price scale bar with green scale bar colour it shows we should enter. we will keep on booking our profit on near next fib level. we will exit the trend once price candle crosses linear regression line. for safe entry in case of bulls entry-- price scale bar,linear regression line and mid avg term line should be below price candle. In case of bears entry--price scale bar,linear regression line and mid avg term line should be above price candle.

KINSKI Buy-Sell Signal"KINSKI Buy-Sell Signal" is an Average True Range (ATR) based trailing stop indicator.
In this version, you can change the ATR calculation method using the settings. The default method is hlc3. The HLC stands for High, Low, Close and the /3 divides the result by 3 to give you the average.
The indicator calculates the buy and sell signals using HLC3, Simple Moving Average ( SMA ) and the Exponential Moving Average ( EMA ) as soon as they cross. This indicator is useful with time intervals starting at 15m.
Have fun with it and be careful when buying and selling!
Example Chart:

Nik Price CycleEvery script follow a pattern in their price cycle. This can be defined by division of price cycle. Division line will act as pivot point.Above this bar this any price movement is indication of bullish trend while below this line any price movement is indication of bearish trend. This Nik price signal will give great result in combination of magicsignal which is also one of our developed signal. Although we have included various calculation for analysis purpose in this indicator. i suggest to go in setting and uncheck all channel lines and shapes for getting clear picture of trend and entry point. for more details on how to use this indicator people can message us
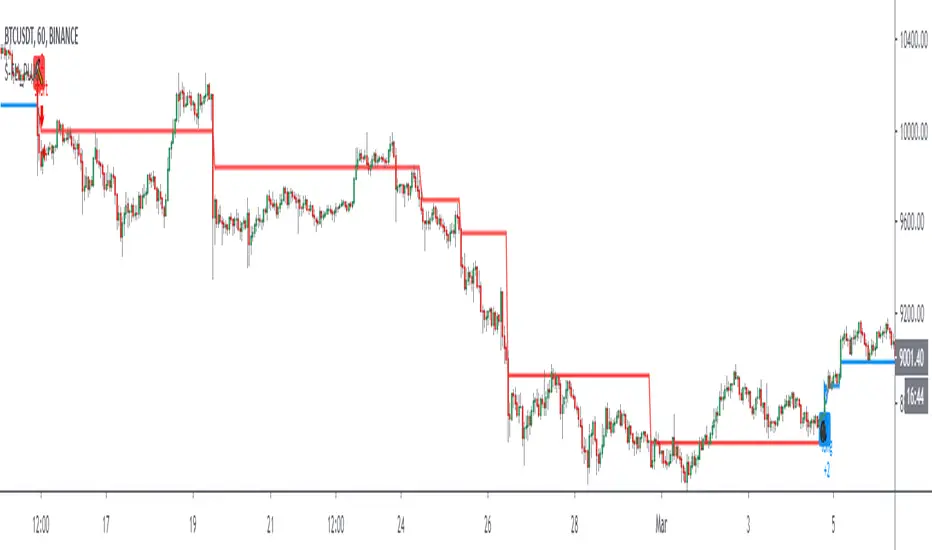
McMillan Volatility Bands w/ Buy & Sell Signals [optstrategist]BACKGROUND
McMillan Volatility Bands are an alternative approach to John Bollinger's "Bollinger Band" study and developed by world-renowned options trader and author Lawrence G. McMillan. Given his background in options trading, it was natural for Lawrence to approach any volatility-based study in the same manner options are priced --using Black-Scholes model. This model of pricing assumes a financial asset's volatility should be measured in percentage change rather than absolute value change.
OVERVIEW
The McMillan Volatility Bands indicator for TradingView will plot the 3 and 4-standard deviation bands around a 20-day moving average. This is how Larry has always used this system. The user can, however, change the standard deviation value as well as the moving average length to their preferred setting. This indicator can be used on any asset and on any timeframe.
Furthermore, the indicator will plot buy and sell signals based on a trading system used by Larry in his flagship newsletter publication The Daily Strategist. The system gives a signal when price closes outside the 4-sigma band and then closes back within the 3-sigma band. That 'signal bar' will be colored red or green for a sell or buy signal setup, respectively.
Finally, an arrow will be plotted on the chart where the system would actually enter the trade. This is determined when price trades a little beyond the extreme of the 'signal bar'. The level by which price has to go beyond the 'signal bar' is an input parameter and can be adjusted by the user. We've chosen the default value of 0.34. This means, the indicator will not give a buy or sell entry until the price moves: 1/3 x beyond the extreme signal bar. This is to prevent getting whipsawed by some setups that never really move in your favor. We've found it successfully removes the less-valuable trade setups.
PARAMETERS
ma_length => length of the moving average that the volatility bands work off of
outside_sigma => standard deviation of outer volatility band
inside_sigma => standard deviation of inner volatility band
entry_trigger_cushion => this refers to the percentage of the signal bar's range. The default value is 0.34. This means price will need to move 1/3 (~34%) of the signal bar's range beyond the high (for a buy) or low (for a sell) of the signal bar to trigger a buy/sell entry. This entry plots the arrow on the chart. We have found requiring this extra move in price eliminates many of the less-desirable signals at the expense of entering the better signals a little later.
WANT TO PURCHASE OR NEED MORE INFORMATION ON McMILLAN VOLATILITY BANDS?
Visit the link below to see purchasing options as well as screenshots of the indicator and how we trade it at McMillan Analysis Corp.

Ttaner_RSI ExinMerhaba arkadaşlar yapmış olduğum indikatör RSI alım ve satış bölgelerini gösterip işlem açmanızda yardımcı olacaktır.
Rsı yüksek bölgede kırmızı satış gelebilir ifade etmektedir.
Düşük bölgede ise yeşil güvenli alı ifade etmektedir.
Kullanacak arkadaşlara bol kazançlar diliyorum.
Destek olmak ve yeni indikatörler için takip edebilirsiniz.
Hello friends, the indicator I have made will help you to show the RSI buying and selling regions and open a transaction.
Rsi indicates that red sales may come in the high region.
In the low region, green means safe buying.
I wish good luck to the friends to use.
You can support and follow up for new indicators.

™TʀᴀᴅᴇCʜᴀʀᴛɪsᴛ Tʀᴇɴᴅsᴇᴛᴛᴇʀ™TradeChartist Trendsetter is an elegantly designed functional indicator that helps spot price trends based on user input and volatility to generate high probability BUY and SELL signals.
1. What does ™TradeChartist Trendsetter do?
Plots high probability BUY/SELL signals based on user input and price volatility.
Plots recommended Stop Loss and SOS signals.
Plots regular RSI divergences based on user input.
Plots Linear Regression trend lines based on user input.
Displays Trendsetter Dashboard with useful trade information.
Displays real time gains tracker.
Tracks another symbol on Dashboard based on user input.
Alerts when BUY and SELL signals are generated.
2. What markets can this indicator be used on?
Forex
Stocks - Signal prices calculated taking gaps into account.
Commodities
Cryptocurrencies
and almost any asset on Trading View.
Works really well when there is good volume, volatility or both in the asset traded/observed.
3. Do the indicator signals repaint?
No. Once the BUY and SELL signals are generated with entry price (open price of signal candle), there is no repainting.
This can be verified using Trading View Bar Replay to check if the signals stay in the same candle in real-time as the Bar Replay.
4. Does the indicator send alerts when a signal is generated?
Yes. Traders can get alerts by setting up Trading View alerts for BUY/SELL signals. For confirmed BUY/SELL alerts, 'Once Per Bar' must be used as there is no need to wait for the candle close.
Example Charts
GBP-USD 1hr chart with indicator plots description
GOLD 4hr chart using Daily HTF resolution from indicator settings.
SPX 15m chart using Daily HTF resolution with RSI divergences.
Note: Default settings work really well for most assets and time frames. Change HTF resolution (default 4hr) from indicator settings and make sure it is higher time frame than the chart resolution.

Strategy Follow Line MTF Any MM AverageThe objective is only to evaluate different configurations of the indicator "Follow Line MTF Any MM Average".
The strategy does not have position management, it's very basic, this indicator should be used to see trend, range zones, evaluate the best areas to enter the market, use higher time frames to confirm a direction can be useful.
I do not recommend using only this indicator to trade, because you can lose all your money if you do not know what you are doing.
I hope you find it useful.
Successes
Follow Line MTF Any MM AverageThe original version uses SMA, in this new version you can choose any type of MA and time frame.
- RMA,SMA,EMA,WMA,VWMA,SMMA,KMA,TMA,HullMA,DEMA,TEMA,CTI
- 1 min, 3 min, 5 min, 15 min, 30 min, 45min, 1h, 2h, 3h, 4h, 1d, 1w, 1M
- Alerts
Combine multiple time frames, this will come in handy ¡¡¡¡
Success in your trade ¡¡¡¡
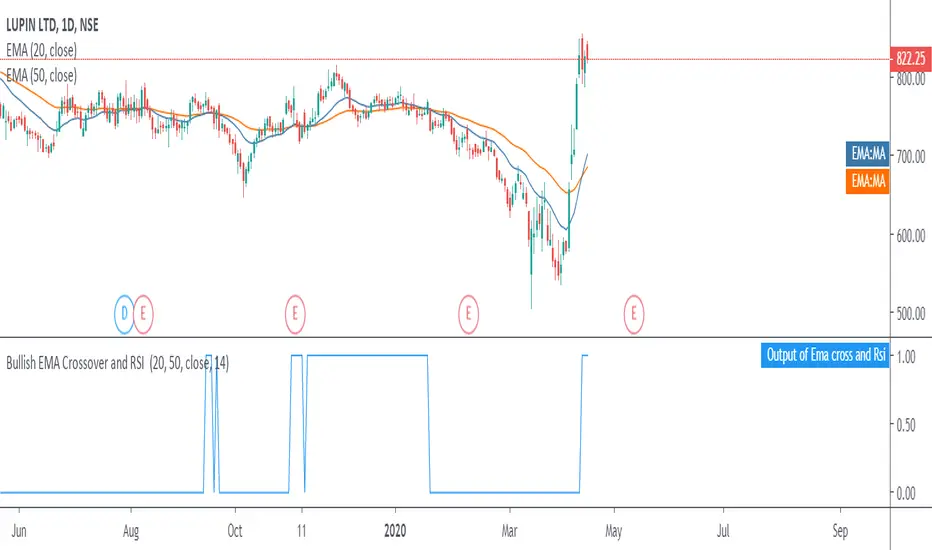
Moving Average Exponential crossover with bullish RSI signalsWhen the market is giving the signals for bullish trend, which shows the shorter period exponential(20) moving average crossing the longer period moving average(50), with a strength shown in the market i.e. RSI greater than 40.
So when all these conditions are met a buy signal is generated in output (Output of Ema cross and Rsi) having value as 1.
So a trader can enter into a long position when the value is 1 and exits a stock when value is 0.
This script is not to be used for selling the stocks in downtrend
Strategy Follow Line Indicator The objective is only to evaluate different configurations, I do not recommend using only this indicator to trade, because you can lose all your money if you do not know what you are doing.
I hope you find it useful.
Successes
