Candle Body RatioThis indicator is designed to calculate the percentage of the upper wick, the body, and the lower wick of the candle over which your cursor is positioned.
Candlestick analysis

Victoria Smart Overlay – EMA1/SMA3/SMA1Core Components:
EMA 1 (Micro): fastest trend trigger
SMA 3 (Short): trend confirmation
SMA 1 (Base): structure guide
Conditions and Actions:
EMA1 crosses above SMA3 → Uptrend starting → Consider Calls / Long
EMA1 crosses below SMA3 → Downtrend starting → Consider Puts / Short
Price hugging SMA1 → Neutral zone → Wait for breakout
Background Green → Confirmed Uptrend → Stay long or scalp Calls
Background Red → Confirmed Downtrend → Stay short or scalp Puts
Micro EMA + Heikin Ashi (Refined Swing Map)
Purpose: Filters fake moves and identifies strong momentum runs.
Use on 5m / 15m charts for intraday clarity.
Signals and Actions:
EMA1 > EMA3 > EMA5 → Micro-uptrend forming → Enter / hold Calls
EMA1 < EMA3 < EMA5 → Micro-downtrend forming → Enter / hold Puts
EMA lines tangled → No conviction → Wait
200-Day SMA rising → Macro bullish → Favor long trades
200-Day SMA falling → Macro bearish → Favor shorts

Victoria RSI Hybrid Pro – Momentum + Volume + DivergenceConditions and Actions:
RSI > 50 → Bullish regime → Consider Calls
RSI < 50 → Bearish regime → Consider Puts
RSI crosses up → Momentum shift up → Buy confirmation
RSI crosses down → Momentum shift down → Sell confirmation
RSI > 70 → Overbought → Take profits
RSI < 30 → Oversold → Watch for reversal
Bullish divergence → Hidden upward momentum → Reversal watch
Bearish divergence → Hidden downward momentum → Reversal watch
4. Multi-Indicator Confirmation Rules
Combine signals from EMA, SMA, RSI, and Volume to identify high-confidence trades.
Rules:
Triple Green → EMA1>SMA3, RSI>50, Volume Up → Buy Calls / Shares
Triple Red → EMA1 70 + Weak Volume → Exit Calls early
EMA1 flips direction + Strong Volume → Confirm bias immediately
RSI on 1H agrees with main chart → Trend continuation likely
6. Timeframes
Scalps: 1m–5m
Next-Day Options: 15m–1H
Swings: 4H–1D
7. Key Mindset Rules
Patience beats prediction. Wait for confirmations.
Volume confirms conviction, not direction.
If RSI and Overlay disagree → No trade.
Only act when 2 of 3 systems (EMA, RSI, Volume) align.

✅ Heikin Ashi Trend Reversal Confirmedusing the heikin ashi trend candles, this indicator can attempt to give buy and sell signals

ONLY LONG – 4H Breakout → 1H EMA(12/21) [Signals]🔹 ONLY LONG – 4H Breakout → 1H EMA(12/21)
Author: SystemsOverFeelings
Type: Signal-only indicator (non-repainting)
Timeframe: Designed for the 1H chart
Markets: BTCUSDT perpetual& major pairs
📖 Concept
A high-timeframe confirmation model for trend-continuation longs.
It detects:
A 4-Hour breakout candle closing above recent range highs,
With very-high volume confirmation, and
Then waits for a 1-Hour pullback into the EMA(12/21) band or a Break of Structure (BOS) to re-enter.
No repainting — all 4H logic uses request.security(..., lookahead_off) for confirmed data.
🧩 Signal Logic
✅ 4H Trigger: Breakout candle with volume > SMA(20) × user multiplier.
✅ Armed Regime: Green background = system ready for 1H entries.
🟢 LONG Signal: 1H candle consolidates inside or touches the EMA band, or shows BOS confirmation.
❌ EXIT Signal: 4H EMA(12) crosses below EMA(21).
All signals are visually marked and alert-ready.
⚙️ Adjustable Parameters
4H volume multiplier
Range lookback days
Pullback strictness (inside/touch)
1H BOS pivot length & mode
Expiry time for invalidated setups
🔔 Alerts
Built-in alerts for:
4H breakout trigger
1H long entry signal
4H band exit
Use them directly via “Create Alert → Condition → This Script → Choose Signal.”
💡 Notes
Works best on BTC/ETH 1H chart.
Non-repainting, multi-timeframe logic.
Use for directional bias or entry timing — not financial advice.

Quantura - Fair Value GapIntroduction
“Quantura – Fair Value Gap” is a precision-engineered institutional concept indicator designed to automatically identify, visualize, and manage Fair Value Gaps (FVGs) across any market or timeframe. It enables traders to observe price inefficiencies, potential liquidity voids, and retracement areas that often act as magnets for price rebalancing.
Originality & Value
Unlike many public FVG scripts that only highlight candle gaps, this indicator integrates dynamic filters and adaptive logic to determine the strength and reliability of each gap. It merges overlapping zones intelligently and optionally extends valid imbalances forward for ongoing reference.
Its value lies in:
Dynamic statistical filtering based on gap standard deviation.
Optional volume confirmation for high-confidence FVGs.
Automatic merging of overlapping or adjacent gaps for clean visualization.
Support for both bullish and bearish imbalances.
Signal alerts when gaps are filled or rebalanced by price.
Functionality & Core Logic
Detects Fair Value Gaps by comparing candle-to-candle price displacement.
Applies a Gap Filter (standard deviation-based) to qualify valid gaps.
Optionally validates gaps formed under significant volume conditions.
Draws color-coded boxes to mark bullish (discount) and bearish (premium) inefficiencies.
Monitors each FVG until price fills the gap, at which point the box is visually closed.
Provides optional signal markers (“▲” or “▼”) when rebalancing occurs.
Parameters & Customization
Gap Filter: Sets the minimum statistical deviation required for a valid FVG. Higher values detect fewer, stronger gaps.
Volume Filter: Toggles additional validation using relative volume strength.
Volume Sensitivity: Adjusts how much above-average volume must be present to confirm a gap.
Bullish/Bearish Colors: Customize color schemes for imbalance zones.
Extend Gaps: Optionally extend open gaps forward for better confluence tracking.
Signals: Enables or disables gap-fill signal markers.
Visualization & Display
Bullish FVGs: Appear in blue-tinted boxes, indicating potential demand-side inefficiencies.
Bearish FVGs: Appear in red-tinted boxes, representing potential supply-side inefficiencies.
Overlapping zones are merged automatically to maintain clarity.
Filled gaps remain visible for historical context, allowing for post-event analysis.
Optional signal arrows display when price returns to rebalance an FVG.
Use Cases
Identify institutional inefficiencies and liquidity voids.
Detect premium and discount levels in trending markets.
Combine with market structure or order block indicators for confluence.
Track when price rebalances inefficiencies to refine entry/exit points.
Build FVG-based algorithmic strategies that rely on structural imbalance resolution.
Limitations & Recommendations
The indicator detects structural imbalances but does not predict future direction or guarantee profitability.
Volume filters may behave differently across brokers due to data-source differences.
Use alongside structure or liquidity tools for enhanced decision-making.
Extreme volatility or illiquid assets may generate temporary invalid gaps.
Markets & Timeframes
Compatible with all markets (crypto, forex, equities, indices, futures) and all timeframes. Recommended for multi-timeframe confluence analysis — e.g., detecting higher-timeframe FVGs and refining lower-timeframe entries.
Author & Access
Developed 100% by Quantura. Published as a Open-source script indicator. Access is free.
Compliance Note
This description adheres fully to TradingView’s House Rules and Script Publishing Requirements . It provides a detailed explanation of originality, core logic, limitations, and appropriate use — with no unrealistic or misleading performance claims.

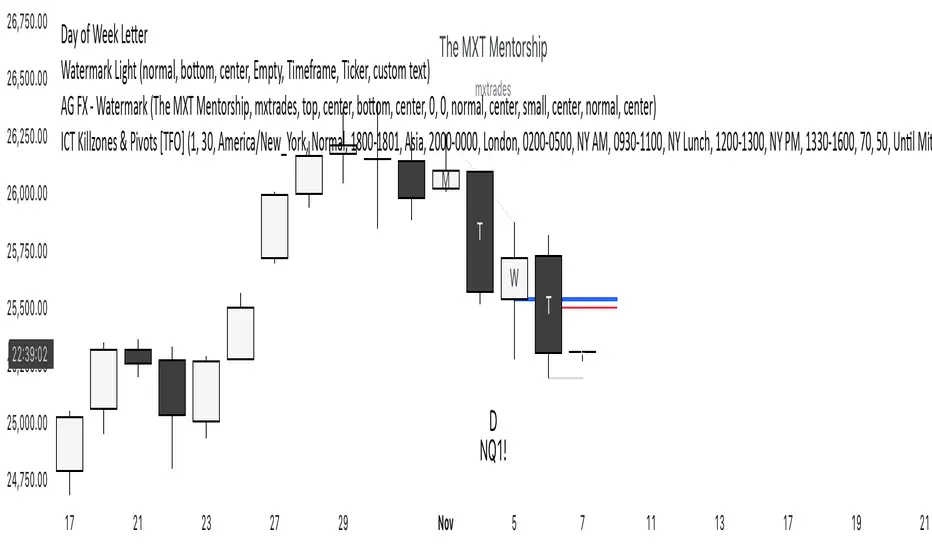
Day of Week LetterLetters printed on the Daily candle corresponding the day of the trading week it is on. Used for weekly range logic
Set it to 'bring to front' to see it
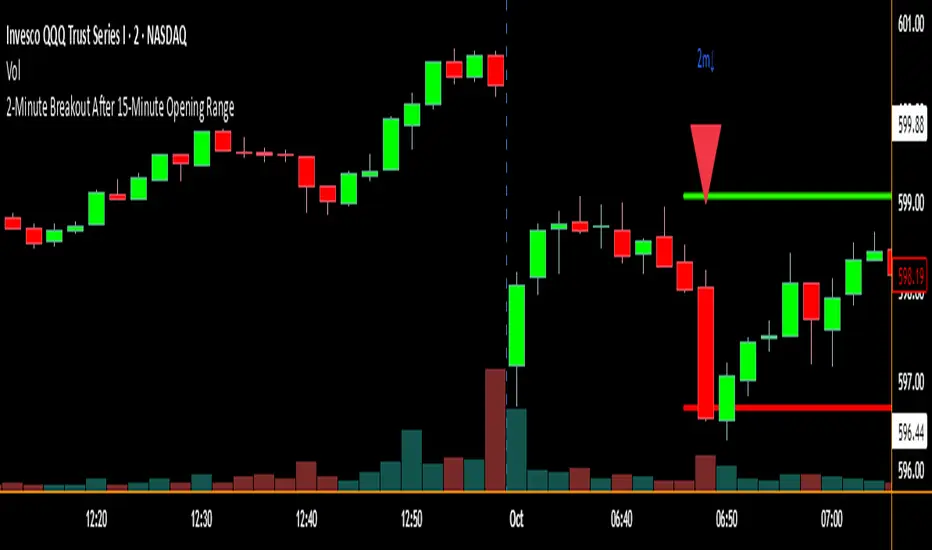
2-Minute Breakout After 15-Minute Opening RangeBreakout must happen before 8 am PST. I used Chat GPT to create this for me so I could do some backtesting on 15 min ORBs.
Pair Trade Beta Calculator (WORKING VERSION)wrote by chatgpt5, calucate the beta for pair trading
Asset A: The asset you would like to long
Assest B: The asset you would like to short

Close Below MAClose Below MA (SMA or EMA)
This indicator helps traders quickly identify when a candle closes below a moving average — a classic signal of potential bearish momentum or a shift in trend.
You can choose between Simple Moving Average (SMA) or Exponential Moving Average (EMA) from a convenient dropdown menu, and customize the MA length to fit your strategy.
When a candle closes below the selected MA, a small black arrow appears above the bar, and an alert can be triggered for instant notifications.
Features:
Choose between SMA or EMA.
Adjustable MA length.
Visual signal (arrow) when the close is below the selected MA.
Built-in alert support
Usage Ideas:
Spot early signs of a bearish reversal.
Use alerts for automated trade monitoring.

Predicta Futures – Scalping Predictor with Confidence FilterPredicta Futures is an advanced short-term forecasting indicator that combines historical pattern similarity analysis with weighted technical signals to predict price movements 1–10 minutes ahead.
**Core Functionality**
The script scans up to 5,000 historical bars to identify structurally similar price patterns. It aggregates forward outcomes from matched patterns and integrates real-time signals from RSI, MACD, Bollinger Bands, volume momentum, and volatility. A composite confidence score filters signals, displaying only those meeting the user-defined threshold (default ≥68%).
**Key Outputs**
- Buy/sell triangles with text labels
- Dashed projection line to predicted price
- Dotted target and ATR-based stop lines
- Info panel showing forecast direction, confidence %, expected move %, pattern count, order book status, and data access details
**Customization & Performance**
- Execution modes: Fast, Balanced, Accurate
- Adaptive sampling with recency bias option
- Filters for volatility and market hours
- Adjustable weights, lookback period, and prediction horizon
**Use Cases**
Scalping, intraday trading, futures, cryptocurrencies, equities.
*Order book metrics are simulated (platform limitation). Technical analysis tool; not financial advice.*

First 5-Min Candle High/Low by grantratcliff7Draws two pale yellow lines at the open and the close of the first 5 min candle of the trading session (9:35 EDT)

REJECTION DETECTOR🔥 CTR (Candle Terjepit - Rejection)
This indicator is specifically designed to detect Rejection Candles, which are moments when the price rejects a certain level and has the potential to form a strong reversal or rapid reaction — an important signal for scalpers and price action traders.
💡 Key Concept:
Rejection is a form of market reaction to areas of liquidity, support-resistance, or order block zones. Candles with long tails and small bodies indicate an imbalance between buyers and sellers, providing an early indication that the price may soon reverse.
⚙️ Key Features
🔍 Automatic Rejection Candle Detection (Buy & Sell)
🧠 Body-to-tail ratio filter for more precise signal validation
🎨 Customizable candle colors and appearance
📊 Suitable for all pairs and timeframes

VCP Detector it detects VCP before breakout,,,
⚡ How to Use
🕒 Timeframe:
15-min → Intraday contraction
Daily → Swing contraction
🟢 Green circles = VCP zones
→ price tightening, volume drying, volatility compressing.

Magik- OB findermarks Magic Orderblocks 15 min time frame... when price visits the ob go to 1 min tf.. after price makes a mss.. enter.. enjoy!!!

Market Structure Trailing Stop MTF [Inspired by LuxAlgo]# Market Structure Trailing Stop MTF
**OPEN-SOURCE SCRIPT**
*208k+ views on original · Modified for MTF Support*
This indicator is a direct adaptation of the renowned **Market Structure Trailing Stop** by **LuxAlgo** (original script: [Market Structure Trailing Stop ]()). The core logic remains untouched, providing dynamic trailing stops based on market structure breaks (CHoCH/BOS). The **only modification** is the addition of **Multi-Timeframe (MTF) support**, allowing users to apply the trailing stops and structures from **higher timeframes (HTF)** directly on their current chart. This enhances usability for traders analyzing cross-timeframe confluence without switching charts.
**Special thanks to LuxAlgo** for releasing this powerful open-source tool under CC BY-NC-SA 4.0. Your contributions to the TradingView community have inspired countless traders—grateful for the solid foundation!
## 🔶 How the Script Works: A Deep Dive
At its heart, this indicator detects **market structure shifts** (bullish or bearish breaks of swing highs/lows) and uses them to generate **adaptive trailing stops**. These stops trail the price while protecting profits and acting as dynamic support/resistance levels. The MTF enhancement pulls this logic from user-specified higher timeframes, overlaying HTF structures and stops on the lower timeframe chart for seamless multi-timeframe analysis.
### Core Logic (Unchanged from LuxAlgo's Original)
1. **Pivot Detection**:
- Uses `ta.pivothigh()` and `ta.pivotlow()` with a user-defined lookback (`length`) to identify swing highs (PH) and lows (PL).
- Coordinates (price `y` and bar index/time `x`) are stored in persistent variables (`var`) for tracking recent pivots.
2. **Market Structure Detection**:
- **Bullish Structure (BOS/CHoCH)**: Triggers when `close > recent PH` (break above swing high).
- If `resetOn = 'CHoCH'`, resets only on major shifts (Change of Character); otherwise, on all breaks.
- Sets trend state `os = 1` (bullish) and highlights the break with a horizontal line (dashed for CHoCH, dotted for BOS).
- Initializes trailing stop at the local minimum (lowest low since the pivot) using a backward loop: `btm = math.min(low , btm)`.
- **Bearish Structure**: Triggers when `close < recent PL`, mirroring the bullish logic (`os = -1`, local maximum for stop).
- Structure state `ms` tracks the break type (1 for bull, -1 for bear, 0 neutral), resetting based on user settings.
3. **Trailing Stop Calculation**:
- Tracks **trailing max/min**:
- On new bull structure: Reset `max = close`.
- On new bear: Reset `min = close`.
- Otherwise: `max = math.max(close, max)` / `min = math.min(close, min)`.
- **Stop Adjustment** (the "trailing" magic):
- On fresh structure: `ts = btm` (bull) or `top` (bear).
- In ongoing trend: Increment/decrement by a percentage of the max/min change:
- Bull: `ts += (max - max ) * (incr / 100)`
- Bear: `ts += (min - min ) * (incr / 100)`
- This creates a **ratcheting effect**: Stops move favorably with the trend but never against it, converging toward price at a controlled rate.
- **Visuals**:
- Plots `ts` line colored by trend (teal for bull, red for bear).
- Fills area between `close` and `ts` (orange on retracements).
- Draws structure lines from pivot to break point.
4. **Edge Cases**:
- Variables like `ph_cross`/`pl_cross` prevent multiple triggers on the same pivot.
- Neutral state (`ms = 0`) preserves prior `max/min` until a new structure.
### MTF Enhancement (Our Addition)
- **request.security() Integration**:
- Wraps the entire core function `f()` in a security call for each timeframe (`tf1`, `tf2`).
- Returns HTF values (e.g., `ts1`, `os1`, structure times/prices) to the chart's context.
- Uses `lookahead=barmerge.lookahead_off` for accurate historical repainting-free data.
- Structures are drawn using `xloc.bar_time` to align HTF lines precisely on the LTF chart.
- **Multi-Output Handling**:
- Separate plots/fills/lines for each TF (e.g., `plot_ts1`, `plot_ts2`).
- Colors and toggles per TF to distinguish HTF1 (e.g., teal/red) from HTF2 (e.g., blue/maroon).
- **Benefits**: Spot HTF bias on LTF entries, e.g., enter longs only if both TF1 (1H) and TF2 (4H) show bullish `os=1`.
This keeps the script lightweight—**no repainting, max 500 lines**, and fully compatible with LuxAlgo's original behavior when TFs are set to the chart's timeframe.
## 🔶 SETTINGS
### Core Parameters
- **Pivot Lookback** (`length = 14`): Bars left/right for pivot detection. Higher = smoother structures, fewer signals; lower = more noise.
- **Increment Factor %** (`incr = 100`): Speed of stop convergence (0-∞). 100% = full ratchet (mirrors max/min exactly); <100% = slower trail, reduces whipsaws.
- **Reset Stop On** (`'CHoCH'`): `'CHoCH'` = Reset only on major reversals (dashed lines); `'All'` = Reset on every BOS/CHoCH (tighter stops).
### MTF Support
- **Timeframe 1** (`tf1 = ""`): HTF for first set (e.g., "1H"). Empty = current chart.
- **Timeframe 2** (`tf2 = ""`): Second HTF (e.g., "4H"). Enables dual confluence.
### Display Toggles
- **Show Structures** (`true`): Draws horizontal lines for breaks (per TF colors).
- **Show Trailing Stop TF1/TF2** (`true`): Plots the stop line.
- **Show Fill TF1/TF2** (`true`): Area fill between close and stop.
### Candle Coloring (Optional)
- **Color Candles** (`false`): Enables custom `plotcandle` for body/wick/border.
- **Candle Color Based On TF** (`"None"`): `"TF1"`, `"TF2"`, or none. Colors bull trend green, bear red.
- **Candle Colors**: Separate inputs for bull/bear body, wick, border (e.g., solid green body, transparent wick).
### Alerts
- **Enable MS Break Alerts** (`false`): Notifies on structure breaks (bull/bear per TF) **only on bar close** (`barstate.isconfirmed` + `alert.freq_once_per_bar_close`).
- **Enable Stop Hit Alerts** (`false`): Triggers on stop breaches (long/short per TF), using `ta.crossunder/crossover`.
### Colors
- **TF1 Colors**: Bullish (teal), Bearish (red), Retracement (orange).
- **TF2 Colors**: Bullish (blue), Bearish (maroon), Retracement (orange).
- **Area Transparency** (`80`): Fill opacity (0-100).
## 🔶 USAGE
Trailing stops shine in **trend-following strategies**:
- **Entries**: Use structure breaks as signals (e.g., long on bullish BOS from HTF1).
- **Exits**: Trail stops for profit-locking; alert on hits for automation.
- **Confluence**: Overlay HTF1 (e.g., 1H) for bias, HTF2 (e.g., Daily) for major levels—enter LTF only on alignment.
- **Risk Management**: Lower `incr` avoids early stops in chop; reset on `'All'` for aggressive trailing.
! (i.imgur.com)
*HTF1 shows bullish structure (teal line), trailing stop ratchets up—long entry confirmed on LTF pullback.*
! (i.imgur.com)
*TF1 (blue) bearish, TF2 (red) neutral—avoid shorts until alignment.*
! (i.imgur.com)
*Colored based on TF1 trend: Green bodies on bull `os=1`.*
Pro Tip: Test on demo—pair with LuxAlgo's other tools like Smart Money Concepts for full structure ecosystem.
## 🔶 DETAILS: Mathematical Breakdown
On bullish break:
- Local min: `btm = ta.lowest(n - ph_x)` (optimized loop equivalent).
- Stop init: `ts = btm`.
- Update: `Δmax = max - max `, `ts_new = ts + Δmax * (incr/100)`.
Bearish mirrors with `Δmin` (negative, so decrements `ts`).
In MTF: HTF `time` aligns lines via `line.new(htf_time, level, current_time, level, xloc.bar_time)`.
No logs/math libs needed—pure Pine v5 efficiency.
## Disclaimer
This is for educational purposes. Not financial advice. Backtest thoroughly. Original by LuxAlgo—modify at your risk. See TradingView's (www.tradingview.com). Licensed under CC BY-NC-SA 4.0 (attribution to LuxAlgo required).

Candle PA Scanner (Engulfing / Inside / Pin) by BK SahniHere’s how to read the “Candle PA Scanner (Engulfing / Inside / Pin)” and what each input means.
What the signals look like on your chart
B-ENG (label above/below bar)
Bullish Engulfing → “B-ENG” below the bar (green/teal).
Bearish Engulfing → “B-ENG” above the bar (red).
IB (small orange dot at the top)
Inside Bar (compression). Use the mother bar’s high/low for the break.
PIN (triangle)
Bullish Pin → triangle below the bar (long lower wick; rejection of support).
Bearish Pin → triangle above the bar (long upper wick; rejection of resistance).
Treat these as price-action alerts, not automatic buy/sell signals. Act only when they occur at your levels (VWAP band, Fib 38.2–61.8, PDH/PDL, OB/FVG, etc.).
How to trade the prints (quick rules)
A) Bullish Engulfing at support
Context: at VWAP/VAL/0.5–0.618 Fib.
Entry: next candle above the engulfing high (or market order on close if volume/momentum confirm).
Stop: a tick below the engulfing low (or below the level).
Targets: mid/range, VWAP, prior swing; trail with Chandelier/ATR if trend extends.
B) Bearish Engulfing at resistance
Mirror the above: trigger below the engulfing low; stop above its high.
C) Inside Bar
It’s compression. Mark the mother bar’s high/low.
Trade the breakout in the direction of bias (above VWAP for longs, below for shorts).
If the break fails (closes back inside), often sets up a reversal—manage fast.
D) Pin Bar (rejection)
Enter on break of the pin’s body in the direction away from the wick.
Stop beyond the wick tip (invalidated if wick gets closed through).
Scale at VWAP/mid or the opposite range edge.
What the Inputs do (the panel you showed)
Inside Bar lookback (default 1)
How many bars back can be the mother bar.
Keep 1 for strict IB; raise to 2–3 to catch nested/compression patterns (more signals, a bit noisier).
Pin wick:body min ratio (default 2)
How long the rejection wick must be compared to the body.
Higher (2.5–3.0) = pickier, great in chop.
Lower (1.5–1.8) = more pins, useful in strong trends where wicks are shorter.
Min body % of range (0–1) (default 0.25)
Filters out dojis. The body must be at least 25% of the bar’s high-low range.
If you want to allow slimmer bodies (more pins/dojis), drop to 0.15–0.20.
If you want only decisive bodies, raise to 0.30–0.35.
Suggested tuning by market state
Trending / high momentum:
IB lookback 1, Pin ratio 1.8–2.2, Min body 0.20–0.25 (to catch more continuation entries).
Ranging / choppy:
IB lookback 2, Pin ratio 2.5–3.0, Min body 0.30 (fewer, higher-quality reversals).
A simple confluence checklist (use before clicking)
Signal printed at a level (VWAP band, Fib, PDH/PDL, OB/FVG)?
Bias aligned (above VWAP for longs, below for shorts) or you’re intentionally fading a range edge?
For engulfing: did it close through nearby minor structure?
For IB: are you trading the mother bar break, not just the small inside candle?
Risk defined: stop beyond wick/zone, target mapped (mid/VWAP/swing/extension).
Common pitfalls
Taking signals mid-range (low R:R).
Treating an IB as a reversal without a break/shift.
Buying a bullish pin that closed below your level (no acceptance).
Ignoring volatility—during news spikes, patterns fail more often.


Engulf After 2 Same-Dir Candles – Dashed Linethis will tell you when engulf happens after 2 consecutrive bvearsh candle happens

无敌大饺子缺口Indicator Name:Dumpling Price Action Gaps (Price Action Gaps)
Type: Price Action Indicator / Technical Analysis Tool
Applicable Markets: Stocks, Futures, Forex, Cryptocurrencies, and other charting markets
Timeframe: Any timeframe; supports multi-timeframe EMA smoothing
Indicator Overview
This indicator is a visual analysis tool based on Price Action and Fair Value Gaps (FVGs). It automatically identifies bullish and bearish gaps in the market, helping traders spot potential support and resistance areas, gap fill opportunities, and market sentiment turning points.
By combining EMA (Exponential Moving Average) and ATR (Average True Range) filtering, the indicator clearly plots on the chart:
Bullish Gaps: Highlight rapid upward price gaps.
Bearish Gaps: Highlight rapid downward price gaps.
Mitigation Zones: Mark areas where gaps are likely to be filled, assisting in judging potential price retracements.
Historical Gaps: Optionally display past gaps for multi-timeframe analysis.
Smoothed EMA20: Provides both current and multi-timeframe trend references to make gap analysis more reliable.
Key Features
Intelligent Gap Detection: Automatically identifies gap types by comparing the high and low of the current bar with the previous two bars.
Fair Value Filtering: Uses ATR to filter out insignificant gaps, reducing noise.
Visual Gap Fill Percentage: Displays the percentage of gap fill, helping traders gauge the strength of retracement.
Multi-Timeframe Smoothing: Supports current and 5-minute smoothed EMA to capture short-term trend impacts.
Flexible Across Timeframes: Suitable for intraday or swing trading strategies.
Use Cases
Support/Resistance Identification: Gap tops and bottoms can act as potential support or resistance levels.
Trend Continuation Confirmation: If price breaks through a gap without filling it, the trend is likely to continue.
Retracement Strategy: Gap fill zones can serve as potential entry or exit points for short-term trades.
Risk Management: Historical gaps help identify high-risk zones, optimizing stop-loss placement.
中文:
指标介绍
指标名称:无敌大饺子价格行为缺口(Dumpling Price Action Gaps)
类型:价格行为指标 / 技术分析工具
适用市场:股票、期货、外汇、加密货币等各类K线图市场
周期适用:任意时间周期,指标支持跨周期 EMA 平滑显示
功能概述
是一种基于价格行为(Price Action)和公允价值缺口(Fair Value Gap, FVG)的可视化分析工具。它通过自动识别市场中的看涨和看跌缺口,帮助交易者发现潜在的支撑与阻力区域、回补机会以及市场情绪转折点。
该指标结合了 EMA(指数移动平均)和 ATR(平均真实波幅)过滤,能够在图表上清晰绘制出:
看涨缺口(Bullish Gap):显示市场快速上涨形成的价格缺口。
看跌缺口(Bearish Gap):显示市场快速下跌形成的价格缺口。
回补区域(Mitigation Zone):标记缺口可能被回补的区域,辅助判断价格回调的概率。
历史缺口(Historical Gaps):可选择显示历史上形成的缺口,便于进行多周期分析。
平滑 EMA20(Smoothed EMA20):提供当前周期和跨周期的趋势参考,使缺口分析更加可靠。
核心特点
智能缺口识别:通过比较当前 K 线与前两根 K 线的高低价,自动判断缺口类型。
公允价值过滤:结合 ATR 值过滤掉微小缺口,避免噪音干扰。
可视化百分比显示:支持显示缺口回补的百分比,让交易者直观判断回补强弱。
跨周期平滑:可显示当前周期和平滑 5 分钟 EMA,帮助捕捉短期趋势与缺口冲击。
多周期适用:支持不同时间周期图表,可灵活应用于日内交易或波段策略。
使用场景
支撑/阻力判断:缺口上沿和下沿可以作为潜在支撑或阻力区域。
趋势延续确认:价格突破缺口并未回补时,表明趋势可能继续延续。
回调策略:当价格回补缺口至回补区域时,可作为短线交易的进出参考。
风险管理:历史缺口帮助交易者识别潜在高风险区域,优化止损设置。

✅ Market Maker Levels (v6 Labels + Prices, No Zones)this shows previous day and weeks high n low which helps in managing the trades to find support and resistance

X Tail that Wagsintraday session-framework and ETH-anchored VWAP tool for TradingView. It draws today’s OVN (ETH) high/mid/low, today’s RTH-day open, previous day open/high/low, and a carried ETH VWAP handle (yesterday’s 4:00 PM NY VWAP, projected forward) to give you a clean, non-repainting scaffold for bias, structure, and execution. All timestamps are New York–local with DST handled explicitly, so historical sessions align correctly across time changes.
Key Capabilities
ETH OVN Range (18:00 → 09:30 NY)
Captures the rolling overnight high/low and computes the mid; at 09:30 NY it locks those levels and extends them to 16:00 NY (same day).
Optional labels (size/color configurable) placed slightly to the right of the 4 PM timestamp for readability.
Daily Handles (Today & Previous Day)
Today’s open line starts at the ETH open (anchor preserved) and extends toward 4 PM NY (or up to the “current bar + 5 bars” cap), with label control.
Previous day open/high/low plotted as discrete reference lines for carry-over structure.
ETH-Anchored VWAP (Live) + Bands
ETH-anchored VWAP runs only during the active ETH session (DST-aware).
Optional VWAP bands (0.5×, 1.0×, 2.0× multipliers) plotted as line-break series.
Carried ETH VWAP Handle (PD 4 PM Snapshot)
At 16:00 NY, the script snapshots the final ETH VWAP value.
On the next ETH open, it projects that value as a static dashed line through the session (non-mutating, non-repainting), with optional label.
Labeling & Styling
Single-toggle label system with color and five sizes.
Per-line color/width controls for quick visual hierarchy.
Internal “tail” logic keeps right endpoints near price (open-anchored lines extend to min(4 PM, now + 5 bars)), avoiding chart-wide overdraw.
Robust Session Logic
All session boundaries computed in NY local time; DST rules applied for historical bars.
Cross-midnight windows handled safely (no gaps or misalignment around day rolls).
Primary Use Cases
Session Bias & Context
Use OVN H/M/L and today’s open to define structural bias zones before RTH begins. A break-and-hold above OVN mid, for example, can filter long ideas; conversely, rejection at OVN high can warn of mean reversion.
Carry-Forward Mean/Value Reference
The carried ETH VWAP (PD 4 PM) acts as a “value memory” line for the next day. Traders can:
Fade tests away from it in balanced conditions,
Use it as a pullback/acceptance gauge during trends,
Track liquidity grabs when price spikes through and reclaims.
Execution Planning & Risk
Anchor stops/targets around PD H/L and OVN H/M/L for well-defined invalidation.
Combine with your entry model (order-flow, momentum, or pattern) to time fades at range extremes or momentum breaks from OVN mid.
Confluence Mapping
Layer the tool with opening range tools, HTF zones, or profile/VWAPs (weekly/daily) to spot high-quality confluence where multiple references cluster.
Regime & Day-Type Read
Quickly see whether RTH accepts/rejects the OVN range or gravitates to PD VWAP handle, helping classify the day (trend, balanced, double-distribution, etc.).
Quick Start
Apply to your intraday chart (any instrument supported by TradingView; best on ≤15m for live intraday context).
In Current Day group, keep Open and OVN HL on; optionally display the mid.
In Previous Day group, enable PD Open/HL for carry-over levels.
Enable AVWAP if you want live ETH-anchored VWAP and its Bands for distance context.
Keep PD VWAP on to project yesterday’s 4 PM ETH VWAP as a static dashed line into today.
Use the Label group to size/color the on-chart tags.
Settings Overview (Plain-English)
Label: Toggle labels on/off; choose label text color and size.
Current Day:
Open (color/width) — daily open line anchored at ETH open.
OVN HL (and Mid) — overnight high/low and midpoint, locked at 09:30 and extended to 16:00.
AVWAP + Bands — ETH-anchored VWAP with optional 0.5×/1×/2× bands.
Previous Day:
PD Open/HL — yesterday’s daily handles.
PD VWAP — the carried snapshot of yesterday’s 4 PM ETH VWAP projected forward (dashed).
Notes & Best Practices
Time Zone: All session logic is hard-coded to America/New_York and DST-robust. No manual DST tweaks required.
Non-Repainting: The carried PD VWAP line is a snapshot; once drawn, it does not back-fill or mutate.
Intraday Use: Designed for intraday execution. It will display on higher TFs, but the session granularity is most informative at ≤15m.
Performance: Script caps lines/labels (500) and uses short “tails” to keep charts responsive.
Compatibility: Uses request.security(..., "D", series, lookahead_on) intentionally to lock daily handles early for planning; this is by design.
Typical Playbook Examples
Fade Extremes in Balance: As RTH opens inside OVN, look for rejection wicks at OVN High with confluence from PD VWAP handle overhead; risk above OVN High.
Trend Continuation: In directional sessions, acceptances above OVN Mid with price pulling back to the live ETH VWAP can offer continuation entries.
Reversion to Value: Sharp extensions away from the carried PD VWAP that quickly stall often revert to that handle; use it as a target or as an acceptance test.
