Trading Sessions High/Low Zones The BestHiển thị toàn bộ session zone, có tùy chọn các ngày cần hiển thị gần nhất.
Hỗ trợ tốt hơn :)
Candlestick analysis

Wp's Vector CandlesVector Candles are special, color-coded candlesticks that highlight significant market activity, showing intense buying/selling (climax), institutional entry, momentum shifts, or potential reversals by analyzing high volume and large price ranges (spreads). They transform normal charts to instantly spot areas of extreme participation (bullish green/blue, bearish red/violet) versus standard conditions (gray), helping traders see market dynamics beyond just price.

EMA Divergence Color CandlesThis indicator colors candles based on their position relative to the EMA and the strength of the divergence.
Above EMA → Blue (bullish zone)
Below EMA → Red (bearish zone)
Divergence strength is shown in 3 color levels:
Weak (close to EMA)
Medium
Strong (far from EMA)
The indicator draws its own candles, so no TradingView settings need to be changed.
The EMA line is also shown on top of the custom candles.

Zero Lag EMA_BhavatThis is a test script for zelma. This is intended to cut down the lag from traditional ema indicators.

VAPO OsilatorThe Real Map of Buying and Selling Pressure.
VAPO Advanced is fundamentally different from conventional oscillators that only measure momentum based on price. By integrating Volume and price movement (Pressure), it quantitatively maps the true buying and selling pressure in the market.
How It Works and What Are Its Advantages?
1. Core Pressure Measurement
Logic: The oscillator interprets high-volume price increases as strong buying pressure (+P) and high-volume price decreases as strong selling pressure (-P). Low-volume moves weaken the signal strength.
Benefit: This effectively filters out misleading signals caused by "fake" price movements (manipulation or low-volume spikes). It only displays momentum shifts that are supported by volume.
2. Dynamic Signal Line and Histogram
Signal Line: Provides a dynamic signal line smoothed by your choice of Moving Average type (EMA, SMA, WMA).
Histogram: Shows the difference between the VAPO line and the Signal line. A zero-line crossover of the histogram is the clearest signal that pressure is shifting direction. As the Green histogram grows, Buying Pressure accelerates; as the Red histogram grows, Selling Pressure accelerates.
3. Reliable Confirmation Tool
VAPO serves as an excellent confirmation tool when used alongside your primary trend indicators. For instance, when a trend indicator gives a BUY signal, VAPO crossing above the zero line (positive pressure) significantly increases the reliability of that signal.
⚠️ DISCLAIMER: THIS IS NOT FINANCIAL ADVICE. ALL INFORMATION PROVIDED IS FOR EDUCATIONAL AND ANALYTICAL PURPOSES ONLY.
YASAL UYARI: BU BİR YATIRIM TAVSİYESİ DEĞİLDİR. SUNULAN TÜM BİLGİLER YALNIZCA EĞİTİM VE ANALİZ AMAÇLIDIR.

Momentum Candle by DNDFXMomentum Candle v2 is a simple yet powerful indicator designed to detect strong momentum candles based on candle body size and the ratio between the body and total wick.
This indicator is ideal for traders who focus on:
Momentum trading
Breakout strategies
XAUUSD (Gold) scalping
Supply & Demand / Smart Money Concepts (SMC) confirmation
🔧 How the Indicator Works
The indicator analyzes each candle and classifies it as a Bullish Momentum or Bearish Momentum candle when these conditions are met:
✅ The candle body exceeds the minimum size
✅ The total wick is smaller compared to the body
✅ The Body-to-Wick ratio meets the strength filter
Visual signals include:
Green background for bullish momentum
Red background for bearish momentum
Up/Down triangle markers as entry guidance
⚙️ Customizable Parameters
Min Body Size (Points) – Sets the minimum candle body size
Min Body : Wick Ratio – Controls how dominant the body is compared to the wicks
All parameters can be optimized according to your trading style and timeframe.
✅ Best Use Cases
This indicator is useful for:
Breakout confirmation
Momentum validation
Filtering false breakouts
Scalping and intraday trading on XAUUSD
🧠 Trading Tips
For better accuracy, combine this indicator with:
Support & Resistance
Supply & Demand zones
Break of Structure (BOS) / CHoCH
Best performance on M5 – H1 timeframes.
⚠️ DISCLAIMER
This indicator is a supporting tool, not a guaranteed profit system. Always apply proper risk management. You are fully responsible for your trading decisions.

OI & CVD Master: Market Microstructure Analyzer🇬🇧 English Description
Introduction
Price action tells you where the market went, but Volume and Open Interest (OI) tell you why it went there. This indicator combines Open Interest (OI) and Cumulative Volume Delta (CVD) to visualize market microstructure. By analyzing the correlation between money flow (OI) and buying/selling pressure (CVD), it categorizes the market into 4 distinct states, helping traders identify institutional intent.
How it Works (The Logic)
The script compares the percentage change of smoothed OI and CVD against a filter threshold to determine the current regime:
🟢 Long Build (Aggressive Buying):
Logic: CVD ↗️ AND OI ↗️
Meaning: Traders are aggressively buying to open new long positions. Strong bullish signal.
🔴 Short Build (Aggressive Selling):
Logic: CVD ↘️ AND OI ↗️
Meaning: Traders are aggressively selling to open new short positions. Top formation or bearish continuation.
🔵 Short Liquidation (Short Squeeze):
Logic: CVD ↗️ AND OI ↘️
Meaning: Price is rising because shorts are closing positions (buying back), not because of new bulls. Often leads to a reversal after the squeeze.
🟠 Long Liquidation (Panic Selling):
Logic: CVD ↘️ AND OI ↘️
Meaning: Price is dropping because longs are closing positions (stop losses hit). A "Long Squeeze" or "Long Puke."
Key Features
Auto-OI Detection: Automatically finds the correct _OI or _P_OI ticker for the current chart (best for Crypto Futures).
Dual CVD Modes:
Real CVD: Connects to external data sources if available.
Simulated CVD (Optimized): A proprietary algorithm that estimates buy/sell pressure based on candle shape (OHLC) and volume, specifically weighted for Doji candles.
Data Dashboard: A table displaying real-time values, change rates, and the current market state.
Visual Overlay: Background colors change dynamically to reflect the market state.
Usage Tips
Best Timeframes: 15m, 1h, 4h.
Symbol: This indicator works best on Perpetual Futures contracts (e.g., BTCUSDT.P), as Spot markets do not have Open Interest data.
Threshold: Adjust the Threshold % setting to filter out noise in low-volatility markets.
🇨🇳 中文说明
简介
价格告诉我们市场去了哪里,而持仓量(OI)和成交量告诉我们市场为什么去那里。本指标结合了 持仓量 (Open Interest) 和 累积成交量增量 (CVD),旨在分析市场的微观结构。通过分析资金流向(OI)与买卖压力(CVD)之间的相关性,将市场划分为 4 种状态,帮助交易者识别主力资金的真实意图。
核心逻辑 (如何解读)
脚本计算平滑后的 OI 和 CVD 变化率,并根据以下逻辑判断市场状态:
🟢 多头建仓 (Long Build):
逻辑: CVD 上升 ↗️ + OI 上升 ↗️
含义: 资金主动买入开多。这是最强的看涨信号,表明有新资金进场推升价格。
🔴 空头建仓 (Short Build):
逻辑: CVD 下降 ↘️ + OI 上升 ↗️
含义: 资金主动卖出开空。通常出现在顶部或下跌中继,表明大户正在吸筹做空。
🔵 空头平仓 (Short Liquidations / 逼空):
逻辑: CVD 上升 ↗️ + OI 下降 ↘️
含义: 价格上涨是因为空头止损离场(被动买入),而非多头主动买入。这种上涨通常不可持续。
🟠 多头平仓 (Long Liquidations / 多杀多):
逻辑: CVD 下降 ↘️ + OI 下降 ↘️
含义: 价格下跌是因为多头止损离场(被动卖出)。通常发生在剧烈回调或崩盘中。
主要功能
智能 OI 获取: 自动识别当前交易对并尝试获取 _OI 或 _P_OI 数据(适用于加密货币合约)。
双模式 CVD:
外部源: 支持输入特定代码获取真实 CVD。
模拟算法: 内置优化的估算算法,根据 K 线形态(OHLC)和成交量加权计算买卖压力,比单纯的 Up/Down Volume 更精准。
信息面板: 图表右上方实时显示当前 CVD、OI 数值、变化率及市场状态。
视觉增强: 背景颜色随市场状态动态变化,直观展示多空博弈结果。
使用建议
适用市场: 请在 永续合约 图表上使用(如 BTCUSDT.P),只有合约才有持仓量数据。
参数调整: 如果市场震荡剧烈,可适当调大“变化阈值%”以过滤噪音信号。

Candlestick Pattern Identifier (Extended + Alerts)Candlestick Pattern Identifier (Extended + Alerts)


Effort per 1% Move (Normalized Columns)This indicator Shows a Normalized "effort" needed to move a certain assets price by 1 percent.
Used correctly, this can help in visualizing manipulation and shows a certain chance of a candle turning to a swing point.

Koushik_BBEMAJust a combination of BB and EMA. An easy way to immediately add bollinger band and multiple ema to your chart.

5MA+スーパートレンド + Disparity Scalping (SIMPLE FILTER)5MA + ATR Trend Filter + Disparity Scalping
This indicator combines a five-EMA trend framework, an ATR-based trailing trend line, a volatility breakout detector, and an ultra-fast scalping module using RSI and custom momentum prediction.
It is designed for both trend continuation and rapid reversal trading.
🔹 Main Components
1️⃣ Five-EMA Trend Framework
Uses 9 / 20 / 50 / 100 / 200 EMAs
Identifies short-term and long-term market direction
Provides dynamic support and resistance
Helpful for determining breakout vs. pullback conditions
2️⃣ ATR-Based Trailing Trend Line
Uses ATR multiplier to build a trailing stop line
Color change indicates directional shift
Works as a trend filter or trailing stop reference
Helps avoid counter-trend trades during strong trends
3️⃣ High-Volatility Breakout Detector (Optimized for Fast Markets)
Uses ATR expansion, Bollinger band breakout, and volatility comparison (HV vs RV)
Detects sudden market acceleration
Generates breakout BUY/SELL signals when volatility pressure aligns with direction
Useful for explosive markets such as gold or crypto, but compatible with all assets
4️⃣ Ultra-Fast Disparity Scalper
Measures price distance from EMA5 and EMA10
Uses RSI for exhaustion filtering
Predicts momentum turns with a custom RVI-based algorithm
Generates early reversal BUY/SELL signals before full market reaction
Designed for scalping in high-speed environments
5️⃣ Simple Overheat Filter
Blocks trades in extremely overbought/oversold zones
Gray signals indicate low-quality trade setups to avoid
Helps remove “chasing” entries during excessive deviation
🎯 Best Use Cases
Scalping fast reversals
Entering trends after confirmed volatility breakouts
Filtering entries during extreme overbought/oversold phases
Combining EMA structure with breakout momentum
⚠️ Important Notice
This tool is designed to support decision making, not guarantee trade results.
For best performance, combine with:
Price action (market structure)
Volume/volatility context
Support and resistance analysis
🏷️ Short Description (for compact summary)
Five-EMA trend structure with ATR trailing filter, volatility breakout detection, and ultra-fast scalping using RSI + momentum prediction. Suitable for both rapid reversals and trend continuation setups.

5MA+TrendMagic + Disparity Scalping (SIMPLE FILTER)5MA + Trend Filter + Disparity Scalping
This multi-purpose indicator combines a five-EMA trend structure, a volatility-based trend filter, and an ultra-fast scalping module to detect both trend continuation and sharp reversal opportunities.
It is suitable for scalping, day trading, and trend-following strategies.
🔹 Main Components
1️⃣ Five-EMA Trend Structure
Displays 9 / 20 / 50 / 100 / 200 EMA levels
Helps identify short-term and long-term market direction
Useful for support and resistance during trending markets
2️⃣ Volatility-Driven Trend Filter
Uses CCI and ATR to form a dynamic trailing line
The line switches color based on momentum direction
Can act as a trailing stop or trend confirmation filter
Helps avoid counter-trend entries
3️⃣ High-Volatility GOLD Signal
Detects sudden volatility expansions using ATR, Bollinger metrics, and volatility comparison (HV vs RV)
Marks rapid breakout situations with potential continuation setups
Available for all assets, optimized for highly volatile markets
4️⃣ Ultra-Fast Disparity Scalper
Measures price deviation from EMA5 and EMA10
Confirms exhaustion using RSI + momentum prediction from a custom RVI model
Generates early BUY/SELL reversal markers
Detects momentum shifts before price fully reacts
5️⃣ Simple Overheat Filter
Prevents trades in extremely overbought/oversold zones
Gray-colored signals indicate unsafe trades to avoid
🎯 Best Use Cases
Catching early reversals during fast movement
Identifying strong trend continuation after volatility expansion
Avoiding low-probability scalps in overheated conditions
Applying EMA structure for confluence with price action
⚠️ Note
This indicator is a decision-support tool, not a standalone signal generator.
For best precision, combine with:
Market structure
Volume analysis
Support / resistance levels
🏷️ Short Description (for compact field)
Multi-function tool combining 5EMA structure, volatility-based trend filtering, and ultra-fast reversal scalping using RSI + custom RVI momentum. Ideal for both trend continuation and rapid reversals.

ATR + BJ Signal(GOLD)This script visualizes a price-based counting pattern that highlights potential market exhaustion and reversal areas.
When a series of candles continues in one direction, the indicator measures price momentum loss and marks possible turning points.
Features
Counts consecutive upward or downward price movement
Highlights possible exhaustion or reversal areas
Optional alerts, take-profit and stop-loss visual levels
Fully customizable colors and display settings
Useful as a confirmation tool with trend or volume indicators
This indicator is designed to assist decision-making, not to generate mechanical buy/sell signals.
Best used together with other trend or volatility tools.
📎 Short Description (for compact field)
Counts consecutive price movement to highlight potential market exhaustion and reversal zones.
Helps identify when strong trends may be weakening.

CISD Trend Candle - EMA + Always MACDThis indicator combines trend detection using EMA with constant MACD cross signals to provide a clear visual understanding of market direction and potential entry/exit points.
■ 1. Trend Detection with EMA (Candle Coloring)
Calculates an EMA (default: 21).
Checks whether the last n candles (default: 5):
Close above the EMA → Uptrend (Blue candles)
Close below the EMA → Downtrend (Red candles)
Otherwise → Neutral (Gray candles)
Candle colors automatically change to show the current market trend at a glance.
■ 2. Always-Visible MACD Golden/Dead Cross Signals
Based on MACD settings (12, 26, 9)
Golden Cross → Blue upward triangle below the bar
Dead Cross → Red downward triangle above the bar
Signals are always displayed, regardless of trend state, making them useful for timing entries and exits.
■ 3. EMA Line Display
The EMA used for trend detection is plotted as an orange line.
🎯 Ideal Use Cases
This indicator is designed for traders who want to:
Quickly visualize trend direction through candle colors
Always monitor MACD cross signals
Improve decision-making with simple, intuitive visual cues

Momentum Marks - Buy and Sell IndicatorsIndicator Overview
This tool is a multi‑factor entry signal system designed to highlight potential BUY and SHORT opportunities directly on the chart with hard‑anchored labels. It combines trend, momentum, volatility, and volume conditions to reduce noise and provide more reliable trade signals.
Core Components
- EMA Trend Filter
- Uses a fast EMA (9) and a slow EMA (21) to determine short‑term vs. medium‑term trend direction.
- Signals only trigger when price aligns with the EMA relationship (e.g., fast above slow for shorts, fast below slow for buys).
- RSI Extremes
- RSI thresholds (default 65/35) ensure signals occur only when momentum is stretched into overbought or oversold zones.
- Helps avoid false triggers during neutral conditions.
- Linear Regression Channel
- A regression line with ±2 standard deviation bands defines dynamic support and resistance.
- Signals require price to be near the top (for shorts) or bottom (for buys) of the channel, adding a structural filter.
- TTM Squeeze Histogram
- Measures momentum shifts by comparing price to its EMA.
- Signals require histogram confirmation: weakening momentum for shorts, strengthening momentum for buys.
- Volume Confirmation
- Volume must fade for shorts or surge for buys relative to a 20‑period average.
- Ensures signals align with participation strength.
Visual Output
- Red “SHORT” label above bars when all short conditions align.
- Green “BUY” label below bars when all buy conditions align.
- Optional plotshape arrows (triangles) as backup markers.
- Linear regression channel shaded between upper and lower bands.
- EMA lines plotted for trend context.
Key Features
- Hard‑anchored labels: Signals are locked to confirmed bars, preventing repainting or shifting.
- Multi‑layer confirmation: Requires trend, momentum, volume, and structure to align before firing.
- Customizable inputs: Users can adjust EMA lengths, RSI thresholds, regression length, and squeeze parameters.

Alson Chew PAM EXE and Mother BarIndicators for strategies taught by Alson Chew's Price Action Manipulation (PAM) course
Two functions.
First it identifies EXE bars (Pin, Mark, Icecream bars).
Second it identifies Mother bars and draws an extension line for 6 bars.
Applicable to all time frames and can customise how many signals to show.
To be used in conjunction with trading strategies like
- 20 SMA, 50 SMA, 200 SMA FS formation
- Force Bottom, Force Top FS formation
- UR1 and DR1 using EXE Bar

Volume Orderblock Breakout — Naaganeunja Lite v3.6Volume orderblocks breakout indicator
you can use it 5minutes (short trading)
or 4 hours(swing trading)
it is best indicator in the world

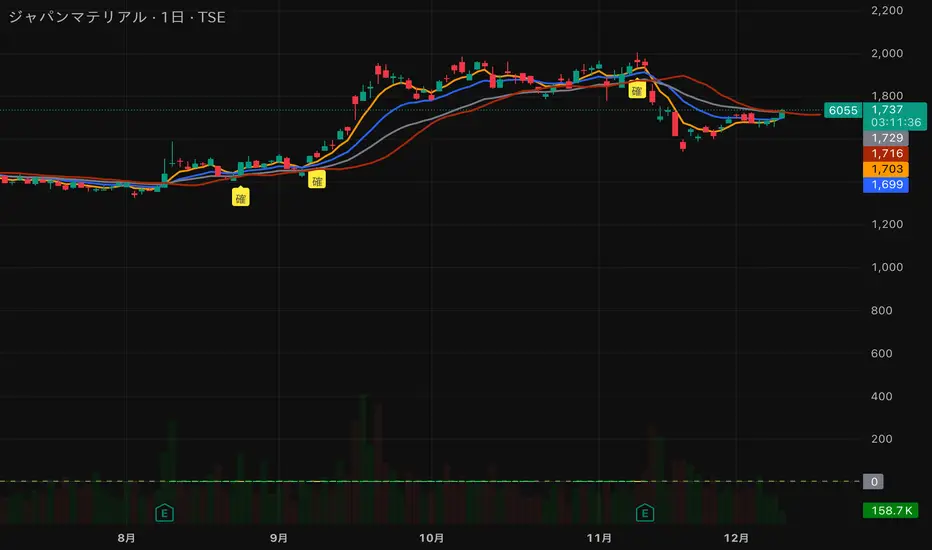
猛の掟・初動完成版//@version=5
indicator("猛の掟・初動スクリーナー_完成版", overlay=true)
// =============================
// 入力パラメータ
// =============================
emaLenShort = input.int(5, "短期EMA", minval=1)
emaLenMid = input.int(13, "中期EMA", minval=1)
emaLenLong = input.int(26, "長期EMA", minval=1)
macdFastLen = input.int(12, "MACD Fast", minval=1)
macdSlowLen = input.int(26, "MACD Slow", minval=1)
macdSignalLen = input.int(9, "MACD Signal", minval=1)
macdZeroTh = input.float(0.2, "MACDゼロライン近辺とみなす許容値", step=0.05)
volMaLen = input.int(5, "出来高平均日数", minval=1)
volMinRatio = input.float(1.3, "出来高倍率(初動判定しきい値)", step=0.1)
volStrongRatio = input.float(1.5, "出来高倍率(本物/三点シグナル用)", step=0.1)
highLookback = input.int(60, "直近高値の参照本数", minval=10)
pullbackMin = input.float(5.0, "押し目最小 ", step=0.5)
pullbackMax = input.float(15.0, "押し目最大 ", step=0.5)
breakLookback = input.int(15, "レジブレ後とみなす本数", minval=1)
wickBodyMult = input.float(2.0, "ピンバー:下ヒゲが実体の何倍以上か", step=0.5)
// ★ シグナル表示 ON/OFF
showMou = input.bool(true, "猛シグナルを表示")
showKaku = input.bool(true, "確シグナルを表示")
// =============================
// 基本指標計算
// =============================
emaShort = ta.ema(close, emaLenShort)
emaMid = ta.ema(close, emaLenMid)
emaLong = ta.ema(close, emaLenLong)
= ta.macd(close, macdFastLen, macdSlowLen, macdSignalLen)
volMa = ta.sma(volume, volMaLen)
volRatio = volMa > 0 ? volume / volMa : 0.0
recentHigh = ta.highest(high, highLookback)
prevHigh = ta.highest(high , highLookback)
pullbackPct = recentHigh > 0 ? (recentHigh - close) / recentHigh * 100.0 : 0.0
// ローソク足
body = math.abs(close - open)
upperWick = high - math.max(open, close)
lowerWick = math.min(open, close) - low
// =============================
// A:トレンド条件
// =============================
emaUp = emaShort > emaShort and emaMid > emaMid and emaLong > emaLong
goldenOrder = emaShort > emaMid and emaMid > emaLong
aboveEma2 = close > emaLong and close > emaLong
trendOK = emaUp and goldenOrder and aboveEma2
// =============================
// B:MACD条件
// =============================
macdGC = ta.crossover(macdLine, macdSignal)
macdNearZero = math.abs(macdLine) <= macdZeroTh
macdUp = macdLine > macdLine
macdOK = macdGC and macdNearZero and macdUp
// =============================
// C:出来高条件
// =============================
volInitOK = volRatio >= volMinRatio // 8条件用
volStrongOK = volRatio >= volStrongRatio // 三点シグナル用
volumeOK = volInitOK
// =============================
// D:ローソク足パターン
// =============================
isBullPinbar = lowerWick > wickBodyMult * body and lowerWick > upperWick and close >= open
isBullEngulf = close > open and open < close and close > open
isBigBullCross = close > emaShort and close > emaMid and open < emaShort and open < emaMid and close > open
candleOK = isBullPinbar or isBullEngulf or isBigBullCross
// =============================
// E:価格帯(押し目&レジブレ)
// =============================
pullbackOK = pullbackPct >= pullbackMin and pullbackPct <= pullbackMax
isBreakout = close > prevHigh and close <= prevHigh
barsSinceBreak = ta.barssince(isBreakout)
afterBreakZone = barsSinceBreak >= 0 and barsSinceBreak <= breakLookback
afterBreakPullbackOK = afterBreakZone and pullbackOK and close > emaShort
priceOK = pullbackOK and afterBreakPullbackOK
// =============================
// 8条件の統合
// =============================
allRulesOK = trendOK and macdOK and volumeOK and candleOK and priceOK
// =============================
// 最終三点シグナル
// =============================
longLowerWick = lowerWick > wickBodyMult * body and lowerWick > upperWick
macdGCAboveZero = ta.crossover(macdLine, macdSignal) and macdLine > 0
volumeSpike = volStrongOK
finalThreeSignal = longLowerWick and macdGCAboveZero and volumeSpike
buyConfirmed = allRulesOK and finalThreeSignal
// =============================
// 描画
// =============================
plot(emaShort, color=color.new(color.yellow, 0), title="EMA 短期(5)")
plot(emaMid, color=color.new(color.orange, 0), title="EMA 中期(13)")
plot(emaLong, color=color.new(color.blue, 0), title="EMA 長期(26)")
// シグナル表示(ON/OFF付き)
plotshape(showMou and allRulesOK, title="猛の掟 8条件クリア候補", location=location.belowbar, color=color.new(color.lime, 0), text="猛")
plotshape(showKaku and buyConfirmed, title="猛の掟 最終三点シグナル確定", location=location.belowbar, color=color.new(color.yellow, 0), text="確")
// =============================
// アラート条件
// =============================
alertcondition(allRulesOK, title="猛の掟 8条件クリア候補", message="猛の掟 8条件クリア候補シグナル発生")
alertcondition(buyConfirmed, title="猛の掟 最終三点シグナル確定", message="猛の掟 最終三点シグナル=買い確定")

猛の掟・初動スクリーナー v3//@version=5
indicator("猛の掟・初動スクリーナー v3", overlay=true)
// ===============================
// 1. 移動平均線(EMA)設定
// ===============================
ema5 = ta.ema(close, 5)
ema13 = ta.ema(close, 13)
ema26 = ta.ema(close, 26)
plot(ema5, title="EMA5", color=color.orange, linewidth=2)
plot(ema13, title="EMA13", color=color.new(color.blue, 0), linewidth=2)
plot(ema26, title="EMA26", color=color.new(color.gray, 0), linewidth=2)
// ===============================
// 2. MACD(10,26,9)設定
// ===============================
fast = ta.ema(close, 10)
slow = ta.ema(close, 26)
macd = fast - slow
signal = ta.ema(macd, 9)
macdBull = ta.crossover(macd, signal)
// ===============================
// 3. 初動判定ロジック
// ===============================
// ゴールデン並び条件
goldenAligned = ema5 > ema13 and ema13 > ema26
// ローソク足が26EMAより上
priceAbove26 = close > ema26
// 3条件すべて満たすと「確」
bullEntry = goldenAligned and priceAbove26 and macdBull
// ===============================
// 4. スコア(0=なし / 1=猛 / 2=確)
// ===============================
score = bullEntry ? 2 : (goldenAligned ? 1 : 0)
// ===============================
// 5. スコアの色分け
// ===============================
scoreColor = score == 2 ? color.new(color.yellow, 0) : score == 1 ? color.new(color.lime, 0) : color.new(color.gray, 80)
// ===============================
// 6. スコア表示(カラム)
// ===============================
plot(score,
title="猛スコア (0=なし,1=猛,2=確)",
style=plot.style_columns,
color=scoreColor,
linewidth=3)
// 目安ライン
hline(0, "なし", color=color.new(color.gray, 80))
hline(1, "猛", color=color.new(color.lime, 60))
hline(2, "確", color=color.new(color.yellow, 60))
// ===============================
// 7. チャート上に「確」ラベル
// ===============================
plotshape(score == 2,
title="初動確定",
style=shape.labelup,
text="確",
color=color.yellow,
textcolor=color.black,
size=size.tiny,
location=location.belowbar)
Pious 3EMA-8EMA with 89ema when the stock price is above 89 ema and 3emah is above 8emah and 3emal is above 8emal buy prefers and vice versa, other conditions are additive to it

30-Minute High and Low30-Minute High and Low Levels
This indicator plots the previous 30-minute candle’s high and low on any intraday chart.
These levels are widely used by intraday traders to identify key breakout zones, liquidity pools, micro-range boundaries, and early trend direction.
Features:
• Automatically pulls the previous 30-minute candle using higher-timeframe HTF requests
• Displays the HTF High (blue) and HTF Low (red) on lower-timeframe charts
• Works on all intraday timeframes (1m, 3m, 5m, 10m, etc.)
• Levels stay fixed until the next 30-minute bar completes
• Ideal for ORB strategies, scalping, liquidity sweeps, and reversal traps
Use Cases:
• Watch for breakouts above the 30-minute high
• Monitor for liquidity sweeps and fakeouts around the high/low
• Treat the mid-range as a magnet during consolidation
• Combine with VWAP or EMA trend structure for high-precision intraday setups
This indicator is simple, fast, and designed for traders who rely on HTF micro-structure to guide intraday execution.

Scary Flush Indicator R0Work in progress.
Calculates the gradient based on candle lows (previous low to current low). Works on all time frames.
Looks for a selling gradient of >0.75pts per minute then highlights. Anything less than this indicates a lazy grind down and indicates a potential invalidation for the FBD.
