Daily Levels [cryptalent]Daily High / Low / Mid / Open Levels is a session-based reference indicator designed to visualize key daily price levels directly on the chart.
This indicator automatically plots the Daily High, Daily Low, Daily Midpoint (High + Low / 2), and Daily Open as horizontal lines for each trading day. These levels help traders quickly identify important structural prices where liquidity, reactions, or acceptance often occur.
Key Features
Automatic Daily Levels
Plots Daily High (H), Low (L), Mid (M), and Open (O) using higher-timeframe daily data.
Levels update in real time as the current day develops.
Multi-Day History
Displays daily levels for a configurable number of past days.
Older levels are automatically removed to keep the chart clean.
Line Extension
Current day levels can be extended forward by a user-defined number of bars.
Useful for projecting intraday reaction zones and liquidity targets.
Visual Customization
Independent line width and color settings for each level.
Mid level is shown as a dashed line for quick visual distinction.
Labels & Price Tags
Optional letter labels (H / L / M / O) displayed near the extended levels.
Optional price labels showing the exact level values on the right side of the chart.
Labels update dynamically and only display for the active trading day.
Performance-Oriented Design
Efficient line and label management using arrays.
Automatically cleans up unused objects to stay within TradingView limits.
Use Cases
Identifying intraday support and resistance
Tracking daily range behavior
Monitoring mean reversion vs. range expansion
Aligning intraday execution with higher-timeframe structure
This indicator is particularly useful for traders who rely on market structure, session behavior, and objective price references rather than subjective trend lines.
رسم بياني يومي

Daily contextThis indicator automatically marks the Previous Day’s High and Low, as well as the market’s midnight opening price.
These levels are updated at the start of each new trading day and remain visible throughout the entire session.
By providing key daily reference points, the indicator helps establish a clear market context and allows traders to immediately understand where price is positioned relative to the previous day’s range and the daily open.

Session, Weekly, Daily LevelsScroll down for hungarian description!
Magyar leíráshoz görgess lejjebb!
Overview
This script provides a unified market structure mapping tool that automatically identifies and visualizes key intraday, daily, and weekly reference levels. It helps traders contextualize price action throughout the trading week by marking true session opens, previous day highs/lows, weekly highs/lows, and weekday opens, all with accurate historical anchoring and correct timezone handling.
What This Script Does
1. Intraday Session Opens (Tokyo, London, New York)
- Detects the exact candle where each session opens.
- Draws horizontal rays with labels.
- Automatically clears lines at the start of each new day.
- Uses a custom local-to-exchange timezone conversion system.
2. Weekly Levels
- Last week high and low (precise bar anchoring, not HTF aggregation)
- Current week open (also Monday open)
- Auto-reset on new week
- Levels are always drawn from the true candle where they formed.
3. Previous Day High & Low
- Continuously tracks intraday highs and lows.
- On a new day, stores yesterday’s values and anchors rays to the exact bars.
- Levels remain visible for the full current day and reset the next day.
4. Weekday Opens (Tue–Fri)
- Captures the exact opening price of Tuesday–Friday.
- Monday open = Week open, so it is not shown separately.
- Auto-reset on new week.
Timezone Logic (Original Feature)
The script converts:
local session times → exchange timezone → chart timestamps
It works correctly regardless of chart timezone or instrument exchange location.
Line Drawing Logic
- Finds the exact bar_index where each level forms.
- Draws rays extending to the right.
- Labels are placed ahead of price.
- Safe updating prevents “bar index too far” errors.
How to Use
- Identify daily/weekly structure.
- Track bias relative to session opens.
- Observe reactions around weekday opens.
- Compare price action to last week's range.
Originality
- Custom timezone conversion engine.
- True historical bar anchoring.
- Fully automated weekly/daily structural resets.
- Independent styling for each level type.
- Not a mashup; all components follow one unified logic.
Limitations
- Does not predict trend or direction.
- Structural tool only.
Summary
A precise and reliable market structure tool that unifies weekly, daily, and intraday reference levels with full timezone automation and true-candle anchoring.
MAGYAR LEÍRÁS
--------------
Áttekintés
Ez az indikátor egy összetett piaci szerkezet-feltérképező eszköz, amely automatikusan megjeleníti a legfontosabb intraday, napi és heti referenciaértékeket. A célja, hogy a kereskedő tisztán lássa a piac aktuális környezetét: hol nyíltak a főbb devizapiaci szekciók, hogyan alakult a tegnapi tartomány, hol volt a múlt heti csúcs/mélypont, és hogyan nyitottak az egyes hétköznapok.
Mit tud a script?
1. Szekciónyitások (Tokyo, London, New York)
- Megkeresi a pontos gyertyát, amely a szekciónyitáskori árat tartalmazza.
- Vízszintes vonalat és címkét rajzol.
- Minden nap elején automatikusan törli a korábbi nap szintjeit.
- Egyedi időzóna-konverziós rendszerrel működik (helyi idő → tőzsdei idő → chart idő).
2. Heti szintek
- Múlt heti maximum és minimum (pontos gyertyapontra horgonyozva)
- Aktuális heti nyitóár (egyben a hétfői nyitó is)
- Új hét kezdetekor automatikusan frissül.
- A múlt heti high/low nem fix időpontra, hanem a valódi gyertyára kerül.
3. Előző napi High és Low
- Folyamatosan követi a napi maximumot és minimumot.
- Napváltáskor elmenti és pontos gyertyáról indítja a ray-t.
- A szintek a teljes nap folyamán megmaradnak, majd a következő nap törlődnek.
4. Hétköznapok nyitóárai (Kedd–Péntek)
- A kedd, szerda, csütörtök és péntek nyitóárát rögzíti és megjeleníti.
- A hétfői nyitó a Week Open, ezért külön nem jelenik meg.
- Heti váltáskor automatikusan törlődnek.
Időzóna-kezelés (egyedi megoldás)
A script a felhasználó helyi idejét átszámítja az instrumentum tőzsdei időzónájára, majd a chartra vetíti.
Ez biztosítja, hogy minden szekciónyitás helyesen jelenik meg, bármely chart vagy instrumentum esetén.
Vonalrajzolási logika
- A szintek a valódi bar_index alapján kerülnek rögzítésre.
- Jobbra nyúló ray-eket rajzol.
- A címkék mindig a jobb oldalon, előre helyezve jelennek meg.
- Biztonságos frissítési rendszer akadályozza meg a hibákat (pl. “bar index too far”).
Használat
- Napi/heti szerkezet meghatározása.
- Bias követése a session openekhez viszonyítva.
- Reakciók figyelése a hétköznapok nyitóárai körül.
- Összevetés a múlt heti tartománnyal.
Eredetiség
- Egyedi időzóna-kezelő motor.
- Igazi gyertyapont-alapú horgonyzás.
- Automatikus napi/heti reset.
- Minden szint külön stílusban konfigurálható.
- Nem mashup; egységes rendszer.
Összegzés
Professzionális, pontos eszköz a piaci szerkezet feltérképezésére, amely egyesíti a heti, napi és intraday szinteket, teljes időzóna-automatizálással és gyertyapontra horgonyzott kijelölésekkel.

Prev/Current Day Open & Close (RamtinFX)Draws three transparent vertical lines marking the previous day’s close, the current day’s open, and the current day’s close.

Daily Candle by NatantiaIntroduction to the Daily Candle Indicator
The Daily Candle Indicator is a powerful and customizable tool designed for traders to visualize daily price action on any chart timeframe.
This Pine Script (version 5) indicator, built for platforms like TradingView, overlays a single candle representing the day's open, high, low, and close prices, with options to adjust its appearance and session focus.
Key Features:
Customizable Appearance: Users can set the colors for bullish (default green) and bearish (default white) candles, as well as the wick color (default white). The horizontal offset and candle thickness can also be adjusted to fit the chart layout.
Dynamic Updates: The candle updates on the last bar, with wicks drawn to reflect the daily high and low, providing a clear snapshot of the day's price movement.
This is the same version as before, but we had to republish it because the chart contained other indicators, which violated the publication rules. We apologize for the inconvenience.
Have a nice trades!
-Natantia

1D Overlay (triss)Overlay of the Daily candle, simple one color with a line inside the candle to show direction.

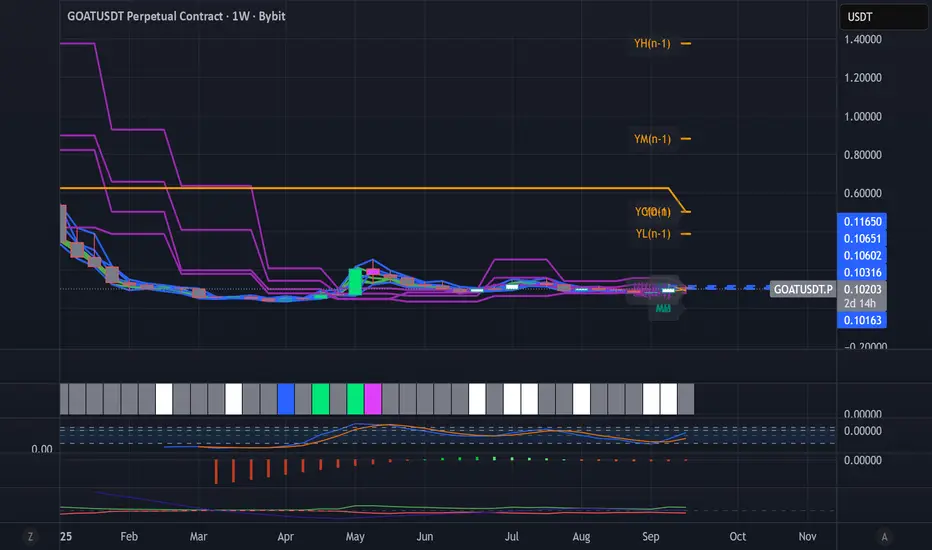
Dynamic Levels This indicator plots key price levels (Open, High, Low, Mid, Close) from multiple higher timeframes (Monday, Daily, Weekly, Monthly, Yearly).
It allows you to track how price interacts with important reference levels without switching timeframes.
🔑 Features
✅ Monday levels (MO, MH, MM)
By default: shows the last completed Monday (fixed values).
Option: “live mode” to update Monday High/Low/Mid while Monday’s candle is forming.
✅ Daily levels (DO, DH, DL, DM, DC)
Live: Daily High/Low/Mid update dynamically while today’s candle is forming.
Previous Daily Close (DC) is always fixed.
✅ Weekly levels (WO, WH, WL, WM)
Live: Weekly High/Low/Mid update dynamically while this week’s candle is forming.
Weekly Open is fixed.
✅ Monthly levels (MO(n), MH(n-1), ML(n-1), MM(n-1), MC(n-1))
Shows last completed month’s values (constant, never changing).
Current Monthly Open is also shown (naturally fixed).
✅ Yearly levels (YO(n), YH(n-1), YL(n-1), YM(n-1), YC(n-1))
Shows last completed year’s values (constant, never changing).
Current Yearly Open is also shown (naturally fixed).
🎨 Customization
Toggle each level (on/off) in indicator settings.
Individual color settings for Monday, Daily, Weekly, Monthly, and Yearly.
Adjustable line width and transparency.
Optional short labels (MO, DO, WM, etc.) displayed on the right side of the chart.
🔄 Dynamic Logic
Daily and Weekly → update dynamically while their candle is forming.
Monday, Monthly, and Yearly → use fixed values from the last completed bar (do not “breathe”).
📌 Use cases
Quickly see where price stands relative to previous close, current open, or mid-levels.
Use Monday Open/High/Mid as strong intraday references.
Use Monthly/Yearly levels as long-term support/resistance zones.
Killzone za Indexe - @mladja123This indicator highlights the Kill Zones on index charts, showing key market sessions where high-probability price movements are likely to occur. It helps traders identify optimal entry and exit points based on session dynamics and market rhythm, enhancing strategy precision for swing and intraday trading on indices.
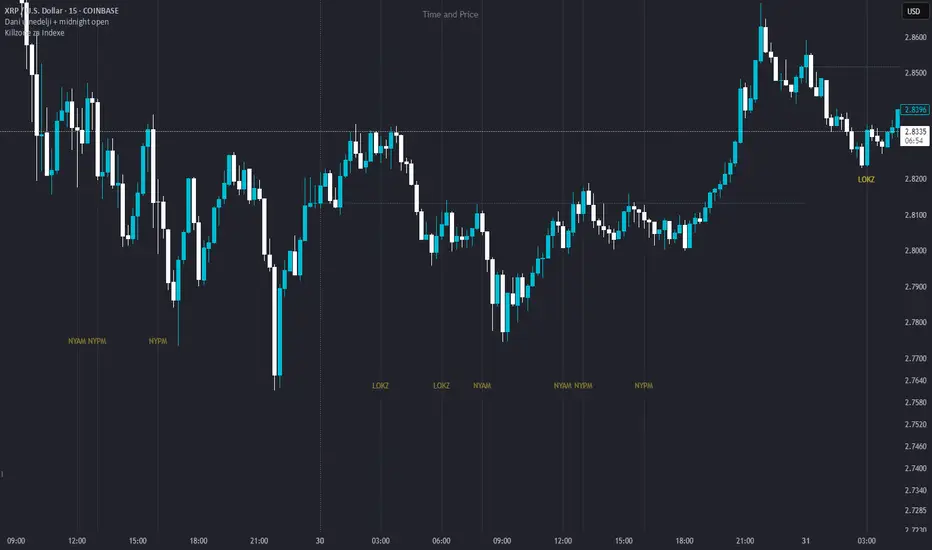
Dani u nedelji + midnight open @mladja123This indicator breaks the weekly timeframe into cycles and marks the midnight open for each day. It helps traders visualize weekly structure, identify key daily openings, and track market rhythm within the week. Perfect for analyzing trend patterns, swing setups, and session-based strategies.

LevelsThis Indicator is meant to plot some of the most common levels that traders use.
The display of these levels is highly customizable, as you can choose the line type , color , thickness and whether it shows you no label, price only, reduced label or full label next to the line. All labels (except for "no Label") will show the price at this level.
Also You have the option to mark the start on each timeframe with either a individually colored background or a vertical line where you can choose the line style and color.
Full List of available Levels and Optional inputs to these levels:
Previous HTF Candle Levels:
• Previous HTF Candle Open
• Previous HTF Candle High
• Previous HTF Candle Low
• Previous HTF Candle Close
Optional:
• Choose any higher timeframe
• Mark start of new HTF candle
Session Levels:
• Session Open
• Session High
• Session Low
• Session Close
Optional:
• Choose any time as start and end of your session
• Mark start of session
• Mark full session
Daily Levels:
• Current Day Open
• Current Day High
• Current Day Low
• Previous Day Open
• Previous Day High
• Previous Day Low
• Previous Day Close
Optional:
• Choose start of day (standard, NY Midnight, custom start time)
• Mark start of day
Weekly Levels:
• Current Week Open
• Current Week High
• Current Week Low
• Previous Week Open
• Previous Week High
• Previous Week Low
• Previous Week Close
Optional:
• Mark start of Week
Monthly Levels:
• Current Month Open
• Current Month High
• Current MonthLow
• Previous Month Open
• Previous Month High
• Previous Month Low
• Previous Month Close
Optional:
• Mark start of Month

Simple Daily OpenDisplays the daily open line, simple as that.
The line is drawn from the opening price of the first bar of the day. There is an option to choose the color, line style, and thickness.

Daily 50‑ & 200‑SMA Ceiling Radar — EnhancedDescription:
This custom TradingView indicator, developed by Trader Malik and licensed under Trades Per Minute, is a powerful visual tool for identifying how price behaves relative to major daily moving averages — the 50-SMA and 200-SMA. It helps traders quickly understand key technical dynamics such as trend alignment, MA proximity, and short-term momentum sentiment — all displayed on a clean, minimal overlay with visual alerts and an adjustable data table.
FEATURES
1. Daily 50 & 200 Simple Moving Averages (SMA):**
- Displayed directly on the chart using distinct blue and orange lines.
- These serve as primary trend filters and support/resistance zones.
2. Price Highlighting:
- A red background flashes momentarily when the price crosses either the 50-SMA or 200-SMA.
- A green background fills the chart when price is above both MAs (bullish zone).
- A red background persists if price is below both MAs (bearish zone).
3. MA Gap Analysis Table:
- 50-SMA Row**: Shows % gap between 50-SMA and 200-SMA.
- 200-SMA Row**: Shows % gap between 200-SMA and 50-SMA.
- Sentiment Row**: Displays short-term trend bias based on the slope of the past 7 daily closes — Bullish, Neutral, or Bearish.
USER SETTINGS
Table Location: Choose between **Top Right** or **Bottom Right** of the chart.
Table Size: Select **Small**, **Medium**, or **Large** to suit screen preferences and layout aesthetics.
This script is **intellectual property of Trades Per Minute** and distributed by **Trader Malik** for use under licensing terms. Redistribution or repurposing without authorization is strictly prohibited.

Haven Average Daily RangeOverview
This indicator is an enhanced version of the traditional ADR tool that adapts to intraday price movements. Unlike static ADR levels, this indicator dynamically adjusts its range boundaries based on real-time price action while maintaining the original ADR calculation framework.
Key Features
ADR calculation based on multiple periods (5, 10, and 20 days)
ADR levels displayed with automatic style changes upon range reach
Customizable display settings (color, line style)
Price labels for better visualization
The indicator helps traders assess the instrument's volatility, identify potential reversal zones, and plan daily trading targets.
Suitable for all timeframes up to D1 and any trading instrument.
How It Works
Session Start (UTC+0): Calculates ADR based on historical data and sets initial High/Low levels
Dynamic Phase: Monitors price action and adjusts the opposite boundary (ADR Low or High) when new extremes are reached.
When price creates new Day high price above the opening price, the ADR Low level moves upward proportionally.
When price creates new Day low price below the opening price, the ADR High level moves downward proportionally.
Completion Phase: Stops adjustments and highlights breach when price reaches either boundary
Trading Application
Entry and Exit Signals
The ADR boundaries serve as key decision points for trade execution. When price approaches the upper ADR boundary, it often signals a potential selling zone, particularly when confluence exists with other overbought indicators such as RSI divergence or resistance levels. Conversely, price reaching the lower ADR boundary frequently indicates potential buying opportunities, especially when supported by oversold conditions or support confluences.
Trend Continuation Assessment
One of the most valuable applications is gauging the probability of continued directional movement. When the current session's price action has not yet reached either ADR boundary, statistical probability favors trend continuation in the established direction. This information helps traders stay with profitable positions longer rather than exiting prematurely.
Reversal and Consolidation Zones
The visual color change to orange when ADR boundaries are reached provides immediate feedback that the normal daily range has been exhausted. At this point, the probability of trend reversal or sideways consolidation increases significantly. This signal helps traders prepare for potential position adjustments or new counter-trend opportunities.

Daily Price RangeThe indicator is designed to analyze an instrument’s volatility based on daily extremes (High-Low) and to compare the current day’s range with the typical (median) range over a selected period. This helps traders assess how much of the "usual" daily movement has already occurred and how much may still be possible during the trading day.

VWAP Balance Zones - SessionsVWAP Balance Zones Sessions Version is an alternate take on the Original VWAP Balance Zones indicator. The Sessions version allows users to select a specific session to view the VWAP Balance Zones at while still utilizing the full ETH Data.
The Session version provides a better focused display while still maintaining the core functions of the original script with mindful optimizations.
Author's Note: "VBZ Sessions was made with logistics in mind, for the users who only trade within certain times of the day. While it displays the same core concepts, it is not as "Raw" of a display as the Original. For this reason, some users may prefer the Original VWAP Balance Zones, which is why I have opted to release this alternate version instead of updating the original."
> What are VWAP Balance Zones?
"VWAP Balance Zones" is an original concept aimed at identifying the equilibrium area between market participants within the current trend by averaging the Daily Extremes and the Daily VWAP.
Refer to the illustration below for a better understanding of exactly how VWAP Balance Zones are formed:
These zones are displayed for the Daily, Weekly, and Monthly VWAPs, with the most interactive timeframe being the Daily.
> Features
1. The Session Version uses ETH data at all times, and does not solely rely on the chart's data to create the VWAPs or Zones.
This allows the user to focus on a specific trading session, while not losing out on the full VBZ Calculation, with the notable benefit of a cleaner display.
The Original VBZ starts drawing at the beginning of the chart's "Day", and would produce different results when using an RTH chart vs an ETH chart. Along with creating a bird's nest of unusable data at the beginning of the day.
2. Session Start and End lines are displayed for easier identification of the designated trading session.
3. The extreme "Close" Lines are no longer displayed to reduce noise and redundancy.
4. Additionally, the interior VWAP lines are no longer displayed. Ultimately, this was to reduce noise and focus the script on the 50% zones.
5. Weekly and Monthly Zones are now displayed due to the reduced noise!
6. As with the original, the weekly display will yield to the daily, and the monthly display will yield to the weekly.
In the screenshot below, you can observe this behavior.
Enjoy!

D|W|M|Y Breaks with NY TimezoneThis indicator plots breaks for multiple timeframes: Daily, Weekly, Monthly, Quarterly, Half Yearly, Yearly.
I also added the option to change timezone to New York to see the week the ICT way ;)

Even vs Odd Days Performance█ OVERVIEW
The Even vs Odd Days Performance indicator is designed to visualise and compare the performance of even-numbered days versus odd-numbered days. This indicator explores one of the many calendar based anomalies that exist in financial markets.
In the context of financial analysis, a calendar based anomaly refers to patterns or tendencies that are linked to specific time periods, such as days of the week, weeks of the month, or months of the year. This indicator helps explore whether such a calendar based anomaly exists between even and odd days.
By calculating cumulative daily performance and counting the number of days with positive returns, it provides a clear snapshot of whether one set of days tends to outperform the other, potentially highlighting a calendar based anomaly if a significant difference is observed.
█ FEATURES
Customisable time window through input settings.
Tracks cumulative returns for even and odd days separately.
Easily adjust table settings like position and font size via input options.
Clear visual distinction between even and odd day performance using different colours.
Built-in error checks to ensure the indicator is applied to the correct timeframe.
█ HOW TO USE
Add the indicator to a chart with a Daily timeframe.
Choose your start and end dates in the Time Settings.
Enable or disable the performance table in the Table Settings as needed.
View the cumulative performance, with even days in green and odd days in red.

Daily/Weekly/Monthly LevelsDaily/Weekly/Monthly Levels
TLDR
Shows Daily/Weekly/Monthly reversal levels. These can act as support/resistance levels.
Can only see what's in your candle history. I.e. It won't see old monthlies on your 1m chart! Use Daily to see everything with the most history.
Can only see levels higher than or equal to your current time frame. I.e. it will not see daily levels if you're looking at a weekly chart.
Doesn't keep levels that have been closed through. Does keep levels that have been only wicked.
This indicator shows you daily, weekly and monthly horizontal reversal levels to save you the hassle of doing it yourself. It's a little aid to speed up your TA routine.
Usage Details and Limitations
All daily, weekly, and monthly levels will be marked with lines on the chart automatically. Levels will only be visible from that level's TF or lower, i.e. you can't see the daily levels from the weekly chart, but you can see all levels from daily or lower charts. No levels will be displayed if you select a time frame higher than 1 month.
New levels will not be drawn if they are very close to existing levels. You can change the 'closeness' threshold in settings. It is specified as a percentage move from the existing level.
However, higher TF levels will REPLACE lower TF levels if they are too close. If you set the 'closeness' setting to 0, all levels will be drawn.
Levels will only be drawn if they are in your displayed candle range! I.e. the lower you go in timeframe, the less history you can see, and so levels originating from further back might be missed!
One technique you might have is to load up the daily timeframe and use that to mark any nearby levels of interest.
How does it work?
Basically, it looks for reversal candles on the D/W/M Timeframes, and draws a line for you from the open of the reversal candle (of that TF), so long as you are on a TF equal or lower than that level.
New bars on that TF that close through that TF's old levels will clear that level. Wicks do not clear.
Each newly found level will not be drawn if it's within the percentage distance of an existing level of equal or higher time frame.
Each new level also checks for existing levels on lower TFs that it can replace. E.g. if a monthly bar closes and produces a monthly level equal to an existing daily or weekly level, that daily or weekly level will be replaced. Use the settings to specify your 'closeness' allowance.
Please remember, it can only see as far back as your candle history, so you won't see old monthlies on a 1 minute chart! Use the daily TF to see all three levels at once with maximum history.

ADR Table BY @ICT_YEROADR Table BY @ICT_YERO
Created by: @ICT_YERO
This custom indicator is designed to provide the Average Daily Range (ADR) for multiple timeframes, including Daily, 4-Hour, and 1-Hour. The indicator is tailored to assist traders in understanding price volatility and making informed trading decisions.
Key Features
Multi-Timeframe ADR Calculation:
Automatically calculates and displays the ADR for Daily, 4-Hour, and 1-Hour timeframes.
Helps traders identify potential price movement ranges for different trading sessions.
Dynamic Range Visualization:
Clear visual representation of the ADR on the chart, making it easy to spot price extremes.
Real-time updates to reflect changes in price movement.
Custom Alerts:
Option to set alerts when the price approaches the ADR high or low.
Useful for identifying potential reversal zones or breakout opportunities.
User-Friendly Interface:
Simple and intuitive settings to customize colors, levels, and display preferences.
Seamlessly integrates with your existing TradingView setup.
ICT-Inspired Methodology:
Designed for traders who follow ICT concepts, focusing on precision and high-probability setups.
Applications
Range Trading: Helps determine the high and low boundaries for scalping or intraday setups.
Volatility Analysis: Understand market behavior during different times of the day or week.
Reversal Zones: Identify areas where price is likely to reverse, based on ADR extremes.
Whether you're a scalper, day trader, or swing trader, this indicator provides a comprehensive overview of price volatility across multiple timeframes, making it an essential tool for your trading arsenal.

Multi-Timeframe Liquidity LevelsMulti-Timeframe Liquidity Levels – Overview
The Multi-Timeframe Liquidity Levels indicator automatically displays significant highs and lows from various timeframes (Daily, Weekly, Monthly, and Quarterly) on your current chart. This allows traders to quickly identify potential support and resistance zones without frequently switching between different timeframe charts. Additionally, the script offers extra lines for special reference points (e.g., the “Midnight” midpoint of the current day and the previous day’s open/close) to highlight potential liquidity zones even more clearly.
1. Core Idea and Benefits
Time-Saving: Instead of manually reviewing charts in different timeframes, the indicator fetches relevant high/low levels automatically and shows them on your active timeframe.
Clear Layout: Traders instantly see where the Daily, Weekly, Monthly, and Quarterly highs and lows lie—areas often associated with institutional orders or liquidity hunts.
Customizable: You can tailor the color scheme, line style (Solid, Dashed, Dotted), and line width, ensuring the displayed levels fit your personal charting style.
2. How It Works
Multi-Timeframe High/Low
For each timeframe (Day, Week, Month, Quarter), the indicator references the previous candle’s high and low (high , low ).
Using request.security(...), these values are plotted on the chart you’re currently viewing.
Flexible Display
You can individually enable or disable the Daily, Weekly, Monthly, and Quarterly lines, depending on which levels are most relevant to your trading.
With Line Style (Solid, Dashed, Dotted) and Line Width, you can easily emphasize certain lines you consider more important.
Additional Lines
“Midnight” Line: A theoretical midpoint between today’s high and low, which can be useful for gauging daily pivot areas.
Previous Day’s Open/Close: Many traders track these reference points to anticipate market reactions. You can show or hide these lines as desired.
Automatic Line Removal & Creation
When a particular timeframe (e.g., “Show Monthly Levels”) is disabled, the script automatically removes the existing monthly lines.
Enabling it again recreates those lines without hassle.
3. Usage and Interpretation
Identifying Support and Resistance
Highs and lows from higher timeframes are often key zones for entries, exits, or major market reactions.
A Daily level may be crucial for short-term traders, whereas Monthly or Quarterly levels can indicate long-term liquidity areas.
Spotting Market Shifts
If price decisively moves above a Higher-Timeframe line, it could signal strong momentum.
Conversely, a failed breakout (where price quickly returns under or above a level) might warn of a potential reversal.
Extra Lines as Filters
The “Midnight” Line helps visualize a rough central price for the current day, aiding in intraday directional bias.
Previous Day’s Open/Close: Common reference points for day traders, where swift approaches and rejections can indicate potential entries or partial take-profit zones.
4. Practical Tips
Use Color-Coding Wisely: Assign distinct colors (e.g., Blue for Daily, Green for Weekly, Orange for Monthly, Purple for Quarterly) so you can easily discern which timeframe you’re looking at.
Toggle On/Off As Needed: Day traders might focus on Daily and Weekly, while long-term traders may pay closer attention to Monthly and Quarterly.
Combine with Price Action: Lines alone don’t constitute a trading strategy. Use them alongside candlestick patterns, volume analysis, or other indicators for a more complete market perspective.
5. Important Notes & Recommendations
Not Financial Advice: This indicator simply reflects historical high/low data across multiple timeframes and does not constitute a buy or sell recommendation.
Trader Responsibility: Observe how the market actually behaves around these lines and adapt your risk management accordingly.

Roman's Ranges(GOLD FUTURES)This indicator provides the user with Gold Future's previous day’s range and how long it took for the price to reach its first extreme for the day. This information is used to predict the most probable daily direction trend and estimate how long you should expect to hold your winning trade. The distance and time are based on the market open candle (6:30 am). It measures from the retracement wick of the candle to the last 5m close of the day’s first extreme low or high point. It also includes that distance in pts.
Previous market data does not guarantee future results, however, you can leverage the knowledge of the previous day’s ranges to set reasonable take profit levels and when your target is not met automatically, you know how long it took on the previous day to reach the day’s first low/high. If you are nearing that amount of time and your trade is not as profitable as expected, it is easier to get out with less profits using this estimated time rather than hoping the market closes in your favor.
Markets go through cycles and it can be difficult to trade them all if you have a fault expectation how how far the price is expected to move. Price tends to deviate slowly from the average ranges slightly day after day, but you can expect an average range to prevail throughout the week +/- 3 points. It can be very easy to be stuck on 5-point take-profit levels that you don’t pay attention to the average range being twice or three times that distance. The same can be said for the opposite scenario with having higher profit expectations than reasonably possible.
This indicator and my statements are not financial advice. This is meant for educational purposes only.

Market Pivot Levels [Past & Live]Market Levels provide a robust view of daily pivot points of markets such as high/low/close with both past and live values shown at the same time using the recently updated system of polylines of pinescript.
The main need for this script arose from not being able to use plots for daily points because plots are inherently once drawn can't be erased and because we can't plot stuff for previous bars after values are determined we can't use them reliably. And while we can use traditional lines, because we would have extremely high amount of lines and we would have to keep removing the previous ones it wouldn't be that effective way for us. So we try to do it with the new method of polylines .
Features of this script:
- Daily High/Low Points
- Yesterday High/Low/Close Points
- Pre-Market High-Low points.
Now let's preview some of the important points of code and see how we achieve this:
With the code below we make sure no matter which chart we are using we are getting the extended hours version of sessions so our calculations are made safely for viewing pre-market conditions.
// Let's get ticker extended no matter what the current chart is
tc = ticker.new(syminfo.prefix, syminfo.ticker, session.extended)
Coding our own function to calculate high's and low's because inbuilt pinescript function cannot take series and we send this function to retrieve our high's and lows.
// On the fly function to calculate daily highlows instead of tv inbuilt because tv's length cannot take series
f_highlow(int last) =>
bardiff = last
float _low = low, float _high = high
for i = bardiff to 0 by 1
if high > _high
_high := high
if low < _low
_low := low
With doing calculations at the bars of day ending points we can retrieve the correct points and values and push them for our polylines array so it can be used in best way possible.
// Daily change points
changeD = timeframe.change("D")
// When new day starts fill polyline arrays with previous day values for polylines to draw on chart
// We also update prevtime values with current ones after we pushed to the arrays
if changeD
f_arrFill(cpArrHigh, cpArrLow, prevArrh, prevArrl, prevArrc, prevMarh, prevMarl)
valHolder.unshift(valueHold.new(_high, _low, _high, _close, _low, time, pr_h, pr_l))
The rest of the code is annotated and commented. You can let me know in comments if you have any questions. Happy trading.

Scoopy StacksWaffle Around Multiple
(Open, High, Low, Close) Stacks On
Pre/Post Market & (Daily, Weekly,
Monthly, Yearly) Sessions With
Meticulous Columns, Rows, Tooltips,
Colors, Custom Ideas, and Alerts.
Sessions Use Two Step Incremental Values
Default Value: (1) Shows Two Previous
(O, H, L, C); Increasing Value Swaps
Sessions With Next Two Stacks.
⬛️ KEY WORDS:
🟢 Crossover | 🔴 Crossunder
📗 High | 📕 Low
📔 Open | 📓 Close
🥇 First Idea | 🥈 Second Idea
🥉 Third Idea | 🎖️ Fourth Idea
🟥 ALERTS:
Default Option: (Per Bar)
Alerts Once Conditions Are Met
(Bar Close) Alerts When Bar Closes
Default Option: (Reg)
Alerts During Regular Market
Trading Hours, (0930-1600)
(Ext) Alerts During Extended
Market Hours, (1600-0930)
(24/7) Alerts All Day
Optional Preferences:
Regular Alerts - Stocks
Extended Alerts - Futures
24/7 Alerts - Crypto
🟧 STACKS:
Default Value: (1)
Incremental Stack Value, Increasing Value
Swaps Sessions With the Next Two Stacks
(✓) Swap Stacks?
Pre/Post Market High/Lows,
1-2 Day High/Lows, 1-2 Week High/Lows,
1-2 Month High/Lows, 1-2 Year High/Lows
( ) Swap Stacks?
Pre/Post Market Open/Close,
1-2 Day Open/Close, 1-2 Week Open/Close,
1-2 Month Open/Close, 1-2 Year Open/Close
🟨 EXAMPLES:
Default Stack:
🟢 | 📗 Pre Market High (PRE) | 4600.00
🔴 | 📕 Post Market Low (POST) | 420.00
Optional: (Open)
🟢 | 📔 Post Market Open (POST) | 4400.00
Optional: (Close)
🔴 | 📓 Pre Market Close (PRE) | 430.00
Default Stack Value: (1)
🔴 | 📗 1 Day High (1DH) | 460.00
Next Stack Value: (3)
🟢 | 📕 4 Day Low (4DL) | 420.00
Optional: (Open)
🔴 | 📔 2 Day Open (2DO) | 440.00
Optional: (Close)
🟢 | 📓 3 Day Close (3DC) | 430.00
Default Stack Value: (5)
🟢 | 📗 5 Week High (5WH) | 460.00
Next Stack Value: (7)
🔴 | 📕 8 Week Low (8WL) | 420.00
Optional: (Open)
🔴 | 📔 7 Week Open (7WO) | 4400.00
Optional: (Close)
🟢 | 📓 6 Week Close (6WC) | 430.00
Default Stack Value: (9)
🔴 | 📗 9 Month High (9MH) | 460.00
Next Stack Value: (11)
🟢 | 📕 12 Month Low (12ML) | 420.00
Optional: (Open)
🟢 | 📔 11 Month Open (11MO) | 4400.00
Optional: (Close)
🔴 | 📓 10 Month Close (10MC) | 430.00
Default Stack Value: (13)
🟢 | 📗 13 Year High (13YH) | 460.00
Next Stack Value: (15)
🟢 | 📕 16 Year Low (16YL) | 420.00
Optional: (Open)
🔴 | 📔 15 Year Open (15YO) | 4400.00
Optional: (Close)
🔴 | 📓 14 Year Close (14YC) | 430.00
🟩 TABLES:
Default Value: (1)
Moves Table Up, Down, Left, or Right
Based on Second Default Value
First Default Value: (Top Right)
Sets Table Placement, Middle Center
Allows Table To Move In All Directions
Second Default Value: (Default)
Fixed Table Position, Switching Values
Moves Direction of the Table
🟦 IDEAS:
(✓) Show Ideas?
Shows Four Ideas With Custom Texts
and Values; Ideas Are Based Around
Post-It Note Reminders with Alerts
Suggestions For Text Ideas:
Take Profit, Stop Loss, Trim, Hold,
Long, Short, Bounce Spot, Retest,
Chop, Support, Resistance, Buy, Sell
🟪 EXAMPLES:
Default Value: (5)
Shows the Custom Table Value For
Sorted Table Positions and Alerts
Default Text: (🥇)
Shown On First Table Cell and
Message Appearing On Alerts
Alert Shows: 🟢 | 🥇 | 5.00
Default Value: (10)
Shows the Custom Table Value For
Sorted Table Positions and Alerts
Default Text: (🥈)
Shown On Second Table Cell and
Message Appearing On Alerts
Alert Shows: 🔴 | 🥈 | 10.00
Default Value: (50)
Shows the Custom Table Value For
Sorted Table Positions and Alerts
Default Text: (🥉)
Shown On Third Table Cell and
Message Appearing On Alerts
Alert Shows: 🟢 | 🥉 | 50.00
Default Value: (100)
Shows the Custom Table Value For
Sorted Table Positions and Alerts
Default Text: (🎖️)
Shown On Fourth Table Cell and
Message Appearing On Alerts
Alert Shows: 🔴 | 🎖️ | 100.00
⬛️ REFERENCES:
Pre-market Highs & Lows on regular
trading hours (RTH) chart
By Twingall
Previous Day Week Highs & Lows
By Sbtnc
Screener for 40+ instruments
By QuantNomad
Daily Weekly Monthly Yearly Opens
By Meliksah55
