Daily SeasonalityDay trading trend filter indicator designed to hep get better entries or exits based on historical opens and closes each hour.
This indicator is NOT designed as an entry or exit signal. The purpose behind it is to give you statistical information about how likely certain times of day are either bullish , bearish or neutral and use that to confirm or reject other trading signals.
For example you might be anticipating a breakout based on your strategy or another indicator but see that the next few days are usually bearish and re-evaluate entering the trade.
The Daily Seasonality indicator calculates the percentage of candles per day of the week that had a higher close than open.
Default settings are:
- a look-back of 52 weeks (1 year).
- extreme bullish ( bright green) above 74%
-extreme bearish ( bright red) below 25%
- bullish (green) above 55%
- bearish (red) below 45%
- neutral (white) exactly 50%
- no trend (gray) 46% - 54%
All of these are updatable via the settings.
This indicator is designed to work only on the Daily timeframe.
رسم بياني يومي

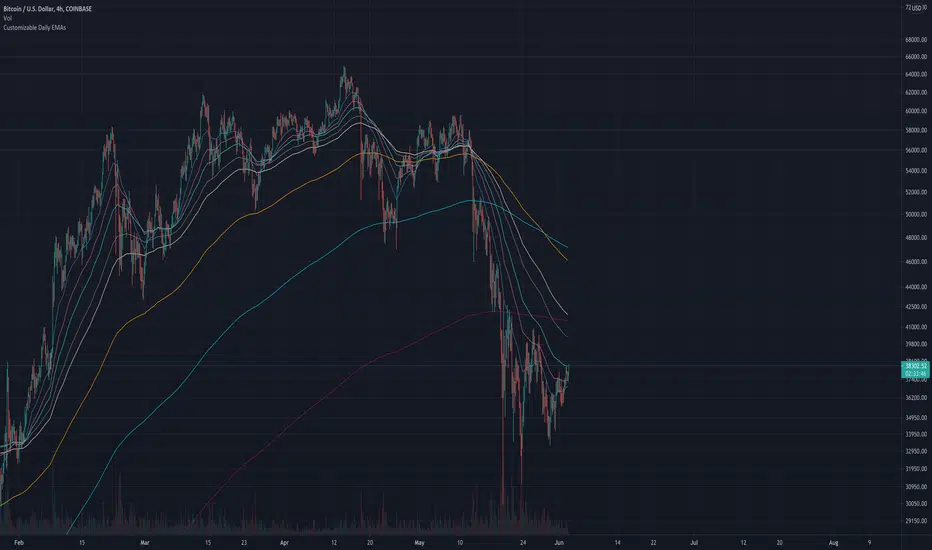
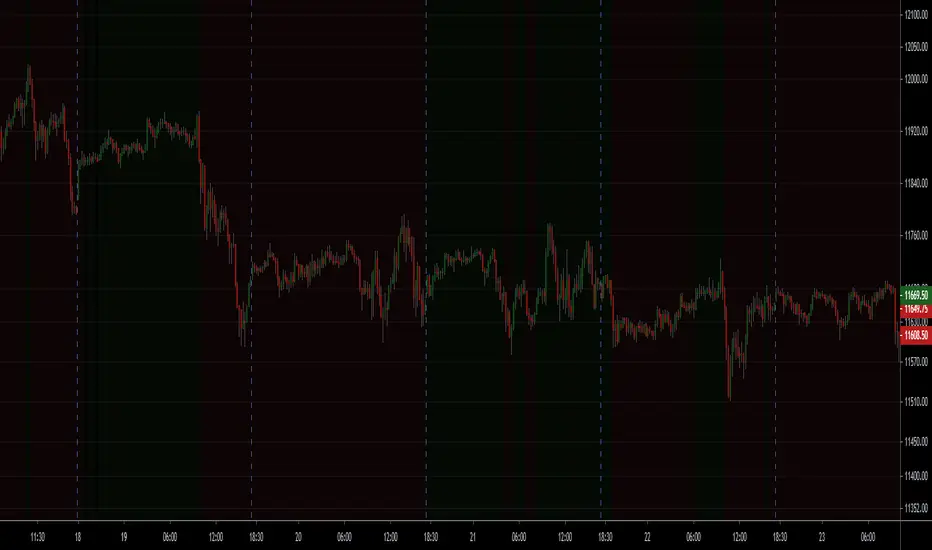
Customizable Daily EMAs (up to 8)This indicator provides you with up to 8 different EMAs that are customizable.
You can specify how many EMAs you want on the chart (up to a maximum of 8), as well as the length and color of each EMA. In addition, the resolution of all EMAs can also be customized - by default all EMAs follow the Daily timeframe but you could set this to any timeframe you want or you could choose for it to follow the timeframe chart as most other EMA Indicators do.
The reason for creating this indicator is because I was looking for Daily EMAs, but wanted to view the chart in a different time period without the EMA lines themselves changing. In addition, I wanted to view ample EMAs at once, and have the ability to change their length as I see fit.
You can see this demonstrated on the 4-hour chart above. Despite the chart being a 4 hourly chart, the EMAs are Daily EMAs.
In the example above all 8 EMAs have been activated, but you could turn any of these off to suit your own preferences.
The default EMAs are set to the following: 20, 50, 100, 200, 5, 9, 13, 26.
The First 4 are ideal for longer-term targets, while the smaller timeframes are more suited to short-term trading targets.
I have made this script Open-source for anybody to view, copy and modify if they need.
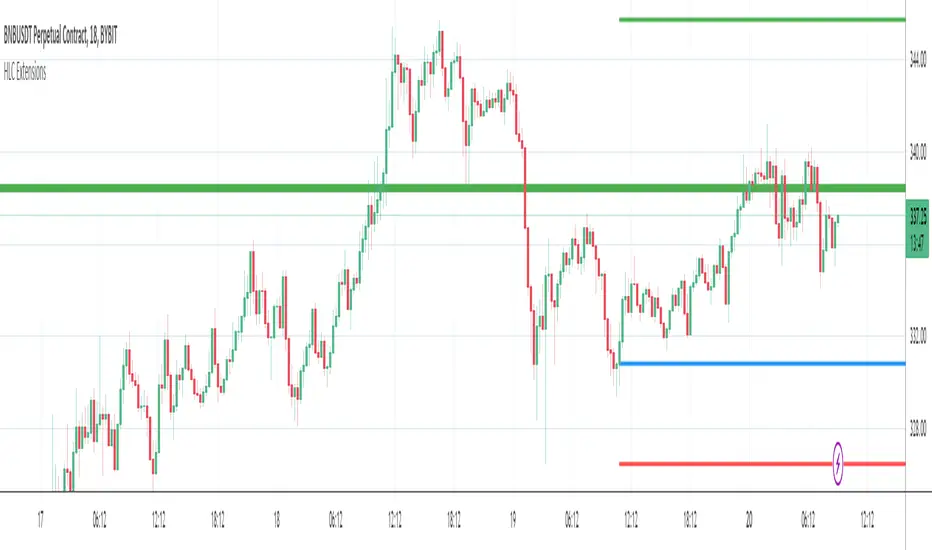
Yesterdays & Last Weeks High Low Close ExtensionsPlots the Extensions of Yesterdays and Last Weeks High Low Close
Unfortunately all of the levels wont always show therefore it is good use this in conjunction with my Levels script
I tried to combine the 2 scripts but doing so gave me memory overload errors in Tradingview thats why I have made them separate
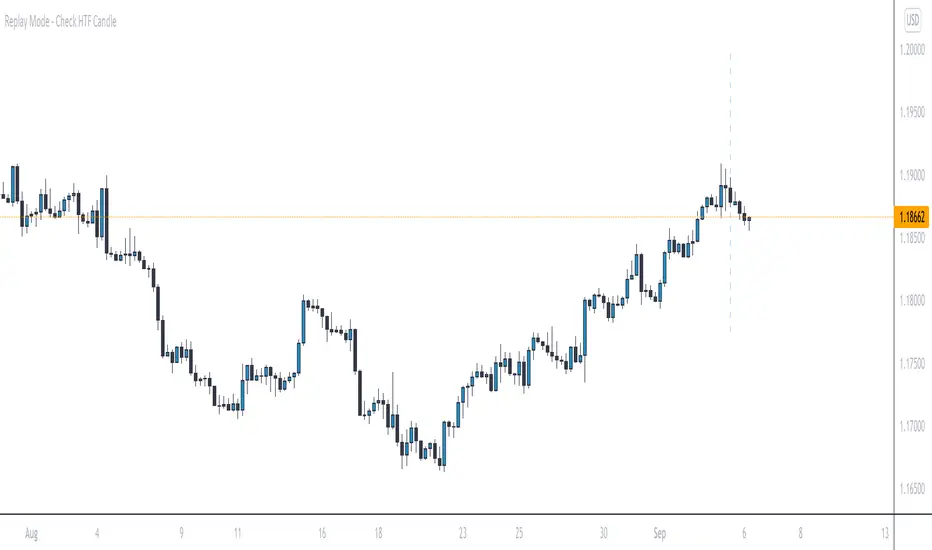
Replay Mode - Check HTF CandleThis indicator is intended to be used while using Replay Mode.
A vertical line will be drawn when you can safely check the 4H, Daily, or Weekly candle without seeing future price.
It is similar to the built-in Session Breaks, but has the benefit of not needing to remove one candle before checking the Daily.
When the line is the color of your 4H settings, it is safe to check the 4H candle.
When the line is the color of your Daily settings, it is safe to check the 4H and Daily candles.
When the line is the color of your Weekly settings, it is safe to check the 4H, Daily and Weekly candles
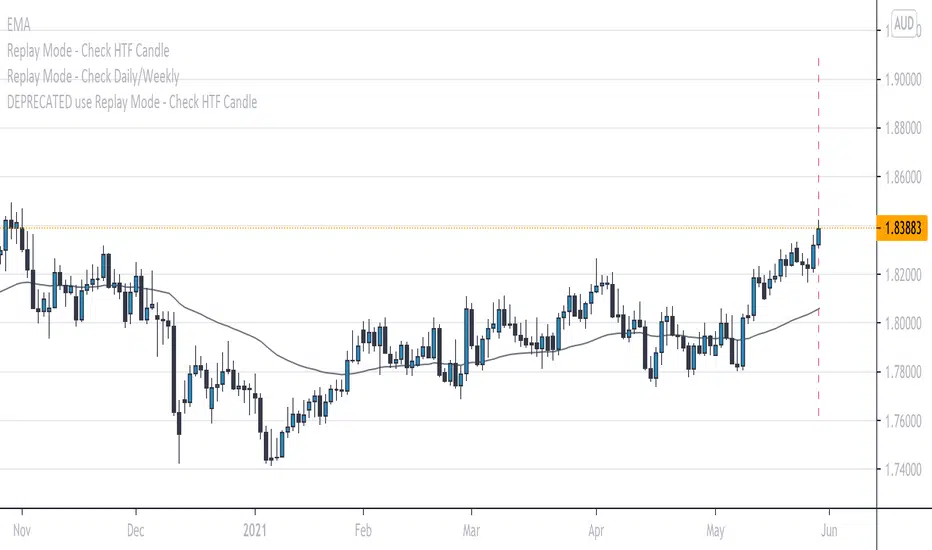
Replay Mode - Check Daily/WeeklyThis indicator is intended to be used while using Replay Mode.
It is similar to the built-in Session Breaks, but has the benefit of not needing to remove one candle before checking the Daily.
When on an intraday chart (timeframe less than Daily), a vertical line will be drawn when you can safely check the Daily or Weekly candle without seeing future price.
When the line is the color of your Daily settings, it is safe to check the Daily candle.
When the line is the color of your Weekly settings, it is safe to check both the Daily and Weekly candle.
Stepping MAInput desired timeframe and etc
Ex: Timeframe Daily
Input 100
Will display daily moving of 100 on every timeframe

Daily High & Low BoundaryDisplays the day's progressive high and low of the day colorized by the day of the week.

Key Levels SpacemanBTC IDWMKey levels, plotted automatically
Additional timeframes can be added on request
Useful for seeing strength of the trend in the market

Sessions (Nephew_Sam_)Indicator combines the 3;
1. 3 Sessions - with an option to set your own times
2. 4 Killzones- with an option to set your own times
3. Daily Dividers
If you dont want any of the the above or want to decrease your killzones, just uncheck the relevant checkbox under settings - inputs/colors.
Note: Most of this code it taken from other open source scripts, therefore I will leave this as an open source code too.

Weekly/Daily/Hourly/Minutes Colored Background IntervalsThis is my "Weekly/Daily/Hourly/Minutes Colored Background Intervals" assistant. I wouldn't describe it as an indicator, it just exhibits coloration of referenced periods of time with bgcolor() in Pine. With the arrival of 2021, I pondered the necessity of needing a visualization pre-2021 to visually recognize periodicity of market movements by the week, day, hour, or an adjustable period of minutes. While this script is simply generic, I hope you may find useful in your endeavors as a member on TradingView.
Explaining the script's usage, the "Minutes" input can be adjusted from anywhere between 5-55 minutes for only intraday. This can be modified to accommodate 90 minutes (1.5hrs) or any other minutes period desirable by tweaking certain numbers up to 1440. Minutes and Hourly backgrounds are disabled by default for most daily traders. Changing the input() code to `true` will provide them on by default when the script loads, if you choose that route. Each time periods background color is enable/disable capable. All of the colors are easily adjustable to any combination you can ponder for your visual acuity with the color swatch provided by input(type=input.color). The coloring can be "swapped" by input() depending on how you wish to start and end the day visually. I thought this would come in handy. The weekly background can have different starting points, whether it be Sunday, Monday, or any other day such as Friday for example.
The entire script's contents isn't intended for complete re-use as is for publicly published scripts. It's more along the lines of code that could be used to personally modify indicators you have, depending on the time frames you may actually be trading on. The code is basically modular, so you can use bits and pieces of it in your personally modified Pine Editor scripts that you wish to customize for yourself. I will say that the isXxx() functions are completely reusable in any script without any need for author permission inquiries from me, as easy as copy and paste. Those may come in handy for many folks. If you find them useful in certain circumstances, use isXxx() functions as you please. Day of the week detection by functions will have applications beyond my current intended use for them.
Of notable mention, this is a miniature lesson by example of how the new input(type=input.color) may be used. I'm also using `var` inside functions to aid in computational efficiency of the script runtime. The colors are permanently stored at the very beginning of the scripts operation inside the function and just reused from that point onward. Its a rare use case, but well suited for this scripts intention. Once again I have demonstrated the "Power of Pine" for developers of any experience level to learn from via code elegance.
When available time provides itself, I will consider your inquiries, thoughts, and concepts presented below in the comments section, should you have any questions or comments regarding this indicator. When my indicators achieve more prevalent use by TV members , I may implement more ideas when they present themselves as worthy additions. Have a profitable future everyone!

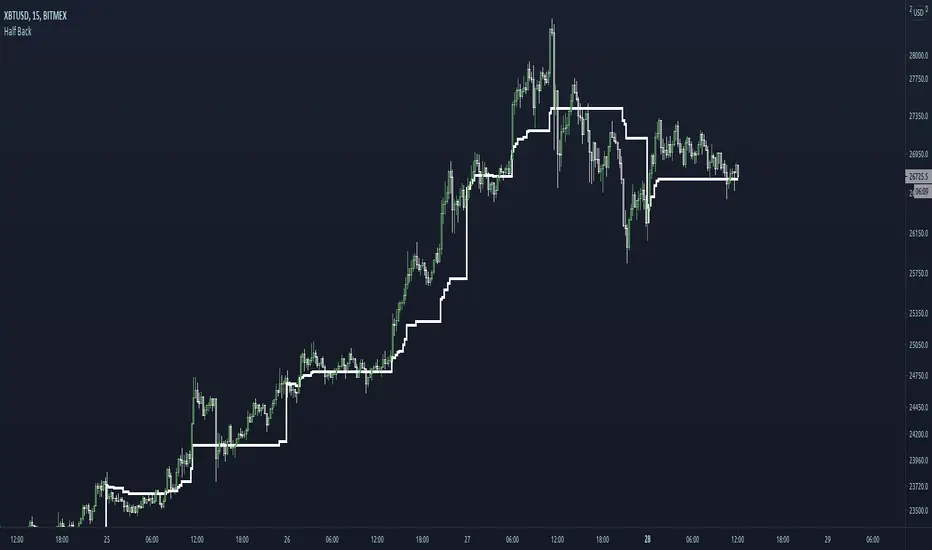
Half BackA dynamic intraday midpoint for Day Timeframe trader reference.
Midpoint is halfway between the day's highest high and lowest low.
Midpoint resets daily.
NSDT Background Bear Bull DayA very basic script that changes the background color of the chart to Green if the price closes over the previous day close, and to Red if the price closes under the previous day close. This allows you to easily see if it is currently a Bull or Bear market with a glance. Alerts added.
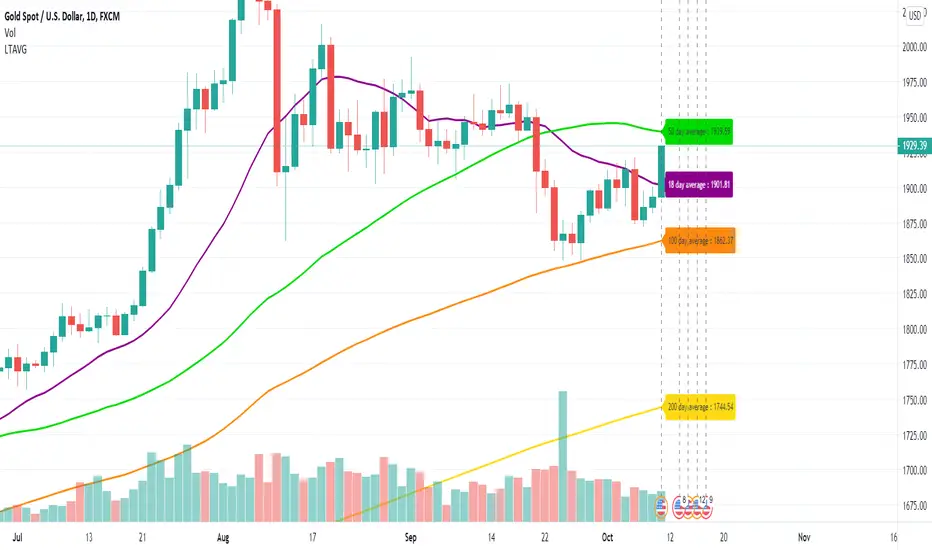
Long Term Moving AverageThis scripts plots the long term moving average calculated daily for 4 sets.
The default averages are:
18 day
50 day
100 day
200 day
The settings can be used to flexibly change this and to hide / show labels
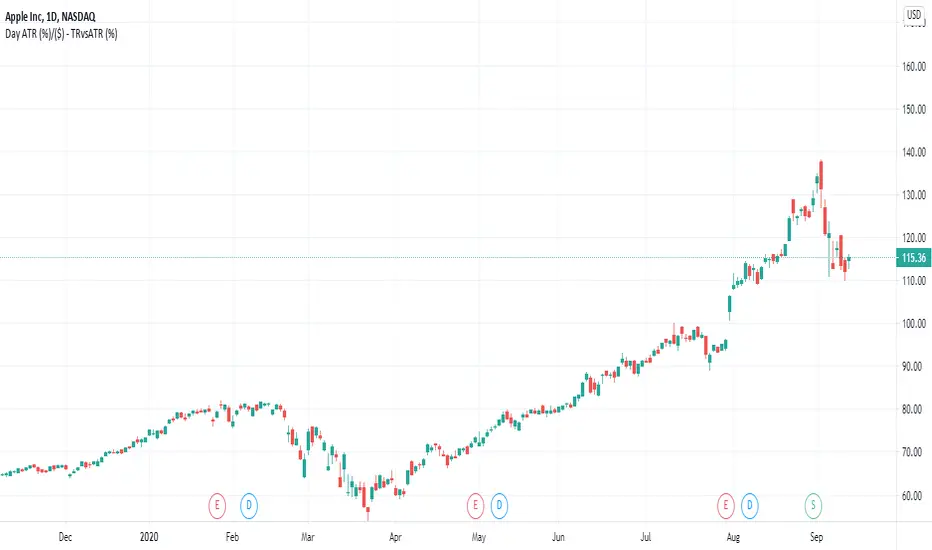
Daily Average True RangeThis script should give you a quick idea how far your stock has moved intraday compared to the ATR.
Daily Range 1) Daily high - low range as a column chart
2) If differentiates the days of the week, Wednesday - Blue, Thursday - Red

ICT Killzone For Crypto Markets.Adjusted for Crypto 24/7 markets
Adjusted for UTC
i have hidden the asian open range and daily bars on my charts , you can choose to have them on
Less screen clutter
London Open 8:00 - 4:30 - Killzone 7:00 - 9:00
NewYork Open 9:30 - 4:00 Killzone 8:00 - 10:00
Shanghai open 9:15 Killzone 8:00 - 10:00
NOT MY ORIGINAL SCRIPT. JUST MODIFIED VERSION

EMA with time-interval dependant visiblity settingThis scrip exposes 4 Exponential Moving Average (EMA) indicators which their visibility can be set to a daily or weekly time-frame (aka intervals). Based on your current chart time-frame, the matching EMA indicators come on and off.
This helps to have meaningful EMAs relevant to your time internal.
In a traditional 10 EMA indicates a plotted indicator would bear a meaning of a 10 day EMA when in daily and 10 week EMA when in weekly chart which may or may not be useful as some who for example only require a 10 week EMA for thier analysis and wouldn't want to cloud a daily chart with an EMA which won't resemble a valuable output for this particular user.
With EMA+, you can choose to see the 10 week EMA only when your chart is in the weekly time interval, so when switched to a daily interval a 10x EMA is not shown anymore.
If you prefer to see a 10 week EMA and a 21 day EMA on the other hand, you will only have 1 EMA shown when in weekly mode which is a 10 week EMA and one EMA when in daily mode with is 21 day EMA.

A Deeper Look Into Security Function & Possible ImprovementsThere is a link below that further explain the purpose of this publication.
A fresh new look into the limitations of the security() function and perhaps expand our horizons on having access to more accurate data no matter from what timeframe you are on.
docs.google.com
As always, it is my desire to help the community to continue reaching new highs.

ATR Timeframe RangeThis indicator shows the ATR range on the daily or any other timeframe on your current chart. All settings are fully customize-able.

EMA 20/100/200 alwaysThis script will always show the EMA 20/100/200 daily values across any time frame chart (e.g. showing daily 20 EMA while viewing the 5 minute chart)

MTF Ichimoku CloudIchimoku Cloud , Multiple Time Frames, based on the script : MTF Selection Framework functions (PineCoders)
Possible display:
- four differents Ichimoku
- Tenkan, Kijun, Chikou and Kumo (monochrome or not)
- labels : offset from line, color if you change style and with/without abbreviation
Time Frames :
- 1m
- 3m
- 5m
- 15m
- 30m
- 45m
- 1h
- 2h
- 3h
- 4h
- Daily
- Weekly
- Monthly

COVID-19: Daily change per capita (EU only)New confirmed cases per day (daily change) is one thing, just an absolute value but when we put this number in context of population (per million people) of each country the situation is a bit different.
We can easily see that, at the moment (Apr 2nd, 2020), the most affected country is Spain (~150 new cases per million people per day) and surprisingly the second one is Switzerland (CH). We can also see Spain or Belgium's steep curve relative to other countries.
I know that some countries run more tests than the others and the outcome might not be reflect the reality but this is the official data that is available.

COVID-19: Daily changeNew daily infections (daily change) of COVID-19.
The chart shows new daily cases across the entire planet, the US, EU (de+fr+it+es only) and a small country (RO) that does not matter to anybody but me. You can show/hide different country in Settings.
Select "COVID-19: CONFIRMED" data in main chart and add the indicator.
