200 EMA w/ Ticker Memory200 EMA w/ Ticker Memory — Multi-Symbol & Multi-Timeframe EMA Tracker with Alerts
Overview
The 200 EMA w/ Ticker Memory indicator allows you to monitor the 200-period Exponential Moving Average (EMA) across multiple symbols and timeframes. Designed for traders managing multiple tickers, it provides customizable timeframe inputs per symbol and instant alerts on price touches of the 200 EMA.
Key Features
Multi-symbol support: Configure up to 20 different symbols, each with its own timeframe setting.
Flexible timeframe input: Assign specific timeframes per symbol or use a default timeframe fallback.
Accurate 200 EMA calculation: Uses request.security to fetch 200 EMA from the symbol-specific timeframe.
Visual EMA plots: Displays both the EMA on the selected timeframe and the EMA on the current chart timeframe for comparison.
Touch alerts: Configurable alerts when price “touches” the 200 EMA within a user-defined sensitivity percentage.
Ticker memory: Remembers your configured symbols and displays them in an on-chart table.
Compact info table: Displays current symbol status, alert settings, and timeframe in a clean, transparent table overlay.
How to Use
Configure Symbols and Timeframes:
Input your desired symbols (up to 20) and their respective timeframes under the “Symbol Settings” groups in the indicator’s settings pane.
Set Default Timeframe:
Choose a default timeframe to be used when no specific timeframe is assigned for a symbol.
Adjust Alert Settings:
Enable or disable alerts and set the touch sensitivity (% distance from EMA to trigger alerts).
Alerts
Alerts trigger once per bar when the price touches the 200 EMA within the defined sensitivity threshold.
Alert messages include:
Symbol / Current price / EMA value / EMA timeframe used / Chart timeframe / Timestamp
Customization
200 EMA Color: Change the line color for better visibility.
Touch Sensitivity: Fine-tune how close price must be to the EMA to count as a touch (default 0.1%).
Enable Touch Alerts: Turn on/off alert notifications easily.
For:
- Swing traders monitoring multiple stocks or assets.
- Day traders watching key EMA levels on different timeframes.
- Analysts requiring a quick visual and alert system for 200 EMA touches.
- Portfolio managers tracking key technical levels across various securities.
Limitations
Supports up to 20 configured symbols (can be extended manually if needed).
Works best on charts with reasonable bar frequency due to request.security usage.
Alert frequency is limited to once per bar for clarity.
Disclaimer
This indicator is provided “as-is” for educational and informational purposes only. It does not guarantee trading success or financial gain.
المتوسط المتحرك الأسي

Supertrend EMA Vol Strategy V5### Supertrend EMA Strategy V5
**Overview**
This is a trend-following strategy designed for cryptocurrency markets like BTC/USD on daily timeframes, combining the Supertrend indicator for dynamic trailing stops with an EMA filter for trend confirmation. It aims to capture strong uptrends while avoiding counter-trend trades, with optional volume filtering for high-conviction entries and ATR-based stop-loss to manage risk. Ideal for long-only setups in bullish assets, it visually highlights trends with green/red bands and fills for easy interpretation. Backtested on BTC from 2024-2025, it shows potential for outperforming buy-and-hold in trending markets, but always use with proper risk management—past performance isn't indicative of future results.
**Key Features**
- **Supertrend Core**: Uses ATR to plot adaptive uptrend (green) and downtrend (red) lines, flipping on closes beyond prior bands for buy/sell signals.
- **EMA Trend Filter**: Entries require price above the EMA (default 21-period) for longs, ensuring alignment with the broader trend.
- **Volume Confirmation**: Optional filter only allows entries when volume exceeds its EMA (default 20-period), reducing false signals in low-activity periods.
- **Risk Controls**: Built-in ATR-multiplier stop-loss (default 2x) to cap losses; exits on Supertrend flips for trailing profits.
- **Visuals**: Green/red lines and highlighter fills for up/down trends, plus buy/sell labels and circles for signals.
- **Customizable Inputs**: Tweak ATR period (default 10), multiplier (default 3), EMA length, start date, long/short toggles, SL, and volume filter.
- **Alerts**: Built-in for buy/sell and direction changes.
**How to Use**
1. Add to your TradingView chart (e.g., BTC/USD 1D).
2. Adjust inputs: Start with defaults for trend-following; increase multiplier for fewer trades/higher win rate. Enable volume filter for volatile assets.
3. Monitor signals: Green "Buy" for long entries (if close > EMA and conditions met); red "Sell" for exits.
4. Backtest in Strategy Tester: Focus on equity curve, win rate (~50-60% in tests), and drawdown (<15% with SL).
5. Live Trading: Use small position sizes (1-2% risk per trade); combine with your analysis. Shorts disabled by default for bull-biased markets.

EMA Deviation with Min/Max Levelshis indicator visualizes the percentage deviation of the closing price from its Exponential Moving Average (EMA), helping traders identify overbought and oversold conditions. It dynamically tracks the minimum and maximum deviation levels over a user-defined lookback period, highlighting extreme zones with color-coded signals:
• 🔵 Normal deviation range
• 🔴 Near historical maximum — potential sell zone
• 🟢 Near historical minimum — potential buy zone
Use it to spot price extremes relative to trend and anticipate possible reversals or mean reversion setups.

MK_OSFT - Multi-timeframe MA Lines with labelsProvides SMA/EMA levels on a chart for the 5m, 15m, 1H and 4H timeframes. It does not draw the full MA's on the chart but provides 'only' the actual MA values at the current candle as a horizontal line with a label.

Trend Impulse Tester | Trend–Impulse–No-Chop (In development) Trend strategy. Regulate your entry and make the drawdown less than 3%, entry at % of capital. Currently under development.
Used on cryptocurrency. The 30 min timeframe was used. Adjust the values yourself, settings are provided

Burt's Multi-EMA RibbonBurt’s Multi-EMA Ribbon is a simple tool for visualising multiple Exponential Moving Averages (EMAs) on the same chart.
It plots the 9, 21, 50, 100, and 200-period EMAs, allowing users to observe their relative positioning. The space between the EMA 9 and EMA 21 is shaded to highlight their relationship.
The script also includes optional alert conditions that notify when EMA 9 moves above or below EMA 21. These features can help traders monitor changes in EMA alignment without constantly watching the chart.
This indicator is intended as an analytical aid and should be used together with other forms of chart analysis. It does not provide buy or sell recommendations.
EMA Hammer DetectorIdentfies hammers and inverted hammers when printed at either the 10, 20, 50, 200 EMAs, after candle close.
Customisable lower and upper shadows, and candle body.
Customisable labels.
Customisable EMA lines.
Can define which of the 4 listed EMAs you want hammers and inverted hammers to be identified.
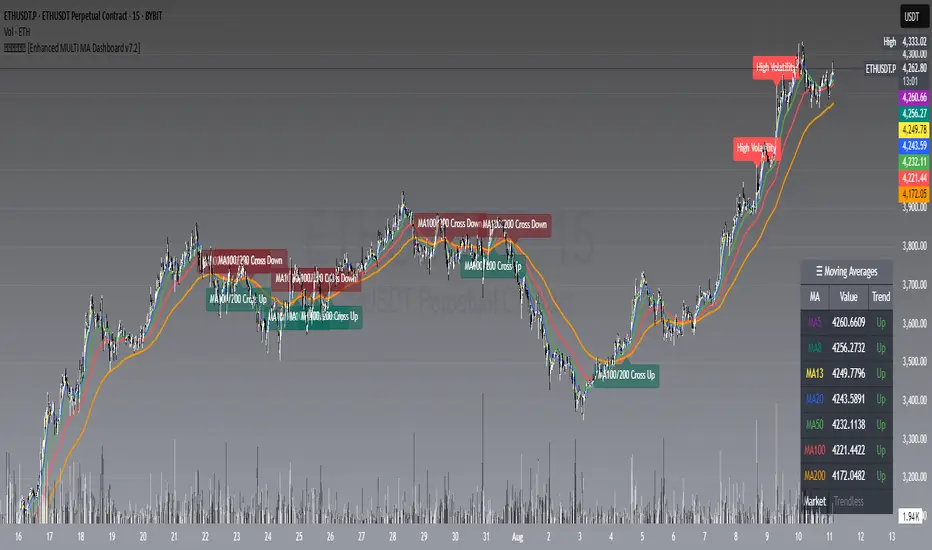
𝙷✪𝚕𝚍𝚎𝚖 [Enhanced MULTI MA Dashboard v7.2]
𝙷✪𝚕𝚍𝚎𝚖 — Enhanced MULTI MA Dashboard v7.2
What it does
A complete moving-average control center that overlays up to seven MAs (5/8/13/20/50/100/200), draws dynamic MA clouds between consecutive pairs, tags crossover events (optional), and shows a compact on-chart dashboard with each MA’s current value and slope-based trend (Up/Down/Flat). It also detects Trendless and High-Volatility regimes to help you adapt your strategy.
Key Features
7 Configurable Moving Averages
Turn each MA on/off individually (5, 8, 13, 20, 50, 100, 200).
Choose type per MA: SMA, EMA, WMA, HMA, VWMA.
Set lengths freely and color each line.
Works on any symbol and timeframe; source selectable (close/open/high/low, etc.).
☁︎ MA Clouds (optional)
Shaded cloud between each consecutive pair (5–8, 8–13, 13–20, 20–50, 50–100, 100–200).
Cloud auto-colors toward the currently dominant MA (above/below) with adjustable transparency.
Quick visual read of short- vs long-side control and compression/expansion.
⚠️ Market Regime Detection
Trendless: measures how tightly short MAs (5, 8, 13) are clustered using std-dev % of their values; user-set threshold.
High Volatility: flags when ATR(Length) > ATR SMA × Multiplier.
Optional background tint and chart labels when regimes flip.
Dashboard cell shows Trending / Trendless / High Volatility with color coding.
➕ Crossover Signal Labels (fully granular)
Toggle labels for any pair you care about (e.g., 5/8, 8/20, 50/200, etc.).
Separate styles/colors for Cross Up and Cross Down; adjustable label size.
Great for momentum shifts, golden/death cross style monitoring, or timing add/reduce decisions.
(Note: these are visual labels; no alertconditions are defined.)
📊 On-Chart MA Dashboard
Compact, movable table (Top/Bottom/Middle, Left/Right/Center).
Columns: MA name, current value, trend direction (derived from MA slope).
Customizable text size, header text, colors, background, optional alternating row colors, and border styling.
Auto-adds a Market row when regime detection is enabled.
How to Use
1 Pick your data source (close by default) and switch on the MAs you care about.
2 Choose MA types and lengths to match your system (e.g., EMA for reactivity, SMA for smoothing).
3 Enable MA Clouds to see compression/expansion and dominance at a glance.
4 Set regime thresholds:
Lower Trendless Threshold → stricter definition of chop.
Raise ATR Multiplier → fewer, “truer” high-volatility flags.
5 Activate specific crossovers that fit your playbook (e.g., 5/20 for short-term momentum, 50/200 for cycle turns).
6 Position and style the dashboard so it stays readable on your layout.
Signal & Reading Guide
Trend column (Up/Down/Flat) reflects the slope of each MA (today vs previous bar).
Cloud flips (color dominance changes) often precede or confirm crossover labels.
Trendless suggests range conditions; consider mean-reversion tools or stand aside.
High Volatility calls for wider stops or volatility-aware sizing; breakouts can travel farther.
Disclaimer
This tool is for education and visualization. It does not constitute financial advice and is not a buy/sell system by itself. Always validate signals within your broader risk-managed plan.
EMA Triad Vanguard Pro [By TraderMan]📌 EMA Triad Vanguard Pro — Advanced Trend & Position Management System
📖 Introduction
EMA Triad Vanguard Pro is an advanced indicator that utilizes three different EMAs (Exponential Moving Averages) to analyze the direction, strength, and reliability of market trends.
It goes beyond a single timeframe, performing trend analysis across 8 different timeframes simultaneously and automatically tracking TP/SL management.
This makes it a powerful reference tool for both short-term traders and medium-to-long-term swing traders.
⚙ How It Works
EMAs:
EMA 21 → Responds quickly to short-term price changes.
EMA 50 → Shows medium-term price direction.
EMA 200 → Determines the long-term market trend.
Trend Direction Logic:
📈 Long Signal: EMA 21 crosses above EMA 200 and EMA 21 > EMA 50.
📉 Short Signal: EMA 21 crosses below EMA 200 and EMA 21 < EMA 50.
Trend Strength Calculation:
Calculates the percentage distance between EMAs.
Strength levels: Very Weak → Weak → Strong → Very Strong.
Multi-Timeframe Analysis:
Analyzes trend direction for: 5min, 15min, 30min, 1H, 4H, Daily, Weekly, and Monthly charts.
Generates an overall market bias from combined results.
Automatic Position Management:
When a position is opened, TP1, TP2, TP3, and SL levels are calculated automatically.
As price reaches these levels, chart labels appear (TP1★, TP2★, TP3★, SL!).
📊 How to Use
1️⃣ Long (Buy) Setup
EMA 21 must cross above EMA 200 ✅
EMA 21 must be above EMA 50 ✅
Overall market bias should be “Bullish” ✅
Entry Price: closing price of the signal candle.
TP levels: calculated based on upward % targets.
SL: a set % below the entry price.
2️⃣ Short (Sell) Setup
EMA 21 must cross below EMA 200 ✅
EMA 21 must be below EMA 50 ✅
Overall market bias should be “Bearish” ✅
Entry Price: closing price of the signal candle.
TP levels: calculated based on downward % targets.
SL: a set % above the entry price.
💡 Pro Tips
Multi-timeframe alignment significantly increases the signal reliability.
If trend strength is “Very Strong”, chances of hitting TP targets are higher.
Weak trends may cause false signals → confirm with extra indicators (RSI, MACD, Volume).
TP levels are ideal for partial take-profits → lock in gains and reduce risk.
📌 Advantages
✅ Displays both trend direction and trend strength at a glance.
✅ Multi-timeframe approach avoids tunnel vision from a single chart.
✅ Automatic TP/SL calculation eliminates manual measuring.
✅ Labeled signal alerts make tracking positions easy and visual.
⚠ Important Notes
No indicator is 100% accurate — sudden news events or manipulations may cause false signals.
Use it together with other technical and fundamental analysis methods.
Signal reliability may decrease in low liquidity markets.
🎯 In summary:
EMA Triad Vanguard Pro combines trend tracking, position management, and multi-timeframe analysis in a single package, helping professional traders reduce workload and make more strategic trades.

EMA Cross 5/21 with Accurate Break Triangles & Clean Prev OHLCEMA Cross 5/21 with Structure Break & OHLC Levels
Purpose
This strategy combines EMA crossovers with market structure breakouts for more reliable trade signals.
It enhances trade context by plotting Previous Day and Previous Week key levels (Open, High, Low, Close), which are widely used for intraday decision-making.
Core Components
1. EMA Trend Filter
Uses a fast EMA (5) and a slow EMA (21).
Bullish bias: EMA 5 crosses above EMA 21.
Bearish bias: EMA 5 crosses below EMA 21.
EMA cross serves as the initial momentum shift signal.
2. Market Structure Break Confirmation
After an EMA cross, the script looks for a structure break within 3 candles:
Bullish Break: Price closes above the most recent swing high.
Bearish Break: Price closes below the most recent swing low.
Swing points are determined using a 3-bar lookback on each side.
This confirmation filters out false EMA crosses that occur during consolidation.
3. Entry Signal Visualization
Green triangle below the bar = Bullish structure break within 3 bars after bullish EMA cross.
Red triangle above the bar = Bearish structure break within 3 bars after bearish EMA cross.
These markers appear only when both EMA direction and structure break agree.
4. Key Market Levels (Support/Resistance)
The script automatically draws straight horizontal reference lines for:
Previous Day OHLC:
PDO – Previous Day Open (Blue)
PDC – Previous Day Close (Yellow)
PDH – Previous Day High (Red)
PDL – Previous Day Low (Green)
Previous Week OHLC (lighter shades):
PWO – Previous Week Open (Light Blue)
PWC – Previous Week Close (Light Yellow)
PWH – Previous Week High (Light Red)
PWL – Previous Week Low (Light Green)
These levels help traders identify:
Potential support/resistance zones.
High-probability breakout or reversal points.
Institutional liquidity levels.
Trading Logic
Wait for EMA cross to set bias (bullish or bearish).
Within 3 bars, check for a break of the last swing high/low in the direction of bias.
Plot signal (green triangle up for bullish, red triangle down for bearish).
Use PD/PW levels as confluence zones for entry, stop placement, or target setting.
Advantages
Filters out many false signals from simple EMA cross strategies.
Adds market structure awareness.
Automatically integrates important daily/weekly reference levels.
Signals are visually intuitive for faster decision-making.
Best Use Cases
Intraday trading: Using PD/PW levels for scalping or day trades.
Swing trading: Waiting for higher timeframe EMA cross + structure break confirmation.
Breakout trading: Combining PDH/PDL or PWH/PWL breaks with EMA confirmation.

Multi-EMAMulti-EMA Indicator
This script plots five commonly used Exponential Moving Averages (EMAs) on your chart for trend identification and trade timing.
Included EMAs & Colors:
EMA 8 — Red
EMA 20 — Orange
EMA 50 — Yellow
EMA 100 — Cyan
EMA 200 — Blue
How to use:
Shorter EMAs (8 & 20) help identify short-term momentum and potential entry/exit points.
Mid-range EMA (50) gives a broader view of intermediate trends.
Longer EMAs (100 & 200) are used to confirm long-term trend direction and key support/resistance zones.
Crossovers between EMAs can signal potential trend changes.
Price trading above most EMAs often signals bullish conditions, while trading below suggests bearish momentum.
Designed to work on any timeframe or market.

Trend Filter (Higher Timeframe EMA)English (EN)
This indicator overlays the higher timeframe (default: 1H) EMA trend onto your current chart to serve as a directional filter for trading decisions.
- Fetches and plots EMA20 / EMA50 / EMA200 from a higher timeframe (user-configurable)
- Identifies LONG trend when EMA20 > EMA50 > EMA200, SHORT trend when EMA20 < EMA50 < EMA200
- Changes background color based on trend direction (Green = Long, Red = Short)
- Can trigger alerts when a new trend direction is detected
1. Apply this script to lower timeframes such as 5m or 15m charts to see the higher timeframe trend.
2. When the background is green, consider long setups; when red, consider short setups.
3. Use this as a filter in conjunction with your main entry signals, not as a standalone strategy.
- Default higher timeframe is 1 hour, but you can change it in the settings.
- This script does not provide financial advice. Use at your own risk.
日本語(JP)
このインジケーターは、現在のチャートに上位足(デフォルト:1時間足)のEMAトレンドを重ねて表示し、売買方向のフィルターとして利用できます。
【機能】
- 上位足(設定可能)のEMA20 / EMA50 / EMA200 を取得して表示
- EMA20 > EMA50 > EMA200 でロングトレンド、EMA20 < EMA50 < EMA200 でショートトレンド判定
- トレンド方向に応じて背景色を変化(緑=ロング、赤=ショート)
- トレンド発生時にアラートを送信可能
【使い方】
1. 5分足や15分足など短期足に適用し、背景色で上位足の流れを確認します。
2. 背景が緑の時は買い目線、赤の時は売り目線で短期エントリーを検討します。
3. 単独での売買判断ではなく、他のテクニカル指標と併用してご利用ください。
【注意】
- デフォルトは1時間足で計算していますが、設定から変更可能です。
- 本スクリプトは投資助言を行うものではありません。ご利用は自己責任でお願いします。

Clean Multi-Indicator Alignment System
Overview
A sophisticated multi-indicator alignment system designed for 24/7 trading across all markets, with pure signal-based exits and no time restrictions. Perfect for futures, forex, and crypto markets that operate around the clock.
Key Features
🎯 Multi-Indicator Confluence System
EMA Cross Strategy: Fast EMA (5) and Slow EMA (10) for precise trend direction
VWAP Integration: Institution-level price positioning analysis
RSI Momentum: 7-period RSI for momentum confirmation and reversal detection
MACD Signals: Optimized 8/17/5 configuration for scalping responsiveness
Volume Confirmation: Customizable volume multiplier (default 1.6x) for signal validation
🚀 Advanced Entry Logic
Initial Full Alignment: Requires all 5 indicators + volume confirmation
Smart Continuation Entries: EMA9 pullback entries when trend momentum remains intact
Flexible Time Controls: Optional session filtering or 24/7 operation
🎪 Pure Signal-Based Exits
No Forced Closes: Positions exit only on technical signal reversals
Dual Exit Conditions: EMA9 breakdown + RSI flip OR MACD cross + EMA20 breakdown
Trend Following: Allows profitable trends to run their full course
Perfect for Swing Scalping: Ideal for multi-session position holding
📊 Visual Interface
Real-Time Status Dashboard: Live alignment monitoring for all indicators
Color-Coded Candles: Instant visual confirmation of entry/exit signals
Clean Chart Display: Toggle-able EMAs and VWAP with professional styling
Signal Differentiation: Clear labels for entries, X-crosses for exits
🔔 Alert System
Entry Notifications: Separate alerts for buy/sell signals
Exit Warnings: Technical breakdown alerts for position management
Mobile Ready: Push notifications to TradingView mobile app
Market Applications
Perfect For:
Gold Futures (GC): 24-hour precious metals trading
NASDAQ Futures (NQ): High-volatility index scalping
Forex Markets: Currency pairs with continuous operation
Crypto Trading: 24/7 cryptocurrency momentum plays
Energy Futures: Oil, gas, and commodity swing trades
Optimal Timeframes:
1-5 Minutes: Ultra-fast scalping during high volatility
5-15 Minutes: Balanced approach for most markets
15-30 Minutes: Swing scalping for trend following
🧠 Smart Position Management
Tracks implied position direction
Prevents conflicting signals
Allows trend continuation entries
State-aware exit logic
⚡ Scalping Optimized
Fast-reacting indicators with shorter periods
Volume-based confirmation reduces false signals
Clean entry/exit visualization
Minimal lag for time-sensitive trades
Configuration Options
All parameters fully customizable:
EMA Lengths: Adjustable from 1-30 periods
RSI Period: 1-14 range for different market conditions
MACD Settings: Fast (1-15), Slow (1-30), Signal (1-10)
Volume Confirmation: 0.5-5.0x multiplier range
Visual Preferences: Colors, displays, and table options
Risk Management Features
Clear visual exit signals prevent emotion-based decisions
Volume confirmation reduces false breakouts
Multi-indicator confluence improves signal quality
Optional time filtering for session-specific strategies
Best Use Cases
Futures Scalping: NQ, ES, GC during active sessions
Forex Swing Trading: Major pairs during overlap periods
Crypto Momentum: Bitcoin, Ethereum trend following
24/7 Automated Systems: Algorithmic trading implementation
Multi-Market Scanning: Portfolio-wide signal monitoring

EMA72 com Difusor - Cor Dinâmica e Espessuras Ajustadas17 EMA
72 EMA (with diffuser included, green signals buy, red signals sell)
72 EMA on the weekly chart

VHX EMA 135/315📈 EMA 135/315 Cross Strategy – Your Trend Compass with Smart Confirmations
🔍 Core Idea
The EMA 135/315 Cross strategy is a trend-following system.
It tracks two moving averages:
EMA 135 → the “fast” line that reacts to short-term price moves
EMA 315 → the “slow” line that reacts to the bigger trend
When the fast EMA crosses above the slow EMA → market momentum is turning up → BUY signal 🟢
When the fast EMA crosses below the slow EMA → momentum is turning down → SELL signal 🔴
This gives you a clear entry trigger — no guessing, no overcomplication.
✨ On Your Chart
BUY/SELL Arrows
🟢 Green arrow = bullish cross → trend turning up
🔴 Red arrow = bearish cross → trend turning down
Trend Info Panel (Top Left)
Current Trend: BUY / SELL / Neutral
Last Cross: how many bars ago it happened
EMA Gap in %: measures the strength of the trend
Status: “Approaching” if EMAs are getting close → possible cross soon
Automatic TP/SL Levels
📈 TP line (+2% from entry)
📉 SL line (–0.5% from entry)
Saves time — you instantly see your target and protection
EMA Distance Meter
Big % gap = strong trend momentum 🚀
Small % gap = weak or sideways market ⚠️
Real-Time Alerts
You get notified when a cross happens, even if you’re away from the screen
🧠 The Logic Behind It
The EMA 135 reacts faster → it reflects short-term momentum
The EMA 315 moves slower → it reflects the main trend
When the fast EMA overtakes the slow EMA: short-term strength now aligns with the long-term trend → higher probability of a sustained move
The gap % tells you how strong the alignment is — large gap = cleaner moves, small gap = market in transition
“Approaching” status warns that the EMAs are converging, which often happens before a reversal
📊 Boosting the Strategy with Volume Analysis
The EMA cross is a strong trigger, but volume confirms the quality of the move:
High Volume + Cross → more reliable signal, as strong market participation is pushing the trend
Low Volume + Cross → caution, the move might be weak or a false breakout
💡 Tip:
Check the volume histogram or a volume-based indicator (e.g., Volume Profile, OBV).
On a BUY signal: volume should spike above the recent average.
On a SELL signal: watch for strong selling volume bars.
📍 Adding Support & Resistance for Precision
Support and resistance levels help filter out bad trades and optimize entries:
Best BUY setups:
EMA 135 crosses above EMA 315 near a known support zone
Bonus if volume confirms the move
Avoid buying directly into a strong resistance
Best SELL setups:
EMA 135 crosses below EMA 315 near a known resistance zone
Bonus if selling volume is strong
Avoid selling directly into a major support
💡 Use tools like horizontal lines, previous highs/lows, and Volume Profile nodes to spot these zones.
📈 Best Usage Practices
Timeframes
Lower timeframes (1m–5m) → more signals, but more noise → best for scalping with extra filters
Always Combine With Confirmation
EMA Cross = Trigger
Volume spike = Confirmation
S/R zone in your favor = High-probability setup
Manage Risk
Start with the built-in TP/SL
Adjust SL if volatility is higher than usual
Consider trailing stop once price moves in your favor
Avoid Sideways Markets
If EMA gap % is very small and crosses happen often → stand aside until a clear direction forms
Use Alerts
Set alerts for BUY & SELL crosses so you never miss a setup
In short:
This isn’t just an EMA cross indicator — it’s a trend system with built-in risk management, strength measurement, and pre-trade preparation. Combine it with volume confirmation and smart use of support/resistance, and you turn a simple signal into a high-probability trading edge.

EMA 9, 20, 50Exponential Moving Averages of 9, 20, and 50. Used to gauge buy and sell opportunities in trending markets.
EMA Pullback Entry SignalsEMA Pullback Entry Signals is a tool designed to help traders identify trend continuation opportunities by detecting price pullbacks toward a slow EMA (Exponential Moving Average) during trending conditions.
This indicator combines moving average crossovers, price interaction with EMAs, and optional filtering to improve the timing and quality of trend entries.
Core Features:
Golden Cross / Death Cross Detection
Golden Cross: Fast EMA crossing above Slow EMA
Death Cross: Fast EMA crossing below Slow EMA
Optional X-shaped markers for crossover visualization
Pullback Signal on Slow EMA
Green triangle: Price crosses up through the slow EMA during a bullish trend
Red triangle: Price crosses down through the slow EMA during a bearish trend
Designed to capture continuation entries after a trend pullback
Optional Fast EMA Signals
Green arrow: Price crosses above fast EMA in a bull trend
Red arrow: Price crosses below fast EMA in a bear trend
Helps confirm minor retracements or short-term momentum shifts
Sideways Market Filter
Suppresses signals when the fast and slow EMAs are too close
Prevents entries during low-trend or choppy price action
Cooldown Timer
Enforces a minimum bar interval between signals to reduce overtrading
Helps avoid multiple entries from clustered signals
Custom Alerts
Alerts available for all signal types
Include ticker and timeframe in each alert message
Configurable Settings:
Fast and slow EMA lengths1
Toggle individual signal types (pullbacks, fast EMA crosses, crossovers)
Enable/disable cooldown logic and set bar duration
Sideways market detection sensitivity (EMA proximity threshold)
Primary Use Case
This script is most useful for trend-following traders seeking to enter pullbacks after a trend is established. When the price retraces to the slow EMA and then resumes in the trend direction, it can offer high-quality continuation setups. Works well across timeframes and markets.

[DrIntensiveCare17] Zero-Lag ScalpingThe Zero-Lag Scalping strategy is a short-term trading system designed for high-precision entries based on the relationship between a Zero-Lag Moving Average (ZLMA) and a standard Exponential Moving Average (EMA). It incorporates lateral market filtering, risk management with stop loss (SL) and take profit (TP), breakeven logic, visual trade markers, and a performance statistics table.
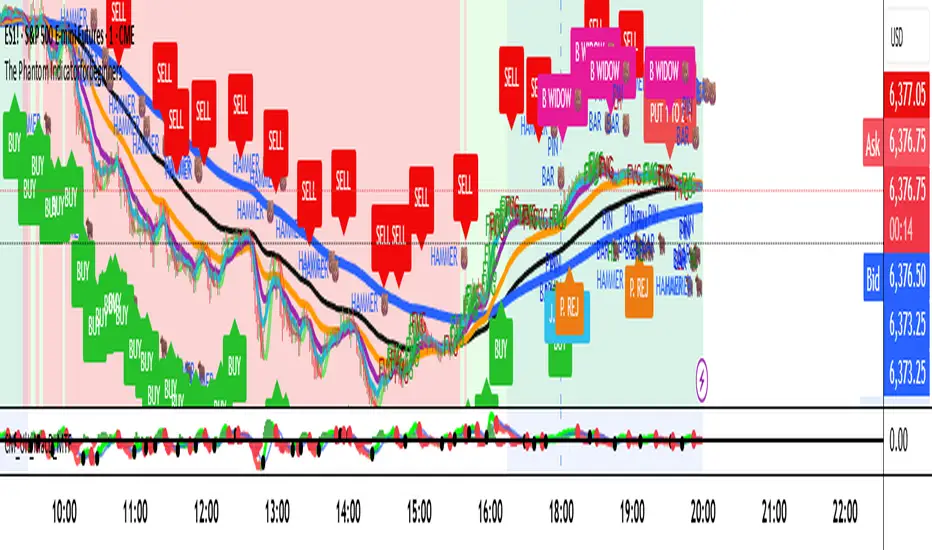
The Phantom Indicator for beginnersThe Phantom Indicator is an original software script written in Pine Script for use on the TradingView charting platform. It is designed as a real-time algorithmic trading and technical analysis toolkit that integrates multiple market signals into a unified framework. The work is a compilation of open-source trading concepts, modified and combined in a novel and proprietary manner, resulting in a unique educational tool.
Key features include:
Dynamic background shading based on price relation to the 200-period Exponential Moving Average (EMA)
Multi-timeframe Hull Moving Averages rendered as ribbons to show directional bias
A custom Fair Value Gap (FVG) detection algorithm
ATR-based trailing stop logic, inspired by UT Bot
Visual markers for candlestick rejection patterns, labeled “J. Wick” (bullish) and “Black Widow” (bearish)
Real-time structural pivot recognition, identifying Higher Highs, Lower Lows, and Break of Structure (BOS)
Interactive label alerts, trend-based visuals, and adaptive ribbon overlays
This indicator is intended to train beginner traders to:
Recognize candlestick reversal patterns
Understand trend creation and breakage
Learn to identify market direction using real-time, rule-based logic
Mutanabby_AI | Ultimate Algo | Remastered+Overview
The Mutanabby_AI Ultimate Algo Remastered+ represents a sophisticated trend-following system that combines Supertrend analysis with multiple moving average confirmations. This comprehensive indicator is designed specifically for identifying high-probability trend continuation and reversal opportunities across various market conditions.
Core Algorithm Components
**Supertrend Foundation**: The primary signal generation relies on a customizable Supertrend indicator with adjustable sensitivity (1-20 range). This adaptive trend-following tool uses Average True Range calculations to establish dynamic support and resistance levels that respond to market volatility.
**SMA Confirmation Matrix**: Multiple Simple Moving Averages (SMA 4, 5, 9, 13) provide layered confirmation for signal strength. The algorithm distinguishes between regular signals and "Strong" signals based on SMA 4 vs SMA 5 relationship, offering traders different conviction levels for position sizing.
**Trend Ribbon Visualization**: SMA 21 and SMA 34 create a visual trend ribbon that changes color based on their relationship. Green ribbon indicates bullish momentum while red signals bearish conditions, providing immediate visual trend context.
**RSI-Based Candle Coloring**: Advanced 61-tier RSI system colors candles with gradient precision from deep red (RSI ≤20) through purple transitions to bright green (RSI ≥79). This visual enhancement helps traders instantly assess momentum strength and overbought/oversold conditions.
Signal Generation Logic
**Buy Signal Criteria**:
- Price crosses above Supertrend line
- Close price must be above SMA 9 (trend confirmation)
- Signal strength determined by SMA 4 vs SMA 5 relationship
- "Strong Buy" when SMA 4 ≥ SMA 5
- Regular "Buy" when SMA 4 < SMA 5
**Sell Signal Criteria**:
- Price crosses below Supertrend line
- Close price must be below SMA 9 (trend confirmation)
- Signal strength based on SMA relationship
- "Strong Sell" when SMA 4 ≤ SMA 5
- Regular "Sell" when SMA 4 > SMA 5
Advanced Risk Management System
**Automated TP/SL Calculation**: The indicator automatically calculates stop loss and take profit levels using ATR-based measurements. Risk percentage and ATR length are fully customizable, allowing traders to adapt to different market conditions and personal risk tolerance.
**Multiple Take Profit Targets**:
- 1:1 Risk-Reward ratio for conservative profit taking
- 2:1 Risk-Reward for balanced trade management
- 3:1 Risk-Reward for maximum profit potential
**Visual Risk Display**: All risk management levels appear as both labels and optional trend lines on the chart. Customizable line styles (solid, dashed, dotted) and positioning ensure clear visualization without chart clutter.
**Dynamic Level Updates**: Risk levels automatically recalculate with each new signal, maintaining current market relevance throughout position lifecycles.
Visual Enhancement Features
**Customizable Display Options**: Toggle trend ribbon, TP/SL levels, and risk lines independently. Decimal precision adjustments (1-8 decimal places) accommodate different instrument price formats and personal preferences.
**Professional Label System**: Clean, informative labels show entry points, stop losses, and take profit targets with precise price levels. Labels automatically position themselves for optimal chart readability.
**Color-Coded Momentum**: The gradient RSI candle coloring system provides instant visual feedback on momentum strength, helping traders assess market energy and potential reversal zones.
Implementation Strategy
**Timeframe Optimization**: The algorithm performs effectively across multiple timeframes, with higher timeframes (4H, Daily) providing more reliable signals for swing trading. Lower timeframes work well for day trading with appropriate risk adjustments.
**Sensitivity Adjustment**: Lower sensitivity values (1-5) generate fewer but higher-quality signals, ideal for conservative approaches. Higher sensitivity (15-20) increases signal frequency for active trading styles.
**Risk Management Integration**: Use the automated risk calculations as baseline parameters, adjusting risk percentage based on account size and market conditions. The 1:1, 2:1, 3:1 targets enable systematic profit-taking strategies.
Market Application
**Trend Following Excellence**: Primary strength lies in capturing significant trend movements through the Supertrend foundation with SMA confirmation. The dual-layer approach reduces false signals common in single-indicator systems.
**Momentum Assessment**: RSI-based candle coloring provides immediate momentum context, helping traders assess signal strength and potential continuation probability.
**Range Detection**: The trend ribbon helps identify ranging conditions when SMA 21 and SMA 34 converge, alerting traders to potential breakout opportunities.
Performance Optimization
**Signal Quality**: The requirement for both Supertrend crossover AND SMA 9 confirmation significantly improves signal reliability compared to basic trend-following approaches.
**Visual Clarity**: The comprehensive visual system enables rapid market assessment without complex calculations, ideal for traders managing multiple instruments.
**Adaptability**: Extensive customization options allow fine-tuning for specific markets, trading styles, and risk preferences while maintaining the core algorithm integrity.
## Non-Repainting Design
**Educational Note**: This indicator uses standard TradingView functions (Supertrend, SMA, RSI) with normal behavior patterns. Real-time updates on current candles are expected and standard across all technical indicators. Historical signals on closed candles remain fixed and unchanged, ensuring reliable backtesting and analysis.
**Signal Confirmation**: Final signals are confirmed only when candles close, following standard technical analysis principles. The algorithm provides clear distinction between developing signals and confirmed entries.
Technical Specifications
**Supertrend Parameters**: Default sensitivity of 4 with ATR length of 11 provides balanced signal generation. Sensitivity range from 1-20 allows adaptation to different market volatilities and trading preferences.
**Moving Average Configuration**: SMA periods of 8, 9, and 13 create multi-layered trend confirmation, while SMA 21 and 34 form the visual trend ribbon for broader market context.
**Risk Management**: ATR-based calculations with customizable risk percentage ensure dynamic adaptation to market volatility while maintaining consistent risk exposure principles.
Recommended Settings
**Conservative Approach**: Sensitivity 4-5, RSI length 14, higher timeframes (4H, Daily) for swing trading with maximum signal reliability.
**Active Trading**: Sensitivity 6-8, RSI length 8-10, intermediate timeframes (1H) for balanced signal frequency and quality.
**Scalping Setup**: Sensitivity 10-15, RSI length 5-8, lower timeframes (15-30min) with enhanced risk management protocols.
## Conclusion
The Mutanabby_AI Ultimate Algo Remastered+ combines proven trend-following principles with modern visual enhancements and comprehensive risk management. The algorithm's strength lies in its multi-layered confirmation approach and automated risk calculations, providing both novice and experienced traders with clear signals and systematic trade management.
Success with this system requires understanding the relationship between signal strength indicators and adapting sensitivity settings to match current market conditions. The comprehensive visual feedback system enables rapid decision-making while the automated risk management ensures consistent trade parameters.
Practice with different sensitivity settings and timeframes to optimize performance for your specific trading style and risk tolerance. The algorithm's systematic approach provides an excellent framework for disciplined trend-following strategies across various market environments.

The Barking Rat ReversionsMean Reversion with Multi-Layered Precision
The Barking Rat Reversions is a short-term mean reversion strategy tailored for high-volatility markets. It combines several well-established technical tools in a configuration to identify overextended price movements likely to revert toward equilibrium. The goal is to isolate high-quality, short-term reversal opportunities while filtering out low-conviction setups.
At its core, our strategy triggers off Fair Value Gaps (FVGs) that occur a considerable distance away from a dynamically defined equilibrium band. It then validates these gaps by checking proximity to recent support and resistance drawn from swing extremes.
Additional confirmation comes from momentum filters and wick-rejection patterns, ensuring each entry aligns with both price structure and stretched momentum. Exits use volatility-adjusted profit targets. Keeping the approach disciplined and adaptive.
🧠Core Logic: Selectivity & Structure
This strategy is intentionally very selective. We have designed it to filter out roughly 95% of all market noise, highlighting only setups that pass multiple validation layers outlined below.
Fair Value Gaps (FVGs) as the Primary Trigger
FVGs identify imbalance zones where price historically retraces. These inefficient zones often become magnets for reversion as the market seeks to rebalance.
Dynamic Equilibrium Band + S/R
Defines a fair value zone with a long-term moving average and combines it with shorter-term swing pivots to establish support/resistance. Only FVGs that occur outside the band and near recent pivots are considered, ensuring reversals are sufficiently distanced and not taken too close to the mean.
Proximity to Support/Resistance
Setup validity depends on location. The strategy filters for FVGs near well-defined structural levels — areas where price has previously turned (i.e., recent swing highs or lows). This increases the likelihood that reversals are occurring at legitimate zones of confluence.
Wick-Rejection Confirmation
Confirms potential exhaustion through characteristic candle wick patterns beyond the equilibrium region. This acts as another filter to improve signal accuracy.
Sequential Filtered Signals
Custom logic ensures that a new signal in any direction must improve upon the previous one, preventing repetitive or suboptimal entries.
Multi-Step Confirmation
All validation layers must coincide on the same bar before a signal triggers, dramatically reducing false positives.
📈Chart Visuals: Designed for Clarity
To ensure transparency and easy interpretation, the script overlays intuitive visuals:
Green “▲” below a candle: Indicates a potential long entry
Red “▼” above a candle: Indicates a potential short entry
Green “✔️”: Marks exit from a trade when ATR target is met
Background shading (green/red): Indicates trade direction while active
Support/Resistance lines: Auto-plotted from recent swing levels
🔔Alerts: Stay Notified Without Watching
The strategy supports real-time alerts on candle close, ensuring that signals are only triggered once fully confirmed.
You must manually set up alerts within your TradingView account. Once configured, you’ll be able to set up one alert per instrument. This one alert covers all relevant signals and exits — ideal for hands-free monitoring.
⚙️Strategy report properties
Position size: 25% equity per trade
Initial capital: 10,000.00 USDT
Pyramiding: 10 entries per direction
Slippage: 2 ticks
Commission: 0.055% per side
Backtest timeframe: 1-minute
Backtest instrument: HYPEUSDT
Backtesting range: Jul 21, 2025 — Aug 7, 2025
Note on Sample Size:
You’ll notice the report displays fewer than the ideal 100 trades in the strategy report above. This is intentional. The goal of the script is to isolate high-quality, short-term reversal opportunities while filtering out low-conviction setups. This means that the Barking Rat Reversions strategy is ultra-selective, filtering out over 95% of market noise by enforcing multiple validation layers. The brief timeframe shown in the strategy report here illustrates its filtering logic over a short window — not its full capabilities. As a result, even on lower timeframes like the 1-minute chart, signals are deliberately sparse — each one must pass all criteria before triggering.
We conducted a broader backtest covering the period from December 5, 2024 to July 31, 2025, during which the strategy identified 968 high-probability setups on the same instrument and timeframe as the strategy report.
For a larger dataset:
Once the strategy is applied to your chart, users are encouraged to expand the lookback range or apply the strategy to other volatile pairs to view a full sample.
💡Why 25% Equity Per Trade?
While it's always best to size positions based on personal risk tolerance, we defaulted to 25% equity per trade in the backtesting data — and here’s why:
Backtests using this sizing show manageable drawdowns even under volatile periods
The strategy generates a sizeable number of trades, reducing reliance on a single outcome
Combined with conservative filters, the 25% setting offers a balance between aggression and control
Users are strongly encouraged to customize this to suit their risk profile.
🔍What Makes This Strategy Unique?
Multi-factor confirmation using FVGs, EMA deviation, RSI, wick rejection, and S/R
Clean, Intuitive Chart Experience
Real-time alerts triggered only on confirmation
Variables monitor prior reversal points, guaranteeing each new signal offers an improved entry
Tracks active positions and resets filters upon exit.

TrendGradient [By TraderMan]TrendGradient Indicator: What It Does, How It Works, and How to Use It 📊✨
The **TrendGradient ** indicator is a Pine Script tool designed for the TradingView platform, assisting traders in trend analysis, generating buy/sell signals, and determining target price (TP) and stop-loss (SL) levels. In this guide, I’ll explain in detail what the indicator does, how it operates, how to use it, and strategies for opening positions. Get ready to dive into this colorful and powerful tool! 🚀
🌟 **What Is TrendGradient and What Does It Do?**
TrendGradient is an indicator that analyzes price movements to identify trend direction and strength while generating actionable buy and sell signals. Here are its core functions:
1. **Trend Tracking**: Uses 38-period and 62-period Exponential Moving Averages (EMAs) to determine the trend direction (bullish or bearish).
2. **Buy/Sell Signals**: Generates signals based on EMA crossovers and crossunders.
3. **Target and Stop Levels**: Calculates entry, take-profit (TP1, TP2, TP3), and stop-loss (SL) levels using the Average True Range (ATR).
4. **Volatility and Trend Analysis**: Visualizes volatility levels (low, medium, high) and trend strength (strong/weak) via ATR and EMA.
5. **Visual Clarity**: Provides a user-friendly interface with colored lines, labels, tables, and shapes.
This indicator is ideal for trend-following traders and can be used for both short-term (scalping/day trading) and long-term strategies. 📈
---
### 🛠️ **How Does TrendGradient Work?**
Let’s break down the indicator’s mechanics step by step:
#### 1. **EMA-Based Trend Analysis** 📉
- **EMA 38 and EMA 62**: The indicator uses 38-period and 62-period Exponential Moving Averages to smooth price data and identify trend direction.
- **EMA 38 > EMA 62**: Bullish trend (uptrend) 📈
- **EMA 38 < EMA 62**: Bearish trend (downtrend) 📉
- EMA crossovers trigger buy/sell signals:
- **Crossover (EMA 38 crosses above EMA 62)**: Buy signal (BUY).
- **Crossunder (EMA 38 crosses below EMA 62)**: Sell signal (SELL).
- The EMAs focus on the last 20 days of data to display recent trends only.
#### 2. **ATR-Based Levels** ⚖️
- **ATR (Average True Range)**: Measures price volatility and is used to calculate entry, TP, and SL levels.
- **Entry Price**: For buys, the closing price plus an ATR multiplier; for sells, the closing price minus an ATR multiplier.
- **Take-Profit Levels (TP1, TP2, TP3)**: Calculated by adding/subtracting ATR multiples (default: 2.0, 4.0, 6.0) to/from the entry price.
- **Stop-Loss (SL)**: Set at a distance from the entry price using an ATR multiplier (default: 2.0 + additional SL).
- These levels are visualized on the chart with colored lines (yellow: entry, green: TP1, teal: TP2, blue: TP3, red: SL) and labels.
#### 3. **Signal and Status Visualization** 🖼️
- **Lines and Labels**: Buy/sell signals are marked with green "BUY" and red "SELL" labels on the chart.
- **Table**: A table in the top-right corner summarizes signal status, entry/TP/SL levels, trend strength, volatility, and trend direction.
- **Color Coding**:
- Green: Bullish trend, buy signal, or TP achievements.
- Red: Bearish trend, sell signal, or SL triggered.
- Yellow, teal, blue: Entry and TP levels.
- **Bar Coloring**: Bars are colored green (bullish) or red (bearish) based on EMA alignment.
#### 4. **TP/SL Monitoring** ✅❌
- The indicator checks if the price hits TP or SL levels and displays labels like "✔️ TP Achieved" or "❌ SL Stopped Out."
- When a TP or SL is hit, the position status updates (e.g., "In Progress ⏳", "Successful ✅", or "Failed ❌").
#### 5. **Volatility and Trend Strength** 📊
- **Volatility (ATR)**: Classified as "Low" (red), "Medium" (orange), or "High" (green) based on the ATR’s position within its 50-bar range.
- **Trend Strength**: If EMA 38 > EMA 62, the trend is "Strong" (green); otherwise, it’s "Weak" (red).
---
### 📋 **How to Use TrendGradient?**
Follow these steps to effectively use TrendGradient:
#### 1. **Add the Indicator to TradingView** 🖥️
- In TradingView, search for "TrendGradient " in the **Indicators** menu and add it to your chart.
- Use default settings or customize parameters like ATR period, multipliers, and display duration (default: 20 days) in the **Settings** menu.
#### 2. **Identify Signals** 🔍
- **Buy Signal (BUY)**: Appears when a green "BUY" label is displayed and EMA 38 crosses above EMA 62.
- **Sell Signal (SELL)**: Appears when a red "SELL" label is displayed and EMA 38 crosses below EMA 62.
- Check the top-right table for signal status ("BUY", "SELL", or "-") and position levels (Entry, TP1, TP2, TP3, SL).
#### 3. **Opening a Position** 🚪
- **Long Position (Buy)**:
1. When a "BUY" signal appears, check the entry price (yellow line).
2. Open a position at or near the entry price.
3. Set TP1, TP2, TP3 (green, teal, blue lines) and SL (red line) as targets/stops.
- **Short Position (Sell)**:
1. When a "SELL" signal appears, check the entry price.
2. Open a position at or near the entry price.
3. Use TP and SL levels as targets/stops.
- **Note**: ATR-based levels adjust dynamically to market volatility, ensuring adaptability.
#### 4. **Position Management** 🛡️
- **Take-Profit (TP)**: Realize profits when the price hits TP1, TP2, or TP3. For example, close part of the position at TP1 and hold the rest for TP2/TP3.
- **Stop-Loss (SL)**: Close the position if the price hits the SL level ("❌ SL Stopped Out" appears).
- **Partial Closes**: Use multiple TP levels to scale out of positions incrementally.
#### 5. **Trend and Volatility Analysis** 📊
- **Trend Direction and Strength**: The table shows whether the trend is "Up" or "Down" and its strength ("Strong" or "Weak"). Strong trends may warrant more aggressive positions.
- **Volatility**: ATR-based volatility indicators help gauge market conditions. High volatility (green) suggests larger price moves, while low volatility (red) indicates calmer markets.
#### 6. **Risk Management** ⚠️
- Always use the SL level and assess the risk/reward ratio (e.g., 2:1 for TP1, 4:1 for TP2).
- In low volatility (red), consider smaller positions; in high volatility (green), expect larger moves.
---
### 🛠️ **Example Position Opening Scenario**
**Scenario: Long Position**
- **Situation**: EMA 38 crosses above EMA 62, and a green "BUY" label appears.
- **Entry Price**: 100 (yellow line).
- **TP Levels**: TP1: 104, TP2: 108, TP3: 112.
- **SL Level**: 96.
- **Strategy**:
1. Open a long position at 100.
2. Close 50% of the position at TP1 (104), hold the rest for TP2 (108) or TP3 (112).
3. Exit fully if the price hits SL (96).
- **Table Status**: "Signal: BUY", "Position Status: In Progress ⏳", "Trend Strength: Strong", "Volatility: High".
**Scenario: Short Position**
- **Situation**: EMA 38 crosses below EMA 62, and a red "SELL" label appears.
- **Entry Price**: 100.
- **TP Levels**: TP1: 96, TP2: 92, TP3: 88.
- **SL Level**: 104.
- **Strategy**: Manage the position similarly, scaling out at TP levels.
---
### 💡 **Tips and Suggestions**
1. **Timeframe**: The indicator works across timeframes (1H, 4H, daily). Short-term traders can use 1H-4H, while long-term traders may prefer daily charts.
2. **Combine with Other Indicators**: Use RSI, MACD, or support/resistance levels to confirm signals.
3. **Backtesting**: Test the strategy on historical data to evaluate performance.
4. **Customization**: Adjust ATR multipliers or EMA periods to suit your market or strategy.
5. **Discipline**: Stick to signals and avoid emotional decisions.
---
### 🎨 **Visual Features**
- **Colored Lines and Labels**: Entry, TP, and SL levels are displayed with colored lines (yellow, green, teal, blue, red) for clarity.
- **Table**: The top-right table summarizes all key information (signal, levels, trend, volatility).
- **Bar Coloring**: Green bars for bullish trends and red bars for bearish trends make trend direction easy to spot.
- **Emojis**: Position status is enhanced with emojis like ⏳ (in progress), ✅ (successful), and ❌ (failed) for visual appeal.
---
### ⚠️ **Warnings and Limitations**
- **Market Conditions**: The indicator performs best in trending markets; it may produce false signals in ranging markets.
- **Risk Management**: Always use proper risk/reward ratios and risk only a small portion of your capital.
- **Lag**: EMAs are lagging indicators, so signals may be delayed in fast-moving markets.
- **Customization Needs**: Default settings may not suit all markets; test and optimize as needed.
---
### 🌟 **Conclusion**
TrendGradient is a user-friendly, visually appealing indicator for trend tracking and automated level calculation. It generates signals via EMA crossovers, calculates dynamic TP/SL levels with ATR, and presents all information clearly through tables, lines, and labels. By using this tool with discipline, you can make more informed and successful trading decisions! 🚀
If you have further questions or need help customizing the indicator, feel free to ask! 💬 Good luck and happy trading! 🍀
