Enhanced Interval Candle with Breakout Detection and Detailed InThis indicator visualizes the last candle of a user-defined time interval (e.g., 1 hour, 4 hours, 1 day) on the current chart, providing enhanced details and breakout detection. It fetches the open, high, low, and close prices of the interval candle and draws a stylized representation of it, offset to the right of the current bar. The candle body and wicks are colored according to whether the interval candle closed bullishly (green) or bearishly (red). In addition to the candle itself, the indicator displays horizontal dotted lines representing the high, low, and midpoint of the interval candle, along with labels showing their exact values. These labels are dynamically updated as the interval candle changes. Furthermore, the script detects and visualizes breakouts of the interval candle's high or low. When the current price closes above the interval high, a green dashed line and a "Bullish Breakout" label are displayed. Conversely, when the current price closes below the interval low, a red dashed line and a "Bearish Breakout" label are shown. The breakout lines and labels are also dynamically updated. This indicator helps traders easily track the price action of a higher timeframe candle and spot potential breakouts based on that candle's range. The user can configure the time interval to suit their trading needs.
التحليل الأساسي

TradFi Fundamentals: Momentum Trading with Macroeconomic DataIntroduction
This indicator combines traditional price momentum with key macroeconomic data. By retrieving GDP, inflation, unemployment, and interest rates using security calls, the script automatically adapts to the latest economic data. The goal is to blend technical analysis with fundamental insights to generate a more robust momentum signal.
Original Research Paper by Mohit Apte, B. Tech Scholar, Department of Computer Science and Engineering, COEP Technological University, Pune, India
Link to paper
Explanation
Price Momentum Calculation:
The indicator computes price momentum as the percentage change in price over a configurable lookback period (default is 50 days). This raw momentum is then normalized using a rolling simple moving average and standard deviation over a defined period (default 200 days) to ensure comparability with the economic indicators.
Fetching and Normalizing Economic Data:
Instead of manually inputting economic values, the script uses TradingView’s security function to retrieve:
GDP from ticker "GDP"
Inflation (CPI) from ticker "USCCPI"
Unemployment rate from ticker "UNRATE"
Interest rates from ticker "USINTR"
Each series is normalized over a configurable normalization period (default 200 days) by subtracting its moving average and dividing by its standard deviation. This standardization converts each economic indicator into a z-score for direct integration into the momentum score.
Combined Momentum Score:
The normalized price momentum and economic indicators are each multiplied by user-defined weights (default: 50% price momentum, 20% GDP, and 10% each for inflation, unemployment, and interest rates). The weighted components are then summed to form a comprehensive momentum score. A horizontal zero line is plotted for reference.
Trading Signals:
Buy signals are generated when the combined momentum score crosses above zero, and sell signals occur when it crosses below zero. Visual markers are added to the chart to assist with trade timing, and alert conditions are provided for automated notifications.
Settings
Price Momentum Lookback: Defines the period (in days) used to compute the raw price momentum.
Normalization Period for Price Momentum: Sets the window over which the price momentum is normalized.
Normalization Period for Economic Data: Sets the window over which each macroeconomic series is normalized.
Weights: Adjust the influence of each component (price momentum, GDP, inflation, unemployment, and interest rate) on the overall momentum score.
Conclusion
This implementation leverages TradingView’s economic data feeds to integrate real-time macroeconomic data into a momentum trading strategy. By normalizing and weighting both technical and economic inputs, the indicator offers traders a more holistic view of market conditions. The enhanced momentum signal provides additional context to traditional momentum analysis, potentially leading to more informed trading decisions and improved risk management.
The next script I release will be an improved version of this that I have added my own flavor to, improving the signals.

Blockchain Fundamentals: Liquidity Cycle MomentumLiquidity Cycle Momentum Indicator
Overview:
This indicator analyzes global liquidity trends by calculating a unique Liquidity Index and measuring its year-over-year (YoY) percentage change. It then applies a momentum oscillator to the YoY change, providing insights into the cyclical momentum of liquidity. The indicator incorporates a limited historical data workaround to ensure accurate calculations even when the chart’s history is short.
Features Breakdown:
1. Limited Historical Data Workaround
Function: The limit(length) function adjusts the lookback period when there isn’t enough historical data (i.e., near the beginning of the chart), ensuring that calculations do not break due to insufficient data.
2. Global Liquidity Calculation
Data Sources:
TVC:CN10Y (10-year yield from China)
TVC:DXY (US Dollar Index)
ECONOMICS:USCBBS (US Central Bank Balance Sheet)
FRED:JPNASSETS (Japanese assets)
ECONOMICS:CNCBBS (Chinese Central Bank Balance Sheet)
FRED:ECBASSETSW (ECB assets)
Calculation Methodology:
A ratio is computed (cn10y / dxy) to adjust for currency influences.
The Liquidity Index is then derived by multiplying this ratio with the sum of the other liquidity components.
3. Year-over-Year (YoY) Percent Change
Computation:
The indicator determines the number of bars that approximately represent one year.
It then compares the current Liquidity Index to its value one year ago, calculating the YoY percentage change.
4. Momentum Oscillator on YoY Change
Oscillator Components:
1. Calculated using the Chande Momentum Oscillator (CMO) applied to the YoY percent change with a user-defined momentum length.
2. A weighted moving average (WMA) that smooths the momentum signal.
3. Overbought and Oversold zones
Signal Generation:
Buy Signal: Triggered when the momentum crosses upward from an oversold condition, suggesting a potential upward shift in liquidity momentum.
Sell Signal: Triggered when crosses below an overbought condition, indicating potential downward momentum.
State Management:
The indicator maintains a state variable to avoid repeated signals, ensuring that a new buy or sell signal is only generated when there’s a clear change in momentum.
5. Visual Presentation and Alerts
Plots:
The oscillator value and signalline are plotted for visual analysis.
Overbought and oversold levels are marked with dashed horizontal lines.
Signal Markers:
Buy and sell signals are marked with green and maroon circles, respectively.
Background Coloration:
Optionally, the chart’s background bars are colored (yellow for buy signals and fuchsia for sell signals) to enhance visual cues when signals are triggered.
Conclusion
In summary, the Liquidity Cycle Momentum Indicator provides a robust framework to analyze liquidity trends by combining global liquidity data, YoY changes, and momentum oscillation. This makes it an effective tool for traders and analysts looking to identify cyclical shifts in liquidity conditions and potential turning points in the market.

Forward Curve Visualization ToolProvide the spot symbol and the futures product root, and the script automatically scans all relevant contracts for you—no more tedious manual searches. The result is a clean, intuitive chart showing the live forward curve in real time.
It also detects contango or backwardation conditions (based on spot < F1 < F2 < F3).
Future Features:
Plot historical snapshots of the curve (1 day, 1 week, or 1 month ago) to understand market trends over time.
Display additional metrics such as annualized basis, cost of carry (CoC), and even volume or open interest for deeper insights.
If you trade futures and watch the forward curve, this script will give you the actionable data you need and get more ideas or features you’d like to see. Let’s build them together!
Disclaimer
Please remember that past performance may not be indicative of future results.
Due to various factors, including changing market conditions, the strategy may no longer perform as well as in historical backtesting.
This post and the script don’t provide any financial advice.

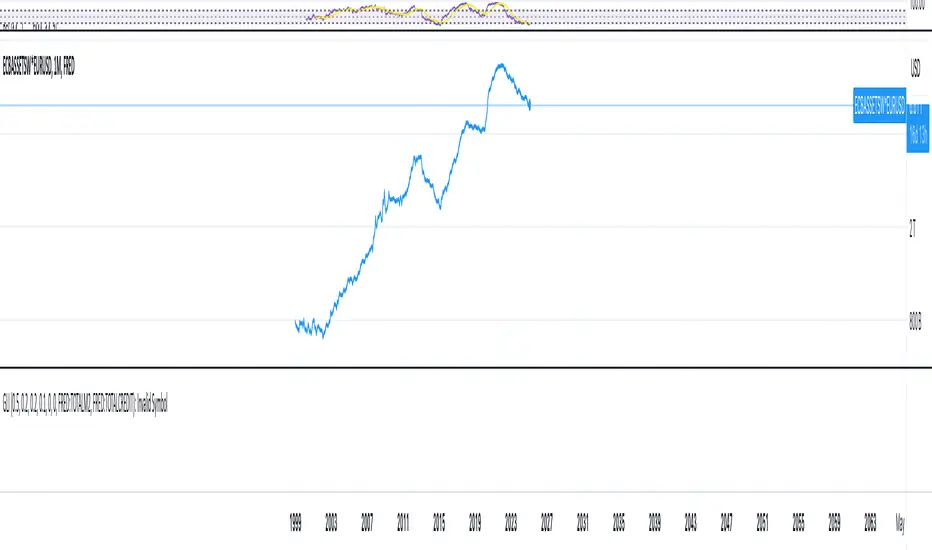
Blockchain Fundamentals: Liquidity & BTC YoYLiquidity & BTC YoY Indicator
Overview:
This indicator calculates the Year-over-Year (YoY) percentage change for two critical metrics: a custom Liquidity Index and Bitcoin's price. The Liquidity Index is derived from a blend of economic and forex data representing the M2 money supply, while the BTC price is obtained from a reliable market source. A dedicated limit(length) function is implemented to handle limited historical data, ensuring that the YoY calculations are available immediately—even when the chart's history is short.
Features Breakdown:
1. Limited Historical Data Workaround
- Functionality: limit(length) The function dynamically adjusts the lookback period when there isn’t enough historical data. This prevents delays in displaying YoY metrics at the beginning of the chart.
2. Liquidity Calculation
- Data Sources: Combines multiple data streams:
USM2, ECONOMICS:CNM2, USDCNY, ECONOMICS:JPM2, USDJPY, ECONOMICS:EUM2, USDEUR
- Formula:
Liquidity Index = USM2 + (CNM2 / USDCNY) + (JPM2 / USDJPY) + (EUM2 / USDEUR)
[b3. Bitcoin Price Calculation
- Data Source: Retrieves Bitcoin's price from BITSTAMP:BTCUSD on the user-selected timeframe for its historical length.
4. Year-over-Year (YoY) Percent Change Calculation
- Methodology:
- The indicator uses a custom function, to autodetect the proper number of bars, based on the selected timeframe.
- It then compares the current value to that from one year ago for both the Liquidity Index and BTC price, calculating the YoY percentage change.
5. Visual Presentation
- Plotting:
- The YoY percentage changes for Liquidity (plotted in blue) and BTC price (plotted in orange) are clearly displayed.
- A horizontal zero line is added for visual alignment, making it easier to compare the two copies of the metric. You add one copy and only display the BTC YoY. Then you add another copy and only display the M2 YoY.
-The zero lines are then used to align the scripts to each other by interposing them. You scale each chart the way you like, then move each copy individually to align both zero lines on top of each other.
This indicator is ideal for analysts and investors looking to monitor macroeconomic liquidity trends alongside Bitcoin's performance, providing immediate insights.

On-chain Zscore | QuantumResearchQuantumResearch On-chain Zscore Indicator
The On-chain Zscore Indicator by QuantumResearch is a cutting-edge tool designed for traders and analysts who leverage on-chain metrics to assess Bitcoin’s market conditions. This indicator calculates a composite Z-score using three key on-chain metrics: NUPL (Net Unrealized Profit/Loss), SOPR (Spent Output Profit Ratio), and MVRV (Market Value to Realized Value). By normalizing these values through standard deviations, the indicator provides a dynamic, data-driven approach to identifying overbought and oversold conditions, improving market timing and decision-making.
1. Overview
This indicator integrates multiple on-chain metrics to:
Assess Market Cycles – Utilize Z-score normalization to detect potential tops and bottoms.
Smooth Volatility – Apply EMA and standard deviation filtering to refine signals.
Identify Buy & Sell Signals – Use adaptive thresholds to highlight market extremes.
Provide Visual Clarity – Color-coded bar signals and background fills for intuitive analysis.
2. How It Works
A. Z-score Calculation
What is a Z-score? – The Z-score measures how far a data point deviates from its historical mean in terms of standard deviations. This helps in identifying statistical extremes.
Zscore(source,mean,std)=>
zscore = (source-mean)/std
zscore
Standard Deviation Normalization – Each on-chain metric (NUPL, SOPR, MVRV) is individually standardized before being combined into a final score.
B. On-Chain Components
NUPL Z-score – Measures unrealized profits and losses relative to market cycles.
SOPR Z-score – Evaluates profit-taking behavior on spent outputs.
MVRV Z-score – Assesses whether Bitcoin is overvalued or undervalued based on market cap vs. realized cap.
C. Composite On-chain Score
The indicator computes an average Z-score of the three on-chain metrics to create a composite market assessment.
Adaptive thresholds (default: 0.73 for bullish signals, -0.44 for bearish signals) dynamically adjust based on market conditions.
3. Visual Representation
This indicator features color-coded elements and dynamic threshold visualization:
Bar Colors
Green Bars – Bullish conditions when Z-score exceeds the upper threshold.
Red Bars – Bearish conditions when Z-score drops below the lower threshold.
Gray Bars – Neutral market conditions.
Threshold Bands & Background Fill
Upper Band (Overbought) – Default threshold set at 0.73.
Middle Band – Neutral zone at 0.
Lower Band (Oversold) – Default threshold set at -0.44.
4. Customization & Parameters
This indicator is highly configurable, allowing traders to fine-tune settings based on their strategy:
On-Chain Z-score Settings
NUPL Z-score Length – Default: 126 periods
SOPR Z-score Length – Default: 111 periods
MVRV Z-score Length – Default: 111 periods
Signal Thresholds
Upper Threshold (Bullish Zone) – Default: 0.73
Lower Threshold (Bearish Zone) – Default: -0.44
Color & Visual Settings
Choose from eight customizable color modes to suit personal preferences.
5. Trading Applications
The On-chain Zscore Indicator is versatile and can be applied in various market scenarios:
Macro Trend Analysis – Identify long-term market tops and bottoms using normalized on-chain metrics.
Momentum Confirmation – Validate price action trends with SOPR & MVRV behavior.
Market Timing – Use deviation thresholds to enter at historically significant price zones.
Risk Management – Avoid overextended markets by watching for extreme Z-score readings.
6. Final Thoughts
The QuantumResearch On-chain Zscore Indicator provides a unique approach to market evaluation by combining three critical on-chain metrics into a single, normalized score.
By standardizing Bitcoin’s market behavior, this tool helps traders and investors make informed decisions based on historical statistical extremes.
Backtesting and validation are essential before using this indicator in live trading. While it enhances market analysis, it should be used alongside other tools and strategies.
Disclaimer: No indicator can guarantee future performance. Always use appropriate risk management and perform due diligence before trading.

Global Liquidity IndexThis custom indicator provides a composite measure of global liquidity by combining key central bank balance sheet data with additional liquidity proxies. The script aggregates asset data from major economies—including the United States, Japan, China, and the Eurozone—converting non-USD values into U.S. dollars using real-time exchange rates. It then subtracts selected liability measures (such as reverse repurchase agreements and other adjustments) to approximate net central bank liquidity.
Key features include:
• Multi-Regional Coverage:
Incorporates data from the U.S. Federal Reserve, Bank of Japan, Chinese central bank proxies, and the European Central Bank, allowing you to gauge liquidity across major global markets.
• Dynamic Currency Conversion:
Uses live exchange rates (JPY/USD, CNY/USD, EUR/USD) to ensure that all regional figures are consistently expressed in U.S. dollars.
• Customizable Weighting:
Assign adjustable weights to each region’s data, so you can reflect economic size or your own view of their relative importance.
• Additional Liquidity Proxies:
Optionally integrates measures for global money supply and global credit/repo activity (or other proxies of your choice) with user-defined scaling factors.
• User-Friendly Configuration:
All key parameters—including weights and scaling factors—are available as inputs, making the indicator flexible and easy to tailor to your analysis needs.
This indicator is designed for traders and analysts seeking a broad view of global monetary conditions. Whether you’re tracking shifts in central bank policies or assessing global market liquidity, the Global Liquidity Index provides an insightful, customizable tool to help you visualize and interpret liquidity trends over time.
US vs EU Interest Rate SpreadThis script plots the difference (Spread) between the US-Interest Rate (Symbol USINTR) and the EU Interest Rate (Symbol: EUINTR) and plots it in a seperate pane. Areas where the background is green are times were the spread was positive (US interest rate higher than EU interest rate), a red background indicates a higher EU interest rate than US interest rate.

Blockchain Fundamentals: Global LiquidityGlobal Liquidity Indicator Overview
This indicator provides a comprehensive technical analysis of liquidity trends by deriving a Global Liquidity metric from multiple data sources. It applies a suite of technical indicators directly on this liquidity measure, rather than on price data. When this metric is expanding Bitcoin and crypto tends to bullish conditions.
Features:
1. Global Liquidity Calculation
Data Integration: Combines multiple market data sources using a ratio-based formula to produce a unique liquidity measure.
Custom Metric: This liquidity metric serves as the foundational input for further technical analysis.
2. Timeframe Customization
User-Selected Period: Users can select the data timeframe (default is 2 months) to ensure consistency and flexibility in analysis.
3. Additional Technical Indicators
RSI, Momentum, ROC, MACD, and Stochastic:
Each indicator is computed using the Global Liquidity series rather than price.
User-selectable toggles allow for enabling or disabling each individual indicator as desired.
4. Enhanced MACD Visualization
Dynamic Histogram Coloring:
The MACD histogram color adjusts dynamically: brighter hues indicate rising histogram values while darker hues indicate falling values.
When the histogram is above zero, green is used; when below zero, red is applied, offering immediate visual insight into momentum shifts.
Conclusion
This indicator is an enlightening tool for understanding liquidity dynamics, aiding in macroeconomic analysis and investment decision-making by highlighting shifts in liquidity conditions and market momentum.

Turtle Soup Model [PhenLabs]📊 Turtle Soup Model
Version: PineScript™ v6
Description
The Turtle Soup Model is an innovative technical analysis tool that combines market structure analysis with inter-market comparison and gap detection. Unlike traditional structure indicators, it validates market movements against a comparison symbol (default: ES1!) to identify high-probability trading opportunities. The indicator features a unique “soup pattern” detection system, comprehensive gap analysis, and real-time structure breaks visualization.
Innovation Points:
First indicator to combine structure analysis with gap detection and inter-market validation
Advanced memory management system for efficient long-term analysis
Sophisticated pattern recognition with multi-market confirmation
Real-time structure break detection with comparative validation
🔧 Core Components
Structure Analysis: Advanced pivot detection with inter-market validation
Gap Detection: Sophisticated gap identification and classification system
Inversion Patterns: “Soup pattern” recognition for reversal opportunities
Visual System: Dynamic rendering of structure levels and gaps
Alert Framework: Multi-condition notification system
🚨 Key Features 🚨
The indicator provides comprehensive analysis through:
Structure Levels: Validated support and resistance zones
Gap Patterns: Identification of significant market gaps
Inversion Signals: Detection of potential reversal points
Real-time Comparison: Continuous inter-market analysis
Visual Alerts: Dynamic structure break notifications
📈 Visualization
Structure Lines: Color-coded for highs and lows
Gap Boxes: Visual representation of gap zones
Inversion Patterns: Clear marking of potential reversal points
Comparison Overlay: Inter-market divergence visualization
Alert Indicators: Visual signals for structure breaks
💡Example
📌 Usage Guidelines
The indicator offers multiple customization options:
Structure Settings:
Pivot Period: Adjustable for different market conditions
Comparison Symbol: Customizable reference market
Visual Style: Configurable colors and line widths
Gap Analysis:
Signal Mode: Choice between close and wick-based signals
Box Rendering: Automatic gap zone visualization
Middle Line: Reference point for gap measurements
✅ Best Practices:
🚨Use comparison symbol from related market🚨
Monitor both structure breaks and gap inversions
Combine signals for higher probability trades
Pay attention to inter-market divergences
⚠️ Limitations
Requires comparison symbol data
Performance depends on market correlation
Best suited for liquid markets
What Makes This Unique
Inter-market Validation: Uses comparison symbol for signal confirmation
Gap Integration: Combines structure and gap analysis
Soup Pattern Detection: Identifies specific reversal patterns
Dynamic Structure Management: Automatically updates and removes invalid levels
Memory-Efficient Design: Optimized for long-term chart analysis
🔧 How It Works
The indicator processes market data through three main components:
1. Structure Analysis:
Detects pivot points with comparison validation
Tracks structure levels with array management
Identifies and processes structure breaks
2. Gap Analysis:
Identifies significant market gaps
Processes gap inversions
Manages gap zones visualization
3. Pattern Recognition:
Detects “soup” patterns
Validates with comparison market
Generates structure break signals
💡 Note: The indicator performs best when used with correlated comparison symbols and appropriate timeframe selection. Its unique inter-market validation system provides additional confirmation for traditional structure-based trading strategies.

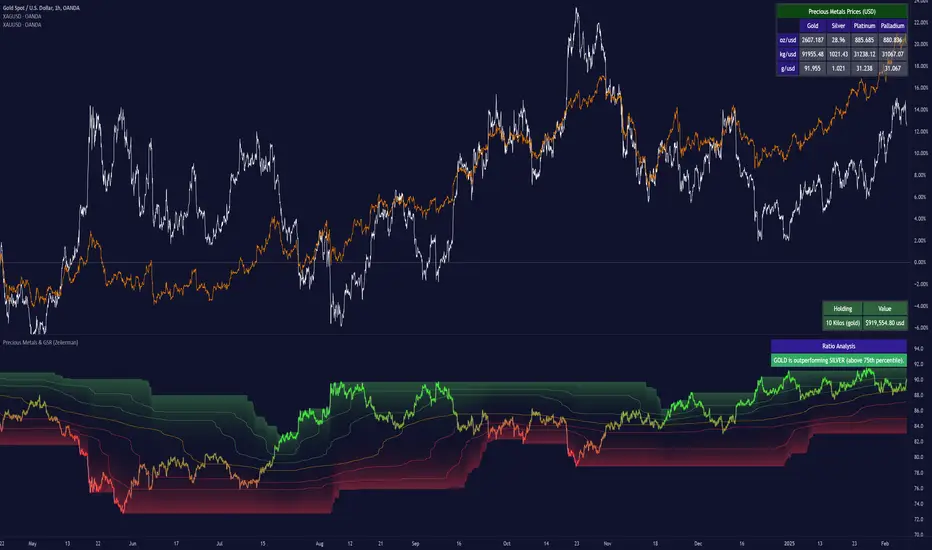
Precious Metals & GSR (Zeiierman)█ Overview
The Precious Metals & GSR (Zeiierman) is designed to provide traders and investors with a comprehensive view of the Gold-Silver Ratio (GSR) and other precious metal relationships. This tool helps evaluate the relative strength between different metals by analyzing their price ratios over historical periods, using quantile-based analysis and trend interpretation tables to highlight key insights.
The Gold-Silver Ratio (GSR) is a widely utilized metric in precious metals trading, representing the number of silver ounces required to purchase one ounce of gold. Historically, this ratio has fluctuated, providing traders with insights into the relative value of these two metals. By analyzing the GSR, traders can identify potential trading opportunities based on historical patterns and market dynamics.
By integrating customizable percentile bands, gradient coloring for performance visualization, and dynamic ratio analysis, this indicator assists in understanding how one metal is performing relative to another, making it useful for trend tracking, risk management, and portfolio allocation.
█ How It Works
The Precious Metals & GSR Indicator operates by fetching the latest prices of the selected precious metals in the user's chosen currency. It then calculates the ratio between two selected metals (Metal 1 and Metal 2) and analyzes this ratio over a specified period. By computing quantile bands and high/low bands, the indicator provides insights into the historical performance and current standing of the ratio.
⚪ Ratio Calculation
The core of this indicator is the metal ratio, calculated by dividing the price of Metal 1 by Metal 2.
A rising ratio means Metal 1 is outperforming Metal 2.
A falling ratio means Metal 2 is outperforming Metal 1.
The indicator automatically retrieves live market prices of Gold, Silver, Platinum, and Palladium to compute the ratio.
⚪ Quantile Ratio Bands
The indicator calculates the highest (max) and lowest (min) ratio levels over a user-defined period.
It also plots quantile bands at the 10th, 25th, 50th (median), 75th, and 90th percentiles, providing deeper statistical insights into how extreme or average the current ratio is.
The median (Q50) acts as a reference level, showing whether the ratio is above or below its historical midpoint.
⚪ Interpretation Table
The Ratio Interpretation Table provides a text-based summary of the ratio’s strength.
It detects whether Metal 1 is at a historical high, low, or within common ranges.
This helps traders and investors make informed decisions on whether the ratio is overextended, mean-reverting, or trending.
⚪ Precious Metals Table
Displays live market prices for Gold, Silver, Platinum, and Palladium.
Prices are shown in different units (oz, kg, grams, and troy ounces) based on user preferences.
A color-coded system highlights price changes, making it easier to track market movements.
⚪ Physical Holding Calculator
Users can enter their precious metal holdings to estimate their current value.
The system adjusts calculations based on weight, purity (24K, 22K, etc.), and unit of measurement.
The holding value is displayed in the selected currency (USD, EUR, GBP, etc.).
█ How to Use
⚪ Trend Identification
If the ratio is increasing, Metal 1 is gaining strength relative to Metal 2 → Possible Long Position on Metal 1 / Short on Metal 2
If the ratio is decreasing, Metal 2 is gaining strength relative to Metal 1 → Possible Short Position on Metal 1 / Long on Metal 2
⚪ Mean Reversion Strategy
When the ratio reaches the 90th percentile, Metal 1 is historically overextended (expensive) compared to Metal 2.
Traders may look to sell Metal 1 and buy Metal 2, expecting the ratio to decline back toward its historical average.
Example (Gold/Silver Ratio): If the GSR is above the 90th percentile, gold is very expensive relative to silver, suggesting a potential buying opportunity in silver and/or a selling opportunity in gold.
When the ratio reaches the 10th percentile, Metal 1 is historically undervalued (cheap) compared to Metal 2.
Traders may look to buy Metal 1 and sell Metal 2, expecting the ratio to rise back toward its historical average.
Example (Gold/Silver Ratio): If the GSR is below the 10th percentile, gold is very cheap relative to silver, suggesting a potential buying opportunity in gold and/or a selling opportunity in silver.
⚪ Common Strategy Based on GSR Insights
A common approach involves monitoring the ratio for extreme values based on historical data. When the ratio reaches historically high levels, it suggests that gold is expensive relative to silver, potentially indicating a buying opportunity for silver and/or a selling opportunity for gold. Conversely, when the ratio is at historically low levels, silver is expensive relative to gold, suggesting a potential buying opportunity for gold and/or selling opportunity for silver. This mean-reversion strategy relies on the tendency of the GSR to return to its historical average over time.
⚪ Hedging & Portfolio Diversification
If Gold is strongly outperforming Silver, investors may shift allocations to balance risk.
If Silver is rapidly gaining on Gold, it may indicate increased industrial demand or speculative interest.
⚪ Inflation & Economic Cycles
A rising Gold-Silver ratio often correlates with economic downturns and increased risk aversion.
A falling Gold-Silver ratio may signal stronger economic growth and higher inflation expectations.
█ Settings
Precious Metals Table
Select which metals to display (Gold, Silver, Platinum, Palladium)
Choose measurement units (oz, kg, grams, troy ounces)
Ratio Analysis
Select Metal 1 & Metal 2 for ratio calculation
Set historical length for quantile calculations
Interpretation Table
Enable automated insights based on ratio levels
Physical Holdings Calculator
Enter metal weight, purity, and unit
Select calculation currency
-----------------
Disclaimer
The content provided in my scripts, indicators, ideas, algorithms, and systems is for educational and informational purposes only. It does not constitute financial advice, investment recommendations, or a solicitation to buy or sell any financial instruments. I will not accept liability for any loss or damage, including without limitation any loss of profit, which may arise directly or indirectly from the use of or reliance on such information.
All investments involve risk, and the past performance of a security, industry, sector, market, financial product, trading strategy, backtest, or individual's trading does not guarantee future results or returns. Investors are fully responsible for any investment decisions they make. Such decisions should be based solely on an evaluation of their financial circumstances, investment objectives, risk tolerance, and liquidity needs.
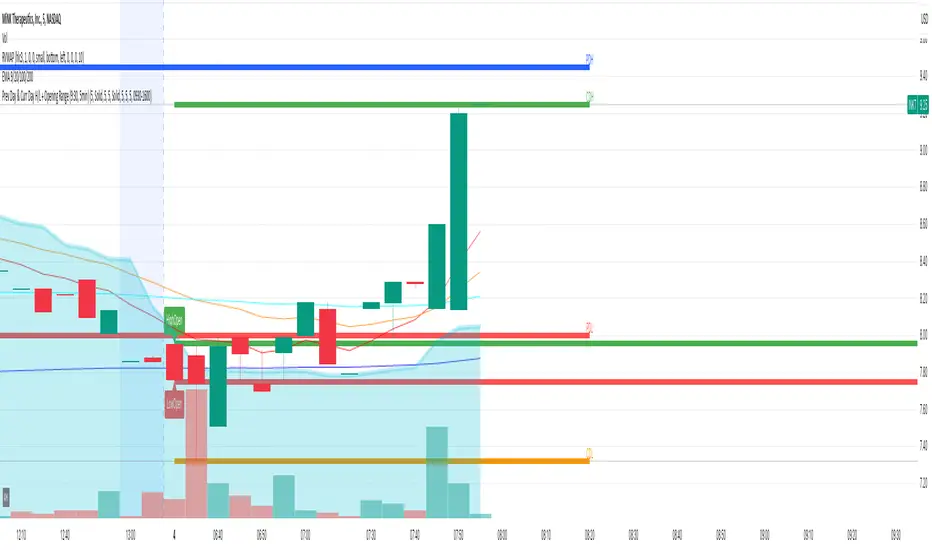
Prev Day & Curr Day H/L + Opening Range (9:30, 5min)Script Description:
This TradingView Pine Script is designed for use on a 5‑minute chart and plots key price levels for daily trading analysis. It automatically draws:
• Previous Day High/Low Lines:
These lines mark the previous day’s regular trading hours (RTH) high and low levels, with labels (“PDH” and “PDL”) for easy identification.
• Current Day High/Low Lines:
As the trading day progresses, the script updates and displays the current day’s RTH high and low levels, labeled as “CDH” and “CDL”.
• Opening Range for 9:30 AM:
The script specifically identifies the first 5‑minute candle at 9:30 AM (using the “America/New_York” time zone) and draws two additional lines at its high and low. These lines are labeled “HighOpen” and “LowOpen” to indicate the opening range.
All lines are drawn with a width of 5 and have configurable colors, styles, and extension lengths. The script automatically resets at the start of each new day, ensuring that the plotted levels are current and relevant for daily trading decisions.
Draw on Liquidity [PhenLabs]📊 Draw on Liquidity (DOL) Indicator
Version: PineScript™ v6
Description
The Draw on Liquidity (DOL) indicator is an advanced technical analysis tool designed to identify and visualize significant liquidity zones in the market. It combines volume analysis, pivot point detection, and real-time proximity alerts to help traders identify potential support and resistance levels where significant trading activity occurs. The indicator features dual display modes, adaptive volume thresholds, and a comprehensive real-time dashboard.
🔧 Components
• Liquidity Detection: Advanced pivot point analysis with volume validation
• Volume Analysis: Adaptive volume threshold system
• Display Modes: Historical and Current visualization options
• Proximity Detection: Real-time price-to-level distance monitoring
• Visual Dashboard: Dynamic status display with alert system
🚨 Important Dashboard Features 🚨
The dashboard provides real-time information about:
• High Draw Zones: Resistance levels with significant liquidity
• Low Draw Zones: Support levels with high trading activity
• Current Price: Real-time price monitoring
• Active Alerts: Proximity warnings when price approaches liquidity zones
📈 Visualization
• Historical Mode: Displays all past and present liquidity zones
• Current Mode: Shows only active, unhit liquidity levels
• Color-coded lines: Blue for high liquidity, Red for low liquidity
• Dynamic line extension: Updates with price movement
• Alert indicators: Visual signals when price approaches zones
Historical Visualization
Current Visualization
📌 Usage Guidelines
The indicator is highly customizable with several key parameters:
Pivot Settings:
• Shorter lengths (3-7): More frequent zones, suitable for scalping
• Longer lengths (7-15): Major zones, better for swing trading
Volume Analysis:
• Lower multiplier (1.5-2.0): More zones, higher sensitivity
• Higher multiplier (2.0-3.0): Major zones only, reduced noise
✅ Best Practices:
• Start with default settings and adjust based on timeframe
• Use Historical mode for analysis, Current mode for active trading
• Monitor dashboard alerts for potential trade setups
• Combine with trend analysis for better entry/exit points
⚠️ Limitations
• Requires sufficient volume data for accurate analysis
• Performance varies with market volatility
• Historical mode may become visually cluttered on longer timeframes
• Best performance during regular market hours
What Makes This Unique
• Dual Display System: Choose between historical analysis and current trading modes
• Volume-Validated Zones: Only marks levels with significant trading activity
• Real-time Proximity Alerts: Dynamic warnings when approaching liquidity zones
• Adaptive Threshold System: Automatically adjusts to market conditions
• Comprehensive Dashboard: All-in-one view of current market status
🔧 How It Works
The indicator processes market data through three main components:
1. Liquidity Detection (40% weight):
• Identifies pivot points using customizable lookback periods
• Validates levels with volume analysis
• Marks significant zones based on combined criteria
2. Volume Analysis (40% weight):
• Calculates dynamic volume thresholds
• Compares current volume to moving average
• Filters out low-volume noise
3. Proximity Analysis (20% weight):
• Monitors price distance to active zones
• Triggers alerts based on customizable thresholds
• Updates dashboard status in real-time
💡 Note: For optimal results, combine with price action analysis and consider using multiple timeframes for confirmation. The indicator performs best in markets with consistent volume and clear trend structure.

Market Cap & Volume Tracker with TrendsMarket Cap & Volume Tracker with Trends
This indicator provides a compact, at-a-glance view of key market data directly on your chart, specifically focusing on Market Cap, Volume, and Volume Trends over various time intervals. It helps traders and investors monitor price action and volume shifts in real-time.
Key Features:
Market Cap: Displays the market capitalization of the selected asset, calculated as the Close Price multiplied by Volume, and formatted in Millions (M).
Volume Data: Shows the volume for:
Pre-market (the volume before the main market session starts)
Current Volume (real-time volume during the current session)
After-hours Volume (volume traded after the market closes)
All volumes are formatted in Thousands (K) for easy readability.
Volume Trends: Monitors volume movement across multiple time intervals:
15-Minutes
30-Minutes
45-Minutes
1 Hour
The indicator tracks whether the volume is Increasing or Decreasing in each of these time frames to help identify trends and potential market shifts.
Customization:
Easily adjustable colors for the table background, text, and header for clear visibility and user preferences.
Option to choose the display position of the table (top or bottom right corner).
Use Case:
This indicator is ideal for traders who want quick insights into the market's activity without the need to look at multiple charts or external data points. It helps spot volume changes and trends over various time frames and supports decision-making for entries, exits, and overall market sentiment.

QoQ Economic & Financial Indicator ChangesA straightforward indicator for analyzing quarter-over-quarter (QoQ) percentage changes in economic and financial data series. Perfect for visualizing dynamic changes in:
Economic Indicators (GDP, House Price Indices, Employment Figures)
Company Financial Metrics (Revenue, EPS, Operating Margins)
Balance Sheet Items (Assets, Liabilities, Equity)
Cash Flow Statement Components
Other Quarterly Economic & Financial Data
Features:
Automatically calculates QoQ percentage changes
Color-coded visualization (green for positive, red for negative changes)
Displays exact percentage values
Includes adjustable scale factor for different data series
Zero line reference for easy trend identification

Earnings Expansion ProjectionThis indicator has no counterpart in the platform and is a professional-grade earnings visualization tool that plots EPS expansion directly on your charts, inspired by institutional-level technical analysis platforms.
The indicator creates a distinctive earnings expansion projection curve that can be a leading indicator of price direction moves.
Key features:
Clean, institutional-style, EPS-expansion projection line overlaid on price action
Visual earnings surprise indicators with beat/miss multipliers
Dashboard for rapid fundamental assessment including the stocks win rate on beatings / missing earnings historically and other fundamental information not readily available on Tradingview
What is it doing?
It collects all earnings results available and will interpolate the numbers so that we see earnings expansion as a curve.
The video below describes usage
Note: Valid on the weekly time-frame only.

Global M2 Index Percentage### **Global M2 Index Percentage**
**Description:**
The **Global M2 Index Percentage** is a custom indicator designed to track and visualize the global money supply (M2) in a normalized percentage format. It aggregates M2 data from major economies (e.g., the US, EU, China, Japan, and the UK) and adjusts for exchange rates to provide a comprehensive view of global liquidity. This indicator helps traders and investors understand the broader macroeconomic environment, identify trends in money supply, and make informed decisions based on global liquidity conditions.
---
### **How It Works:**
1. **Data Aggregation**:
- The indicator collects M2 data from key economies and adjusts it using exchange rates to calculate a global M2 value.
- The formula for global M2 is:
\
2. **Normalization**:
- The global M2 value is normalized into a percentage (0% to 100%) based on its range over a user-defined period (default: 13 weeks).
- The formula for normalization is:
\
3. **Visualization**:
- The indicator plots the M2 Index as a line chart.
- Key reference levels are highlighted:
- **10% (Red Line)**: Oversold level (low liquidity).
- **50% (Black Line)**: Neutral level.
- **80% (Green Line)**: Overbought level (high liquidity).
---
### **How to Use the Indicator:**
#### **1. Understanding the M2 Index:**
- **Below 10%**: Indicates extremely low liquidity, which may signal economic contraction or tight monetary policy.
- **Above 80%**: Indicates high liquidity, which may signal loose monetary policy or potential inflationary pressures.
- **Between 10% and 80%**: Represents a neutral to moderate liquidity environment.
#### **2. Trading Strategies:**
- **Long-Term Investing**:
- Use the M2 Index to assess global liquidity trends.
- **High M2 Index (e.g., >80%)**: Consider investing in risk assets (stocks, commodities) as liquidity supports growth.
- **Low M2 Index (e.g., <10%)**: Shift to defensive assets (bonds, gold) as liquidity tightens.
- **Short-Term Trading**:
- Combine the M2 Index with technical indicators (e.g., RSI, MACD) for timing entries and exits.
- **M2 Index Rising + RSI Oversold**: Potential buying opportunity.
- **M2 Index Falling + RSI Overbought**: Potential selling opportunity.
#### **3. Macroeconomic Analysis**:
- Use the M2 Index to monitor the impact of central bank policies (e.g., quantitative easing, rate hikes).
- Correlate the M2 Index with inflation data (CPI, PPI) to anticipate inflationary or deflationary trends.
---
### **Key Features:**
- **Customizable Timeframe**: Adjust the lookback period (e.g., 13 weeks, 26 weeks) to suit your trading style.
- **Multi-Economy Data**: Aggregates M2 data from the US, EU, China, Japan, and the UK for a global perspective.
- **Normalized Output**: Converts raw M2 data into an easy-to-interpret percentage format.
- **Reference Levels**: Includes key levels (10%, 50%, 80%) for quick analysis.
---
### **Example Use Case:**
- **Scenario**: The M2 Index rises from 49% to 62% over two weeks.
- **Interpretation**: Global liquidity is increasing, potentially due to central bank stimulus.
- **Action**:
- **Long-Term**: Increase exposure to equities and commodities.
- **Short-Term**: Look for buying opportunities in oversold assets (e.g., RSI < 30).
---
### **Why Use the Global M2 Index Percentage?**
- **Macro Insights**: Understand the broader economic environment and its impact on financial markets.
- **Risk Management**: Identify periods of high or low liquidity to adjust your portfolio accordingly.
- **Enhanced Timing**: Combine with technical analysis for better entry and exit points.
---
### **Conclusion:**
The **Global M2 Index Percentage** is a powerful tool for traders and investors seeking to incorporate macroeconomic data into their strategies. By tracking global liquidity trends, this indicator helps you make informed decisions, whether you're trading short-term or planning long-term investments. Add it to your TradingView charts today and gain a deeper understanding of the global money supply!
---
**Disclaimer**: This indicator is for informational purposes only and should not be considered financial advice. Always conduct your own research and consult with a professional before making investment decisions.

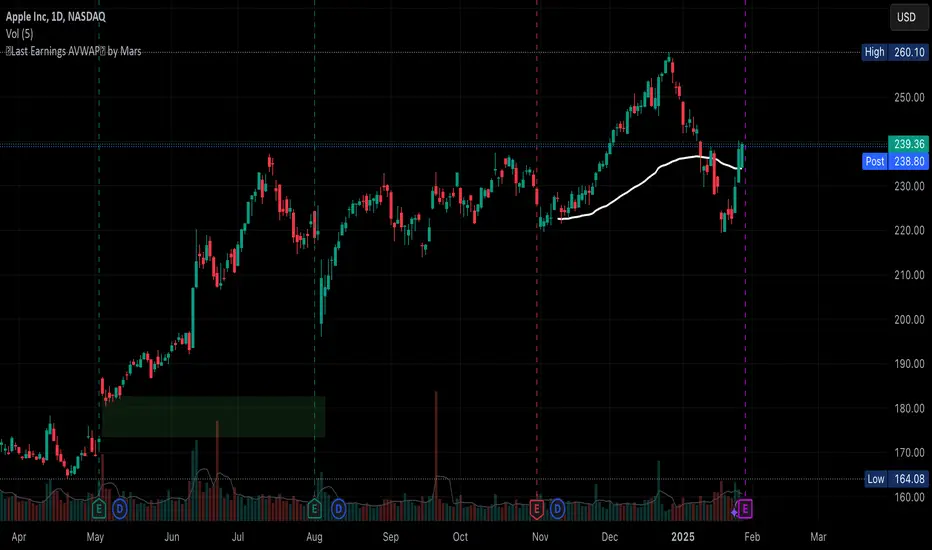
Auto Last Earnings AVWAP
This script provides an automated approach to tracking critical post-earnings price levels. You can add it to a chart and then flip through your watchlist to see the anchored AVWAPs without the need to do it manually one by one.
Core Features:
Automatically detects earnings dates and anchors VWAP calculations without manual input
Calculates volume-weighted average price specifically from the last earnings release
Identifies and visualizes significant earnings gaps between reporting periods
Volume-Based Signal Detection:
Monitors VWAP crosses with volume confirmation (requires 1.5x normal volume)
Labels high-volume breakouts with clear directional signals
Uses a 6-bar adaptive volume baseline to filter out noise
Practical Applications:
AVWAP anchored at earnings offers a great price support level that should be considered when deciding to buy/sell the stock. This script eliminates manual VWAP anchoring and reduces chart management time
Key Differentiators:
First note: coding VWAP anchoring in pine is more challenging that one would think. The source code is open to help other users and hopefully inspire different applications.
No need to manually anchor the VWAP
Draws earnings gap from earnings to earnings (if auto mode)
Detects breakouts through the AVWAP line
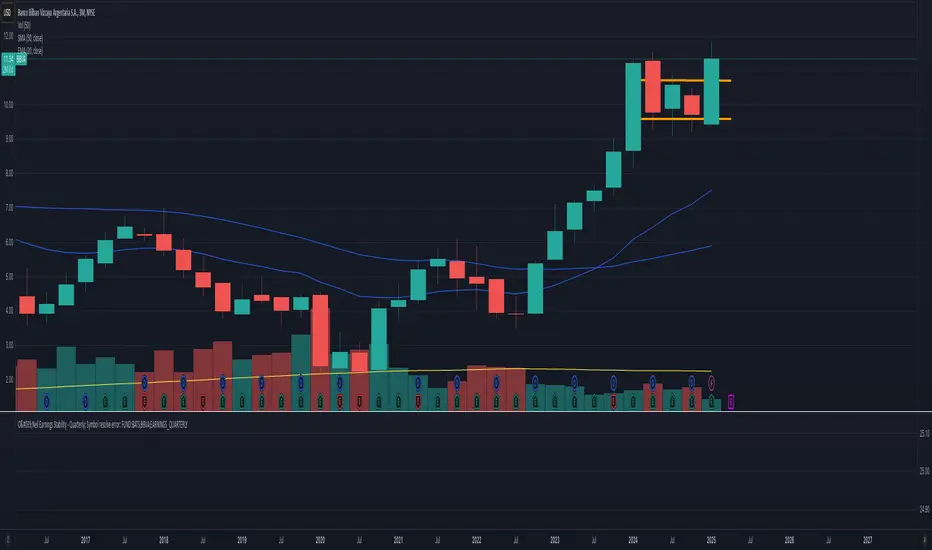
O'Neil Earnings StabilityO'Neil Earnings Stability Indicator
This indicator implements William O'Neil's earnings stability analysis, a key factor in identifying high-quality growth stocks. It measures both earnings stability (1-99 scale) and growth rate.
Scale Interpretation:
• 1-25: Highly stable earnings (ideal)
• 26-30: Moderately stable
• >30: More cyclical/less dependable
The stability score is calculated by measuring deviations from the earnings trend line, with lower scores indicating more consistent growth. Combined with the annual growth rate (target ≥25%), this helps identify stocks with both steady and strong earnings growth.
Optimal Criteria:
✓ Stability Score < 25
✓ Annual Growth > 25%
This tool helps filter out stocks with erratic earnings patterns and identify those with proven, sustainable growth records. Green label indicates both criteria are met; red indicates one or both criteria failed."
Would you like me to modify any part of this description or add more details about specific aspects of the calculation?
The key concepts in these calculations:
Stability Score (1-99 scale):
Lower score = more stable
Takes average deviation from mean earnings
Uses logarithmic scaling to emphasize smaller deviations
Multiplies by 20 to get into 1-99 range
Score ≤ 25 meets O'Neil's criteria
Growth Rate:
Year-over-year comparison (current quarter vs same quarter last year)
Calculated as percentage change
Growth ≥ 25% meets O'Neil's criteria
O'Neil's Combined Criteria:
Stability Score should be ≤ 25 (indicating stable earnings)
Growth Rate should be ≥ 25% (indicating strong growth)
Both must be met for ideal conditions
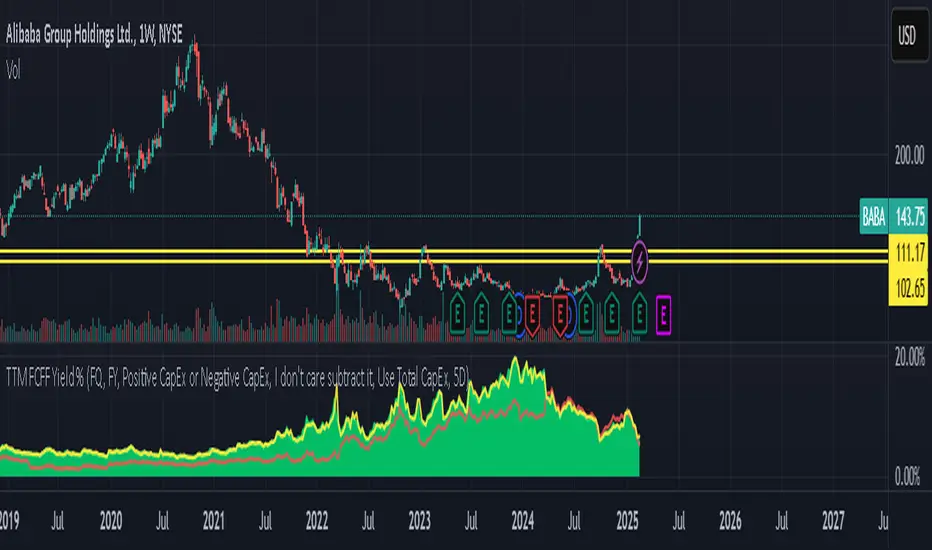
TTM FCFF Yield %An indicator that shows the Free Cash Flow yield daily for the underlying ticker. Useful for when you need to screen for ideas, or the news just broke out and you want to make a calculated purchase - rather than buying at whatever price it is at the moment.
Green line tracks daily Free Cash Flow yield to Enterprise Value.
Where Free Cash Flow is defined as = Cashflow from Operations + Depreciation and Amortization (from the income statement) - Capital Expenditure (fixed assets) - Change in Working Capital
And where Enterprise Value is defined as = Market Capitalization + Net Debt
Red line tracks Free Cash Flow of financial year and what FCFF yield does that equate to if the stock current trades at the price right now.
Reminder: When working with international equities. Be mindful of whether they report FQ or FH. For example, France only reports FH, so it's better to use TTM FHFree Cash Flow results. If you didn't toggle FH in the indicator settings, it will automatically set as FQ and it will not show anything.
GLHF
Thin Liquidity Zones [PhenLabs]Thin Liquidity Zones with Volume Delta
Our advanced volume analysis tool identifies and visualizes significant liquidity zones using real-time volume delta analysis. This indicator helps traders pinpoint and monitor critical price levels where substantial trading activity occurs, providing precise volume flow measurement through lower timeframe analysis.
The tool works by leveraging the fact that hedge funds, institutions, and other large market participants strategically fill their orders in areas of thin liquidity to minimize slippage and market impact. By detecting these zones, traders gain valuable insights into potential areas of accumulation, distribution, and liquidity traps, allowing for more informed trading decisions.
🔍 Key Features
Real-time volume delta calculation using lower timeframe data
Dynamic zone creation based on volume spikes
Automatic timeframe optimization
Size-filtered zones to avoid noise
Custom delta timeframe scanning
Flexible analysis period selection
📊 Visual Demonstration
💡 How It Works
The indicator continuously scans for high-volume areas where trading activity exceeds the specified threshold (default 6.0x average volume). When detected, it creates zones that display the net volume delta, showing whether buying or selling pressure dominated that price level.
Key zone characteristics:
Size filtering prevents noise from large price swings
Volume delta shows actual buying/selling pressure
Zones automatically expire based on lookback period
Real-time updates as new volume data arrives
⚙️ Settings
Time Settings
Analysis Timeframe: 15M to 1W options
Custom Period: User-defined bar count
Delta Timeframe: Automatic or manual selection
Volume Analysis
Volume Threshold: Minimum spike multiple
Volume MA Length: Averaging period
Maximum Zone Size: Size filter percentage
Display Options
Zone Color: Customizable with transparency
Delta Display: On/Off toggle
Text Position: Left/Center/Right alignment
📌 Tips for Best Results
Adjust volume threshold based on instrument volatility
Monitor zone clusters for potential support/resistance
Consider reducing max zone size in volatile markets
Use in conjunction with price action and other indicators
⚠️ Important Notes
Requires volume data from your data provider
Lower timeframe scanning may impact performance
Maximum 500 zones maintained for optimization
Zone creation is filtered by both volume and size
🔧 Volume Delta Calculation
The indicator uses TradingView’s advanced volume delta calculation, which:
Scans lower timeframe data for precision
Measures actual buying vs selling pressure
Updates in real-time with new data
Provides clear positive/negative flow indication
This tool is ideal for traders focusing on volume analysis and order flow. It helps identify key levels where significant trading activity has occurred and provides insight into the nature of that activity through volume delta analysis.
Note: Performance may vary based on your chart’s timeframe. Adjust settings according to your trading style and the instrument’s characteristics. Past performance is not indicative of future results, DYOR.

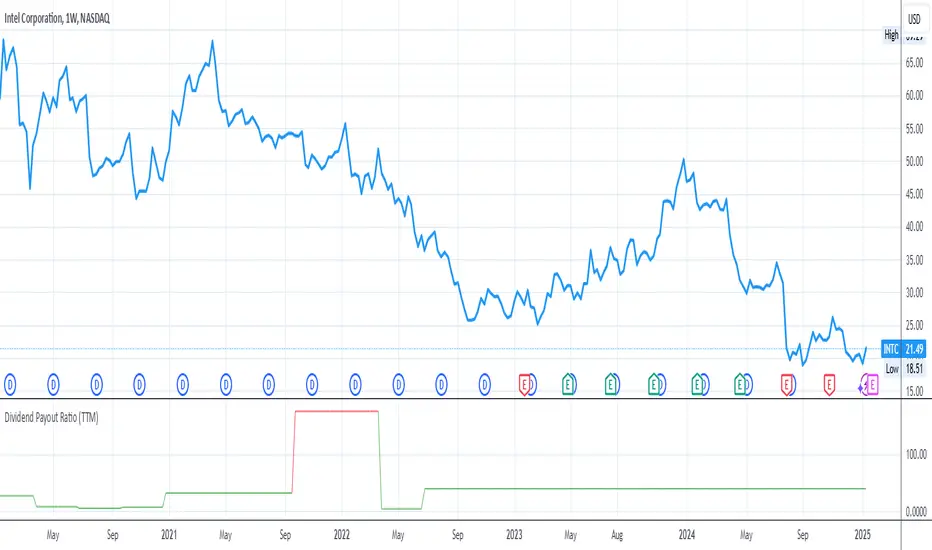
Dividend Payout RatioShows the dividend payout ratio for the specific stock.
The dividend payout ratio indicates if the dividend payout is sustainable in the long run. Therefore,
1. A dividend payout under 50% is considered sustainable. The line will be green
2. A dividend payout over 50% and under 100%, the line will be yellow, is considered a stock to investigate since the dividend payout may have to be cut in the future which will cause the stock price to crash.
3. A dividend payout over 100%, the line will be red, is considered unsustainable and the dividend payout will most likely be cut in the near future. It can take up to a few years for the dividend cut to happen if the financials do not improve.
If the dividend payout ratio is over 100%, this means that the company is paying a dividend amount over $1 for every $1 earned. Therefore, the company must borrow money or find another source to pay the dividend amount that the company cannot afford to pay with the current earnings.
Calculating the dividend payout ratio:
Divide dividend paid by earnings after tax and multiplying the result by 100%.
Accumulated Funding RateAccumulated Funding Rate
for future contract -ve/+ve funding fees that indicate long and short opening so that price differance between Spot and Future is balance buy exchange funding between long and short holder
-ve rate means Short is high so short holder has to pay fees to Long to correction in Price and vise versa
so over the periode of time accumulated rate its indicates the Bubble which can be explode any time to Liquidation of inbalance Long/Short Ratio some time its take longer period but its indicated bubbles direction
maximum -ve rates indicate Short opened from long period of time so when its liquidate/exit
then price will be correct to its original price that was struck due Short holder over the time and then now market will liquidate/exit those unstable Short like 50X/25X leverage and correct the price
