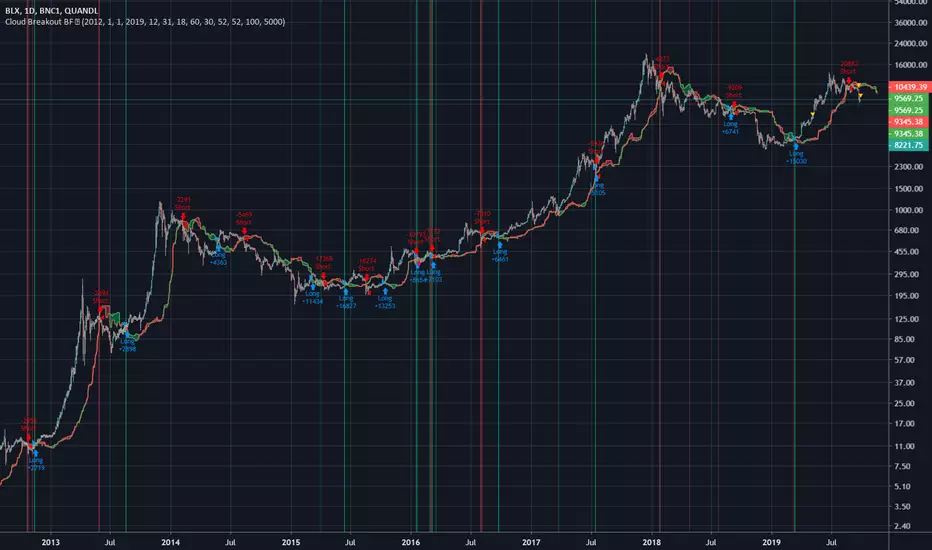
Cloud Breakout BFBased on code by nathanhoffer Long signal is after a close above Kumo cloud, short signal after close below it. You can adjust stuff in the settings.استراتيجية Pine Script®من bennefتم تحديثه 159
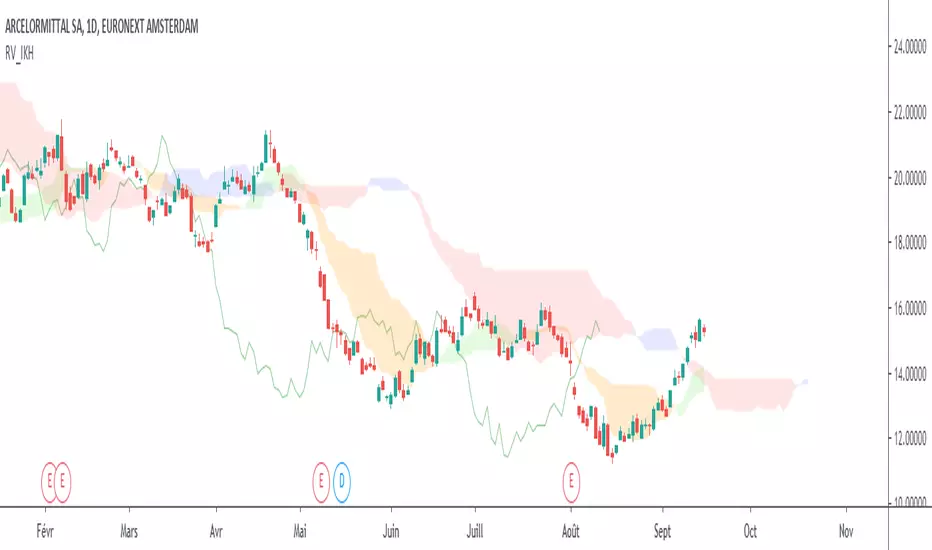
Ichimoku_RVAffichage de l'Ichimoku Kinko Hyo. Le paramétrage permet : - D'avoir le bon paramétrage de l'Ichimoku (décalage de 26 périodes, bougie actuelle INCLUSE) - De coloriser ou non le Kinkohyo - D'afficher ou non les lignes passives (projection passive du Kinkohyo et du Kumo) - D'annuler ou non le décalage (du Kumo) - D'afficher ou non les canaux (bornes hautes et basses de Tenkan, Kijun et de la SSB) - De prendre ou non la bougie en cours (dans le calcul des lignes de l'Ichimoku) - D'afficher un mini canal 3 périodes (permet d'intégrer les vagues de l'UT inférieure directement sur l'UT de travail) مؤشر Pine Script®من Herveo1126
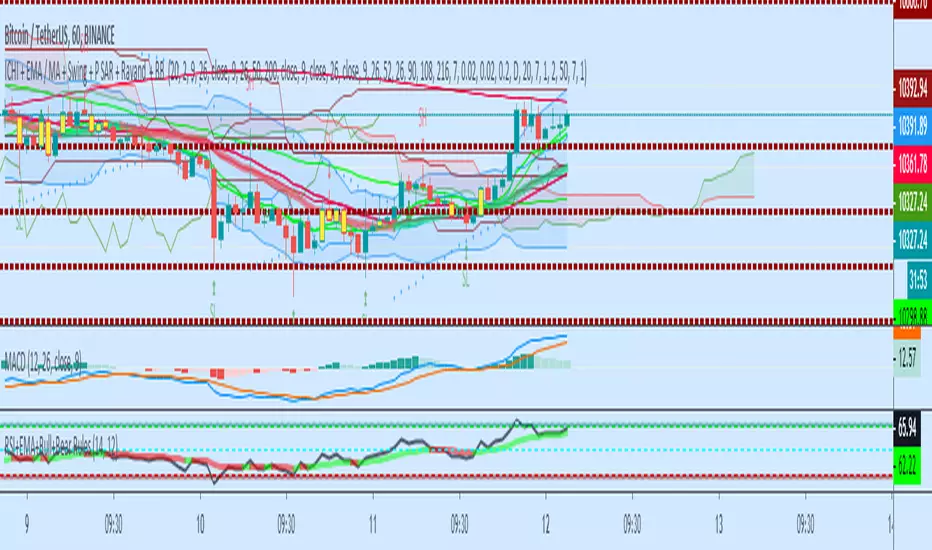
ICHI + EMA / MA + Swing + P SAR + BB A combination of Swing, Ichimuko and 3 different kijunsen, EMA, MA, MA and EMA, ( cross ), Parabolic Sar, BB, and the middle line of Bolinger Band Indicators open source to the further adjustmentمؤشر Pine Script®من Djawe3131 1.3 K
Dual Ichimoku CloudDual Ichimoku cloud Now you don't need to switch between time frames to see cloud support/resistance! Configure cloud as you wish then set ratio. Example Rations 3 Minutes to 15 Minutes = 5 15 Minutes to 1 Hour = 4 1 Day to 1 Week = 5 مؤشر Pine Script®من GainMachine83
Seb's Multi timeframe indicatorsHello, This is simple combined indicator i use to have 2 same indicators on 2 timeframes BB 1 (default for current timeframe) BB 2 (default current timeframe x4) 4xEMA (default 9, 50, 100, 200) Ichimoku 1 (default for current timeframe) Ichimoku 2 (default current timeframe x4) Gaussian Channel (base on the one of Donovan Wall) Maybe more to come.مؤشر Pine Script®من utha7
Lancelot Band - ATR Reversal+Trending IndicatorThis is an indicator I created recently, with the mind of spotting where price might reverse and where the price is trending. You can see this as the primary indicator for your system, however, it is recommended you use this in conjunction with other confirmation indicators. This script focus solely on ATR or Average True Range. This indicator is the combination of the baseline from the Ichimoku cloud and the concept of the Keltner channel. Baseline period = 14 ATR period = 14 ATR Mult = 1.5 For reversal Long when price crossover Lower band & Stop loss at xLower band Sell when price crossunder Upper band & Stop loss at xUpper band For Trend Following Long when price crossover xUpper band and Stop loss at Upper band Short when price crossunder xLower band and Stop loss at Upper band Again, you will need other indicators to help you to succeed in this system. This indicator will not generate the best exit for your position but will generate a good entry signal when you use it with both volume indicator and exit indicator. Works well on BTCUSD XBTUSD, as well as other major liquid Pair. Feel free to follow me on Twitter @Lancelot_Auger for more free Alpha. Please acknowledge my effort by like and follow. And lastly, Save Hong Kong, the revolution of our times.مؤشر Pine Script®من Lancelot_Augurتم تحديثه 359
Odin's Kraken (TK Cross Strategy)A simple, yet profitable, trend following system based on 1 hour TK Crosses and ADX. Works best on ETH/BTC, but is also profitable on other large-cap altcoin BTC pairs (ADA/BTC, EOS/BTC, and TRX/BTC ). I'm still just getting started in the algo trading world, but if you have any questions I am more than happy to answer them in the comment section here or on Twitter (@pascaltmn). Cheers.استراتيجية Pine Script®من odinofcrypto139
CloudRest ATR based cloudThis is an indicator I have been working on for the past 2 years, developed specifically for cryptocurrency. It is primarily a trend following indicator with great success and it performs the best in 4hrs to the weekly chart. There are two components of this indicator. The baseline from Ichimoku cloud and volatility stop . baseline period = 26 volatility stop = 1.5ATR, 3 You can view this as the main component of a trend following system but you will need other confirmation indicators to confirm your entry. Feel free to modify the script for your own system. Feel free to follow me on twitter @Lancelot_Auger I will be posting more content in the future, stay tuned. And lastly, Free hong kong, the revolution of our time! مؤشر Pine Script®من Lancelot_Augur33203
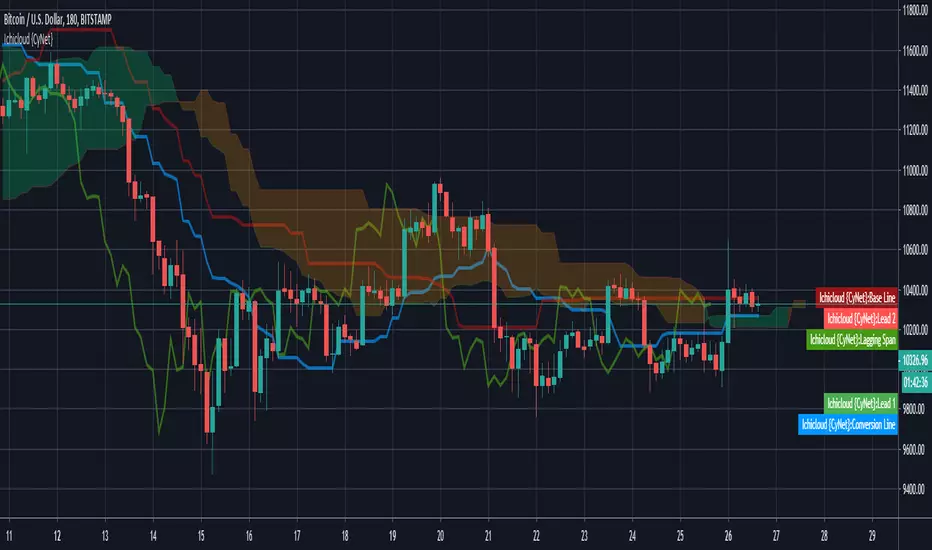
Ichimoku Cloud {Cybernetwork}Ichimoku Cloud with parameters optimized for Crypto. ~ * ~ * ~ * ~ * ~ * ~ * ~ * ~ * ~ * ~ * ~ * ~ * ~ * ~ * ~ * ~ * ~ * ~ * ~ * ~ * ~ Taken from: school.stockcharts.com (Aug 2019) Bullish Signals: Price moves above cloud (trend) Cloud turns from red to green (ebb-flow within trend) Price Moves above the Base Line (momentum) Conversion Line moves above Base Line (momentum) Bearish Signals: Price moves below cloud (trend) Cloud turns from green to red (ebb-flow within trend) Price Moves below Base Line (momentum) Conversion Line moves below Base Line (momentum) ~ * ~ * ~ * ~ * ~ * ~ * ~ * ~ * ~ * ~ * ~ * ~ * ~ * ~ * ~ * ~ * ~ * ~ * ~ * ~ * ~ Please check out my other indicators sets and series, e.g. LIVIDITIUM (dynamic levels), AEONDRIFT (standard deviation bands), FUSIONGAPS (MA based oscillators), MAJESTIC (Momentum/Acceleration/Jerk Oscillators), PRISM (PSAR based oscillator, with RSI/StochRSI as well as Momentum/Acceleration/Jerk indicators), and more to come. Constructive feedback and suggestions are welcome. ~ JuniAiko (=^~^=)v~مؤشر Pine Script®من cybernetworkتم تحديثه 24
Kinjun-Sen + VWap [xdecow]Simple indicator Kinjun-Sen + VWapمؤشر Pine Script®من xdecowتم تحديثه 44267
MIN_MA_BB_Ichimoku Cloud이동평균선 11개 설정가능 볼린저밴드 일목구름 총 13개 지표가 들어가있음 مؤشر Pine Script®من Destroyتم تحديثه 48
[MIN] MA_BB_Ichimoku Cloud이동평균선 11개 볼리저맨드 일목구름 3가지가 합쳐진지표입니다. 총 지표만 13개들어가있습니다 편안하게 수정해서 쓰시면됩니다. مؤشر Pine Script®من Destroy31
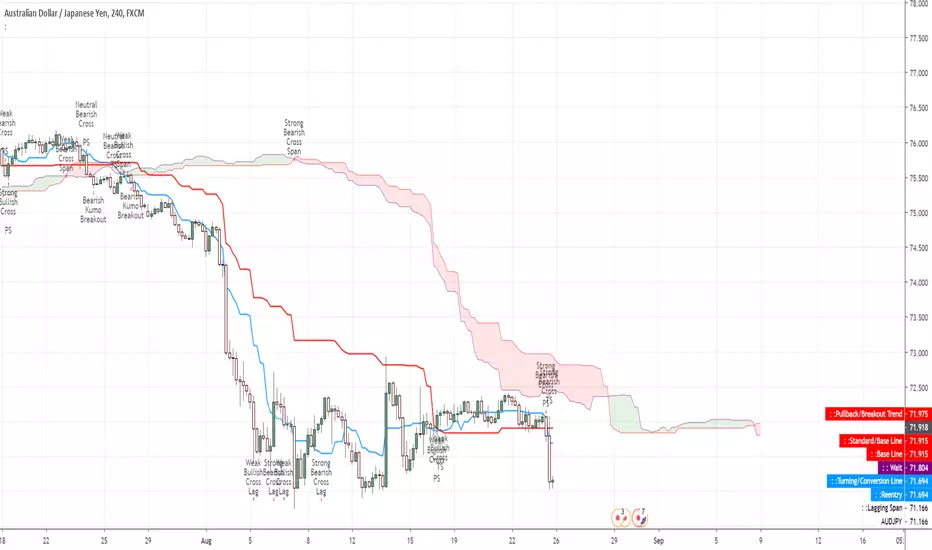
Ichimoku Prawn CloudCustomized version of the Ichimoku Cloud. استراتيجية Pine Script®من subnet-zeroتم تحديثه 2
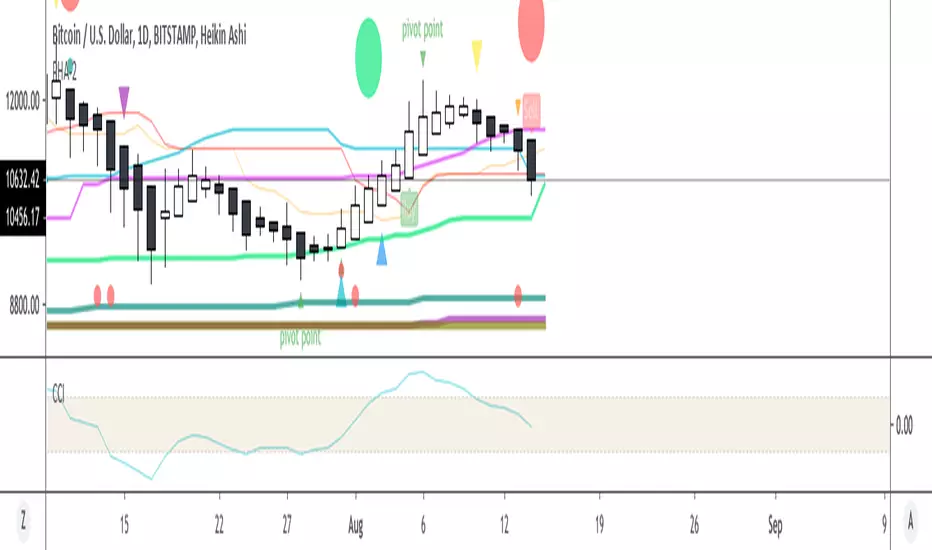
HAZHIRthis is the improved version of PHA-2 plus Hazhir ichi مؤشر Pine Script®من HAZHIR007تم تحديثه 2268
MT-EMA & BB & IchimokuEMA (with Multi Time Frame = Daily)+ Bollinger Bands + Simple Ichimoku Cloudsمؤشر Pine Script®من btc_i7k_تم تحديثه 23
Filtered Waves [NXT2017] #Linda Raschke #basics on Arthur MerrilHI BIG PLAYERS, this script I wrote for an enquiry of a tradingview-user. It should represent the Filtered Waves idea from Arthur Merril and used by Linda Raschke. It's similar like a visualization of Elliott Waves. On YouTube title "MTA UK Chapter Presentation with Linda Raschke" between 34-36 minutes Linda Raschke shows the rules for her Filterd Waves. Any questions? Ask me! King regards NXT2017 ======== TO MY PERSON I'm the second winner of the official German Forex Trading Competition in 2018. Look here to the ranks: deutsche-trading-meisterschaften.de I speak german, english and russian. My strength in trading are Wolfe Wave pattern.مؤشر Pine Script®من NXT20171212 1.7 K
PHA-2 plus Ichi HAZHIR Athe combination of PHA-2 with Ichi HAZHIR A togetherمؤشر Pine Script®من HAZHIR007تم تحديثه 28
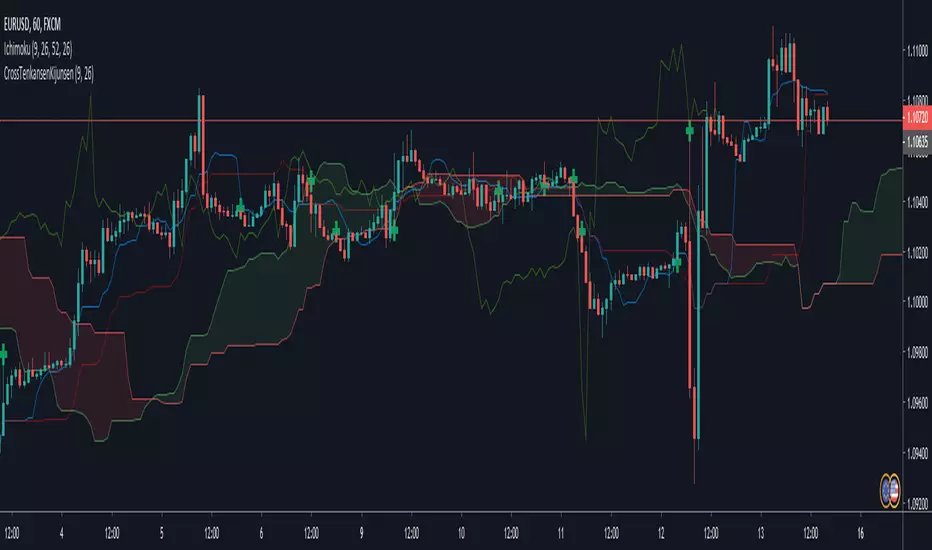
Ichimoku Cross Indicator [Mehdihz]This script shows tenken & kijen lines position to better detection of crosses.مؤشر Pine Script®من UnknownUnicorn300158811141
[M10] Ichimoku Keltner Channel Scalper [Alerts]Hey all, This script combines a couple of popular indicators to create a reliable yet versatile opportunity to automate trades based on the Ichimoku Cloud. The idea is to use bullish/bearish Ichimoku crossovers to enter positions whilst taking advantage of a modified Keltner Channel to exit these positions at maximum profit. The script has been backtested on various timeframes and proves effective in both trending and ranging markets. I have also added the ability to limit your positions to only long, or short, if this is of preference. Want to backtest this? A strategy version of this script is also available at no cost on my page - enjoy! Any questions? Let me know!مؤشر Pine Script®من Matt10Clarke1060