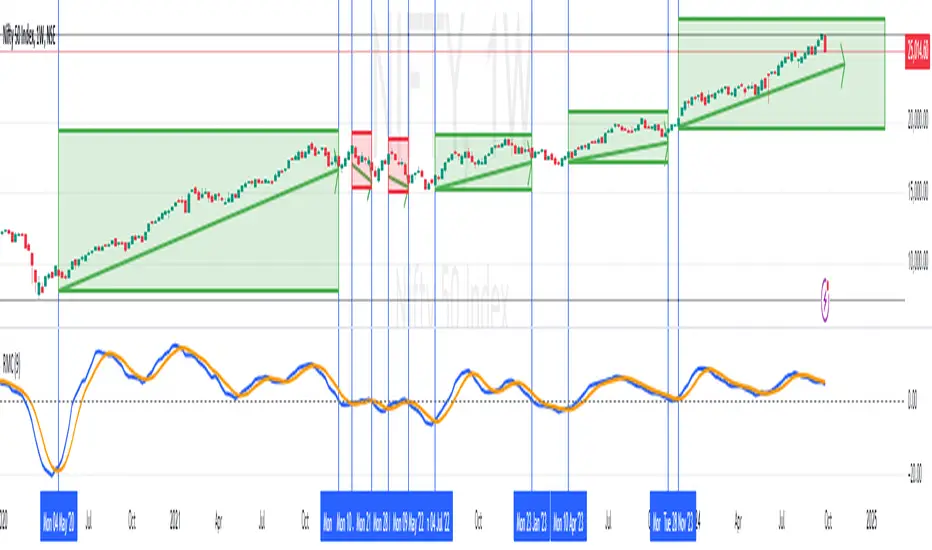
RoC Momentum CycleRoC Momentum Cycles (RMC) is derived from RoC (Rate of Change) indicator.
Motivation behind RMC: Addressing RoC’s Shortcomings
While the Rate of Change (RoC) indicator is a valuable tool for assessing momentum, it has notable limitations that traders must be aware of. One of the primary challenges with the traditional RoC is its sensitivity to price fluctuations, which can lead to false signals in volatile markets. This often results in premature entries or exits, impacting trading performance.
By smoothing out the RoC calculations and focusing on more consistent signal generation (using SMA on smoothed RoC), RMC offers a more consistent representation of price trends.
Momentum Cycles
RMC helps visualize momentum cycles in a much better way compared to RoC.
Long Momentum Cycle : A cross-over of smoothed RoC (blue line) above averaged signal (orange line) below zero marks start of a new potential upside cycle which ends when the blue line comes back to zero line from above.
Short Momentum Cycle : A cross-under of blue line below orange line above zero marks beginning of a potential downside cycle which ends when the blue line comes back to zero from below.
مؤشر الزخم
Momentum-Based Buy/Sell SignalsBuy Signal:
Triggered when ROC > threshold and the MACD line crosses above the Signal line.
Sell Signal:
Triggered when ROC < threshold and the MACD line crosses below the Signal line.
Visual Elements:
Green labels with "Buy" are displayed below the bars for buy signals.
Red labels with "Sell" are displayed above the bars for sell signals.
The background turns green during a buy signal and red during a sell signal for better visual clarity.

Price-Shift Oscillator (PSO)The PSOscillator calculates an oscillator value based on price movements over a specific period. Oscillators like this one are typically used to identify momentum shifts, and trend direction. Here's a breakdown of how the logic behind it works:
Key Concepts for Beginners:
Oscillators:
In this case, the PSOscillator helps indicate whether the market momentum is positive (price might rise) or negative (price might fall).
Input Parameters:
oscPeriod: This is the number of bars (or candles) used to calculate the oscillator. It affects how sensitive the oscillator is to price changes. A lower period makes it more sensitive to short-term movements, while a higher period smoothens it out.
smaPeriod: This is a simple moving average (SMA) applied to the oscillator for additional smoothing, further reducing noise.
Calculation Logic:
The JpOscillator uses recent price data to calculate its value. Specifically, it looks at the closing prices of the current and previous bars (candles). periods ago).
This calculation aims to identify how much recent price action is deviating from past price behavior.
Essentially, it tells us whether the current price is higher or lower relative to the past, and how the trend is evolving over recent periods.
Smoothing:
After calculating the oscillator values, we apply optional smoothing to make it less "jumpy." This is useful in reducing the noise caused by small, insignificant price movements.
The sma_from_array function averages out the recent oscillator values to make the signal smoother, depending on the oscPeriod.
Oscillator Levels:
Above Zero:
If the oscillator is above 0, it means the price is gaining momentum upwards (bullish signal), which is why we color the histogram green.
Below Zero: If the oscillator is below 0, it indicates downward momentum (bearish signal), which is why we color the histogram red.
You can think of the zero line as a "neutral zone." Crossing above it means momentum is shifting to the upside, and crossing below it means momentum is shifting to the downside.
Histogram Plotting:
The values of the oscillator are plotted as a histogram (bars). The color changes based on whether the oscillator is above or below zero (green for positive and red for negative momentum).
The moving average (SMA) of the oscillator is plotted as a line to help identify trends over time.
Using two different coloring methods for a histogram in a trading strategy can provide a trader with distinct, layered information about market conditions, trends, and momentum shifts. Each coloring method can highlight different aspects of the price action or the oscillator behavior. Here’s how a trader might use both methods to their advantage:
ETHUSDT Daily
1. Color Based on Oscillator Position Relative to Zero
This method colors the histogram green when the oscillator value is above zero and red when it's below zero. This coloring strategy is straightforward and helps a trader quickly identify whether the market's momentum is generally bullish or bearish.
Advantages:
Trend Confirmation: When the oscillator remains above zero and green, it can confirm a bullish trend, and vice versa for a bearish trend with red colors below zero.
Quick Visual Reference: Easy to see at a glance, helping in fast decision-making processes.
2. Color Based on the Change of the Oscillator
This method changes the color based on whether the oscillator is increasing or decreasing compared to its previous value. For instance, a darker shade of green might be used if the oscillator value is rising from one period to the next, indicating increasing bullish momentum, and a darker red if declining, indicating increasing bearish momentum.
Advantages:
Momentum Insight: This coloring method gives insights into the strength of the movement. An oscillator that is increasing (even below zero) might suggest a weakening of a bearish trend or the start of a bullish reversal.
Detecting Reversals: Seeing the oscillator rise from negative to less negative or drop from positive to less positive can alert traders to potential early reversals before they cross the zero line.
Strategic Use in Trading:
A trader can use these two methods together by applying a multi-layered approach to analyze the oscillator:
Overall Trend Assessment:
Above Zero (Green): Considered bullish; look for buy opportunities, especially if the color gets brighter (indicating strengthening).
Below Zero (Red): Considered bearish; look for sell opportunities, especially if the color gets darker (indicating strengthening).
Short-Term Momentum and Entries:
Brightening Green: Could indicate a good time to enter or add to long positions as bullish momentum increases.
Darkening Red: Could indicate a good time to enter or add to short positions as bearish momentum increases.
Lightening Color: If red starts to lighten (become less intense), it might suggest a bearish trend is losing steam, which could be an exit signal for shorts or an early warning for a potential long setup.
Risk Management:
Switch in Color Intensity: A sudden change in color intensity can be used as a trigger for tightening stops or taking partial profits, helping manage risk by responding to changes in market momentum.

PRICE STREAK [DIGGERDOG]PRICE STREAK
This Pine Script, titled **"PRICE STREAK "**, tracks the number of consecutive up or down price closes and visualizes the result in a histogram-style plot. It provides a visual representation of price momentum by counting the number of consecutive days where the closing price is either higher or lower than the previous day. The histogram changes color depending on whether the streak is upward (green) or downward (red).
Key Features:
1. **Upcount and Dncount Calculation:**
- **Upcount** is incremented each time the current close is higher than the previous close. It resets when the close price decreases.
- **Dncount** is incremented each time the current close is lower than the previous close. It resets when the close price increases.
- The script does not differentiate between upward and downward streak lengths in terms of plotting; it combines them in one cumulative count.
2. **Plot with Color-Coded Streaks:**
- The script plots the sum of **Upcount** and **Dncount** as a histogram, where:
- **Green bars** represent upward price streaks (the price is closing higher).
- **Red bars** represent downward price streaks (the price is closing lower).
3. **Threshold Line:**
- A horizontal line is plotted at a value of **2** as a visual threshold to help identify periods where streaks exceed this value. This can be adjusted as needed to indicate different threshold levels for streak significance.
How It Works:
1. **Price Streak Logic:**
- For each bar, the script compares the closing price to the previous bar's closing price:
- If the current close is greater than the previous close, the **Upcount** is incremented, and **Dncount** is reset.
- If the current close is less than the previous close, the **Dncount** is incremented, and **Upcount** is reset.
- The cumulative count of these streaks is plotted.
2. **Color-Coded Histogram:**
- The histogram uses a dynamic color based on whether the streak is upward or downward:
- **Green** for upward streaks.
- **Red** for downward streaks.
Visualization:
- The histogram will help you easily spot whether there has been a significant price streak, whether upward or downward, and how long the streaks last.
- The threshold line helps in identifying when the streaks are significant by providing a reference point (e.g., streaks greater than 2).
Customizations:
- **Threshold**: You can adjust the value of the horizontal line (`hline(2)`) to any number that suits your strategy.
- **Colors**: The green and red colors can be changed to your preference for visual clarity.
Use Case:
This script is ideal for traders who want to track the **momentum** in price movements. If a stock has several consecutive up days or down days, it may indicate **strong momentum** or **trend exhaustion**, depending on the length of the streak. This indicator can help identify potential trend continuation or reversal points.
If you need additional customizations or have any questions, feel free to ask!

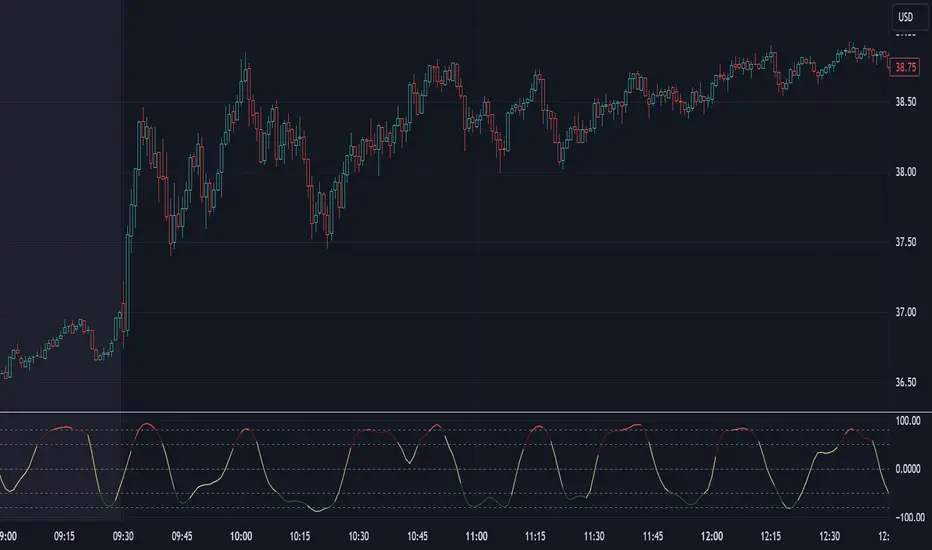
Prime OscilatorPrime Oscilator is a powerful tool designed to help traders track momentum shifts and confirm trends in volatile markets. This oscillator-based tool integrates advanced market analysis techniques to provide a clear picture of momentum and trend direction, helping traders stay in sync with the prevailing market conditions.
Core Features of Prime Oscilator
Oscillator-Based Momentum Tracking: Prime Oscilator operates as a dynamic oscillator that tracks shifts in market momentum by analyzing the relationship between the A/D line and its signal line. This allows traders to identify potential changes in market direction and confirm trend strength.
Trend Confirmation Filter: Prime Oscilator incorporates a long-term trend filter, using a 50-period Simple Moving Average (SMA) to confirm whether the market is trending upward or downward. This helps traders focus on trades that align with the broader market direction.
Adaptive Signal Line: The oscillator’s signal line adjusts dynamically to reflect short-term momentum changes, allowing traders to react quickly to evolving market conditions. This makes the Prime Oscilator highly responsive to both fast-moving and stable markets.
Color-Coded Oscillator Line: The oscillator line changes color based on the current market conditions, providing a visual cue of momentum shifts. The line remains green during upward momentum and red during downward momentum, giving traders an easy way to gauge the market direction.
How Prime Oscilator Works
Prime Oscilator blends the power of trend analysis with momentum tracking to provide a comprehensive view of market conditions. By analyzing the Accumulation/Distribution (A/D) line and comparing it to a dynamic signal line, traders can monitor momentum shifts and confirm trends.
A/D Line Crossover: The indicator uses the relationship between the A/D line and the signal line to detect potential momentum changes. When the A/D line moves relative to the signal line, it reflects shifts in market momentum, allowing traders to follow the direction of the trend.
Trend Filtering: To ensure that momentum is aligned with the broader market direction, Prime Oscilator uses a 50-period SMA as a trend filter. This confirms whether the market is in an uptrend or downtrend and helps traders avoid focusing on short-term fluctuations that go against the prevailing trend.
Why It's Useful for Traders
Prime Oscilator is especially valuable for traders looking for a reliable way to track momentum shifts while aligning their trades with the overall market trend. This reduces noise and ensures that traders focus on opportunities that are in line with broader market movements.
Momentum-Based Trend Analysis: By tracking momentum changes, Prime Oscilator helps traders stay on top of potential market shifts without the noise that comes from traditional indicators.
Clear Visual Feedback: The color-coded oscillator line provides instant feedback on market conditions, allowing traders to focus on decision-making rather than analyzing multiple indicators.
Flexible Across Markets and Timeframes: Whether you are trading in volatile markets or more stable environments, Prime Oscilator adapts to different market conditions, ensuring you always have a clear picture of momentum and trend.
Prime Oscilator is ideal for traders who:
Scalp or trade intraday: Quickly captures momentum shifts in short timeframes.
Swing traders: Identifies potential trend reversals in higher timeframes while confirming momentum strength.
Trend followers: Ensures your trades are aligned with the prevailing market trend by confirming momentum shifts.
By combining momentum analysis with trend direction, Prime Oscilator offers a dynamic view of the market, helping traders navigate changing conditions with ease.
Why It's Worth Paying For
Prime Oscilator provides several unique advantages that make it a valuable tool for traders:
Clear and Actionable Insights: The oscillator-based momentum tracking gives traders a clear understanding of when the market's momentum is shifting, allowing for more informed trading decisions.
No Lagging: Unlike some trend-following indicators, Prime Oscilator reacts dynamically to market changes, helping traders stay aligned with the current market direction.
Adaptable and Flexible: Whether you trade on shorter timeframes or hold longer positions, Prime Oscilator adapts seamlessly to various market conditions. The trend filter ensures that traders remain aligned with broader market trends.
Visual Simplicity: The color-coded oscillator line and background shading provide an easy-to-read way of monitoring market conditions, enabling faster decision-making.
How to Get Access
To gain access to Prime Oscilator , please send me a direct message on TradingView or follow the provided link to request access. Ensure that access requests are made privately so the comments section remains focused on discussions related to the script’s performance and use.
Risk Disclaimer
While Prime Oscilator offers valuable insights into market momentum and trends, it’s important to note the following:
Past performance is not indicative of future results: Prime Oscilator ’s trend and momentum analysis are based on historical data, and no indicator can predict future price movements with certainty.
Market Conditions: The effectiveness of the Prime Oscilator may vary across different market conditions, and traders should always use proper risk management when trading.
Trading Risks: Like any trading tool, Prime Oscilator should be used as part of a comprehensive trading strategy that includes risk management techniques such as stop-loss orders and position sizing.

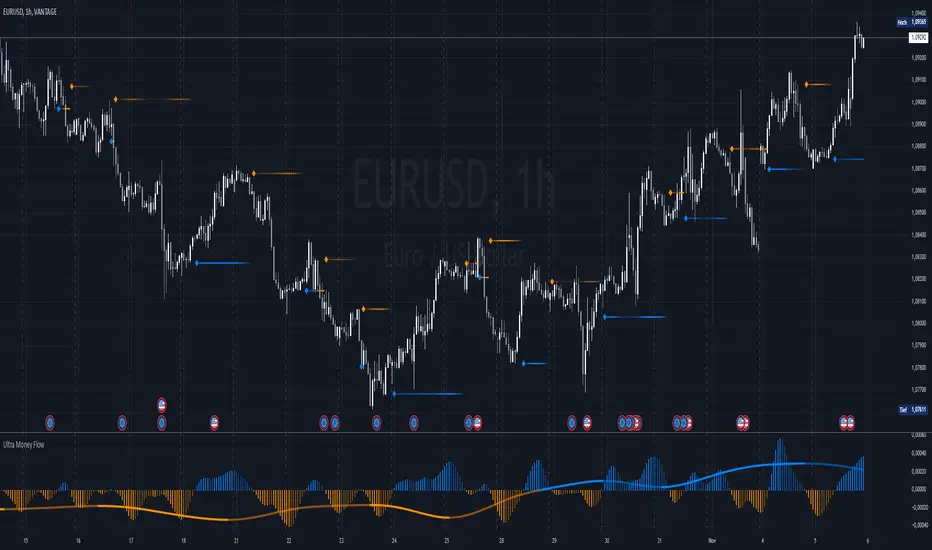
Ultra Money FlowIntroduction
The Ultra Money Flow script is a technical indicator for analyzing stock trends. It highlights buying and selling power, helping you identify bullish (rising) or bearish (falling) market trends.
Detailed Description
The Ultra Money Flow script calculates and visually displays two main components: Fast and Slow money flow. These components represent short-term and long-term trends, respectively.
Here's how it works:
.........
Inputs
You can adjust the speed of analysis (Fast Length and Slow Length) and the type of smoothing applied (e.g., Simple Moving Average, Exponential Moving Average).
Choose colors for visualizing the trends, with blue for bullish (positive) and orange for bearish (negative) movements.
.....
Money Flow Calculation
The script analyzes price changes (delta) over specified periods.
It separates upward price movements (buying power) from downward ones (selling power).
It then calculates the difference between these powers for both Fast and Slow components.
The types of smoothing methods range from traditional ones like the Simple Moving Average (SMA) to advanced ones like the Double Expotential Moving Average (DEMA) or the Triple Exponential Moving Average (TEMA) or the Recursive Moving Average (RMA) or the Weigthend Moving Average (WMA) or the Volume Weigthend Moving Average (VWMA) or Hull Moving Average (HMA).
Very Special ones are the Triple Weigthend Moving Average (TWMA) wich created RedKTrader .
I created the Multi Weigthend Moving Average (MWMA) wich is a simple signal line to the TWMA.
.....
Divergence
This indicator can show divergence by comparing the direction of price movements with the indicator value.
If the price and the indicator move in opposite directions, you can use these signals to help decide when to buy or sell.
.....
Auto Scaling
The script adjusts its calculations based on the time frame you are viewing, whether it's minutes, hours, or days, ensuring accurate representation across different time scales.
.....
Plotting
The script plots the Fast component as a histogram and the Slow component as a line, using the chosen colors to indicate bullish or bearish trends.
The thickness and transparency of these plots give additional clues about the strength of the trend.
.........
By using this indicator, traders can easily spot shifts in buying and selling power, allowing for better-informed decisions in the market.
Special Thanks
I use the TWMA-Function created from RedKTrader to smooth the values.
Special thanks to him for creating and sharing this function!
Custom MACD Oscillator with Bar ColoringCustom MACD Oscillator with Bar Coloring
This custom MACD indicator is a fusion of two powerful MACD implementations, combining the best features of both the MACD Crossover by HPotter and the Multiple Time Frame Custom MACD Indicator by ChrisMoody. The indicator enhances the traditional MACD with customizable options and dynamic bar coloring based on the relationship between the MACD and Signal lines, providing a clear visual representation of momentum shifts in the market.
Key Features:
MACD Oscillator: Built on the core MACD principle, showing the difference between two Exponential Moving Averages (EMA) for momentum tracking.
Signal Line: A Simple Moving Average (SMA) of the MACD, helping to identify potential entry/exit points through crossovers.
Multiple Time Frame Support: Allows users to view MACD and Signal data from different timeframes, giving a broader view of the market dynamics.
Bar Coloring: Bars are colored green when the MACD is above the Signal line (bullish), red when the MACD is below (bearish), and blue during neutral conditions.
Histogram with Custom Colors: A customizable histogram visualizes the difference between the MACD and Signal lines with color-coding to represent changes in momentum.
Cross Dots: Visual markers at points where the MACD crosses the Signal line for easy identification of potential trend shifts.
This indicator is a versatile tool for traders who want to visualize MACD-based momentum and crossover signals in multiple timeframes with clear visual cues on price bars.

Multi-Asset Cross Timeframe Divergence Ind. (MACDI) // AlgoFyreThe Multi-Asset Cross Timeframe Divergence Indicator (MACDI) identifies divergences in momentum like RSI across multiple assets and timeframes. It visually highlights lagging correlated asset momentum divergences, helping traders spot inefficiencies and potential trade opportunities in the following asset.
🔶 KEY FEATURES
🔸Average Momentum Trendline for Each Timeframe
The Average Momentum Trendline feature calculates the average momentum of multiple assets over specified timeframes. It uses smoothed values to determine the momentum trend for each timeframe on the average aggregated momentum of both assets. This trendline helps traders identify the overall direction of the market momentum, providing a clearer picture of potential price movements.
🔸Real-time Divergence Indication and Alert Table
The Real-time Divergence Indications and Alert Table feature visualizes detected divergences between the momentum values of the two assets across different timeframes. It identifies both bullish and bearish divergences, signaling lagging reversals in the the following asset and potential trading opportunities. When a divergence is detected, the system generates real-time visual indications on the chart and in an overview table for traders to act promptly. The alert table provides a comprehensive overview of all detected divergences, making it easier for traders to monitor and respond to market changes.
🔸Color and Size Based Labels on Price Chart based on Divergence Type
The Color and Size Based Labels feature visually represents divergences directly on the price chart. Bullish and bearish divergences are marked with distinct colors and sizes, making them easily identifiable at a glance. Larger labels indicate higher timeframes and thus generally more significance.
🔶 INSTRUCTION GUIDELINES
🔸Identify Divergence Clusters
The more divergences align, the higher the probability of a potential trend reversal in the asset. When multiple multi-timeframe divergences occur in both lower and higher timeframes within a local cluster, the probability of a reversal increases. This is valid for both for bullish and bearish divergences.
🔸Spot Low Probability Divergences
To further increase the probability, analyze the current state of the average momentum trendline. For a bullish reversal, a relatively low level of the average momentum trendline is preferred, whereas for a bearish reversal, a relatively high level is preferred.
🔶 INDIVIDUAL CONFIGURATION
🔸Leading Asset
This input allows the user to select the leading asset for the divergence analysis.
🔸Following Asset
This input allows the user to select the following asset for the divergence analysis.
🔸Higher Timeframe
This input sets the higher timeframe for the analysis.
🔸Lower Timeframe
This input sets the lower timeframe for the analysis.
🔸Show RSI Divergence
This input enables or disables the display of RSI divergence signals.
🔸RSI Length
This input sets the length of the RSI calculation.
🔸RSI Source
This input sets the source data for the RSI calculation (e.g., close price).
🔸RSI Smoothing Length
This input sets the length of the smoothing applied to the RSI values.
🔸Smoothing Method
This input sets the method used for smoothing the RSI values.
🔶 CONCLUSION
The Multi-Asset Cross Timeframe Divergence Indicator (MACDI) is a powerful tool for identifying momentum divergences across multiple assets and timeframes. Its visual cues and customizable table make it easy to use and interpret, providing valuable insights for trading decisions.

Relative Strength and MomentumRelative Strength and Momentum Indicator
Unlock deeper market insights with the Relative Strength and Momentum Indicator—a powerful tool designed to help traders and investors identify the strongest stocks and sectors based on relative performance. This custom indicator displays essential information on relative strength and momentum for up to 15 different symbols, compared against a benchmark index, all within a clear and organized table format.
Key Features:
1. Customizable Inputs: Choose up to 15 symbols to compare, along with a benchmark index, allowing you to tailor the indicator to your trading strategy. The 'Lookback Period' input defines how many weeks of data are analyzed for relative strength and momentum.
2. Relative Strength Calculation: For each selected symbol, the indicator calculates the Relative Strength (RS) against the chosen benchmark. This RS is further refined using an exponential moving average (EMA) to smooth the results, providing a more stable trend overview.
3. Momentum Analysis: Momentum is determined by analyzing the rate of change in relative strength. The indicator calculates a momentum rank for each symbol, based on its relative strength’s improvement or deterioration.
4. Percentile Ranking System: Each symbol is assigned a percentile rank (from 1 to 100) based on its relative strength compared to the others. Similarly, momentum rankings are also assigned from 1 to 100, offering a clear understanding of which assets are outperforming or underperforming.
5. Visual Indicators:
a. Green: Signals improving or stable relative strength and momentum.
b. Red: Indicates declining relative strength or momentum.
c. Aqua: Highlights symbols performing well on both relative strength and momentum—ideal candidates for further analysis.
6. Two Clear Tables:
a. Relative Strength Rank Table: Displays weekly rankings of relative strength for each symbol.
b. Momentum Table: Shows momentum trends, helping you identify which symbols are gaining or losing strength.
7. Color-Coded for Easy Analysis: The tables are color-coded to make analysis quick and straightforward. A green color means the symbol is performing well in terms of relative strength or momentum, while red indicates weaker performance. Aqua marks symbols that are excelling in both areas.
Use Case:
a. Sector Comparison: Identify which sectors or indexes are showing both relative strength and momentum to pick high-potential stocks. This allows you to align with broader market trends for improved trade entries.
b. Stock Selection: Quickly compare symbols within the same sector to find the stronger performers.

Gaussian Acceleration ArrayIndicators play a role in analyzing price action, trends, and potential reversals. Among many of these, velocity and acceleration have held a significant place due to their ability to provide insight into momentum and rate of change. This indicator takes the old calculation and tweaks it with gaussian smoothing and logarithmic function to ensure proper scaling.
A Brief on Velocity and Acceleration: The concept of velocity in trading refers to the speed at which price changes over time, while acceleration is the rate of change(ROC) of velocity. Early momentum indicators like the RSI and MACD laid foundation for understanding price velocity. However, as markets evolve so do we as technical analysts, we seek the most advanced tools.
The Acceleration/Deceleration Oscillator, introduced by Bill Williams, was one of the early attempts to measure acceleration. It helped gauge whether the market was gaining or losing momentum. Over time more specific tools like the "Awesome Oscillator"(AO) emerged, which has a set length on the datasets measured.
Gaussian Functions: Named after the mathematician Carl Friedrich Gauss, the Gaussian function describes a bell-shaped curve, often referred to as the "normal distribution." In trading these functions are applied to smooth data and reduce noise, focusing on underlying patterns.
The Gaussian Acceleration Array leverages this function to create a smoothed representation of market acceleration.
How does it work?
This indicator calculates acceleration based the highs and lows of each dataset
Once the weighted average for velocity is determined, its rate of change essentially becomes the acceleration
It then plots multiple lines with customizable variance from the primary selected length
Practical Tips:
The Gaussian Acceleration Array offers various customizable parameters, including the sample period, smoothing function, and array variance. Experiment with these settings to tailor it to preferred timeframes and styles.
The color-coded lines and background zones make it easier to interpret the indicator at a glance. The backgrounds indicate increasing or decreasing momentum simply as a visual aid while the lines state how the velocity average is performing. Combining this with other tools can signal shifts in market dynamics.

Uptrick: Momentum-Volatility Composite Signal### Title: Uptrick: Momentum-Volatility Composite Signal
### Overview
The "Uptrick: Momentum-Volatility Composite Signal" is an innovative trading tool designed to offer traders a sophisticated synthesis of momentum, volatility, volume flow, and trend detection into a single comprehensive indicator. This tool stands out by providing an integrated view of market dynamics, which is critical for identifying potential trading opportunities with greater precision and confidence. Its unique approach differentiates it from traditional indicators available on the TradingView platform, making it a valuable asset for traders aiming to enhance their market analysis.
### Unique Features
This indicator integrates multiple crucial elements of market behavior:
- Momentum Analysis : Utilizes Rate of Change (ROC) metrics to assess the speed and strength of market movements.
- Volatility Tracking : Incorporates Average True Range (ATR) metrics to measure market volatility, aiding in risk assessment.
- Volume Flow Analysis : Analyzes shifts in volume to detect buying or selling pressure, adding depth to market understanding.
- Trend Detection : Uses the difference between short-term and long-term Exponential Moving Averages (EMA) to detect market trends, providing insights into potential reversals or confirmations.
Customization and Inputs
The Uptrick indicator offers a variety of user-defined settings tailored to fit different trading styles and strategies, enhancing its adaptability across various market conditions:
Rate of Change Length (rocLength) : This setting defines the period over which momentum is calculated. Shorter periods may be preferred by day traders who need to respond quickly to market changes, while longer periods could be better suited for position traders looking at more extended trends.
ATR Length (atrLength) : Adjusts the timeframe for assessing volatility. A shorter ATR length can help day traders manage the quick shifts in market volatility, whereas longer lengths might be more applicable for swing or position traders who deal with longer-term market movements.
Volume Flow Length (volumeFlowLength): Determines the analysis period for volume flow to identify buying or selling pressure. Day traders might opt for shorter periods to catch rapid volume changes, while longer periods could serve swing traders to understand the accumulation or distribution phases better.
Short EMA Length (shortEmaLength): Specifies the period for the short-term EMA, crucial for trend detection. Shorter lengths can aid day traders in spotting immediate trend shifts, whereas longer lengths might help swing traders in identifying more sustainable trend changes.
Long EMA Length (longEmaLength): Sets the period for the long-term EMA, which is useful for observing longer-term market trends. This setting is particularly valuable for position traders who need to align with the broader market direction.
Composite Signal Moving Average Length (maLength): This parameter sets the smoothing period for the composite signal's moving average, helping to reduce noise in the signal output. A shorter moving average length can be beneficial for day traders reacting to market conditions swiftly, while a longer length might help swing and position traders in smoothing out less significant fluctuations to focus on significant trends.
These customization options ensure that traders can fine-tune the Uptrick indicator to their specific trading needs, whether they are scanning for quick opportunities or analyzing more prolonged market trends.
### Functionality Details
The indicator operates through a sophisticated algorithm that integrates multiple market dimensions:
1. Momentum and Volatility Calculation : Combines ROC and ATR to gauge the market’s momentum and stability.
2. Volume and Trend Analysis : Integrates volume data with EMAs to provide a comprehensive view of current market trends and potential shifts.
3. Signal Composite : Each component is normalized and combined into a composite signal, offering traders a nuanced perspective on when to enter or exit trades.
The indicator performs its calculations as follows:
Momentum and Volatility Calculation:
roc = ta.roc(close, rocLength)
atr = ta.atr(atrLength)
Volume and Trend Analysis:
volumeFlow = ta.cum(volume) - ta.ema(ta.cum(volume), volumeFlowLength)
emaShort = ta.ema(close, shortEmaLength)
emaLong = ta.ema(close, longEmaLength)
emaDifference = emaShort - emaLong
Composite Signal Calculation:
Normalizes each component (ROC, ATR, volume flow, EMA difference) and combines them into a composite signal:
rocNorm = (roc - ta.sma(roc, rocLength)) / ta.stdev(roc, rocLength)
atrNorm = (atr - ta.sma(atr, atrLength)) / ta.stdev(atr, atrLength)
volumeFlowNorm = (volumeFlow - ta.sma(volumeFlow, volumeFlowLength)) / ta.stdev(volumeFlow, volumeFlowLength)
emaDiffNorm = (emaDifference - ta.sma(emaDifference, longEmaLength)) / ta.stdev(emaDifference, longEmaLength)
compositeSignal = (rocNorm + atrNorm + volumeFlowNorm + emaDiffNorm) / 4
### Originality
The originality of the Uptrick indicator lies in its ability to merge diverse market metrics into a unified signal. This multi-faceted approach goes beyond traditional indicators by offering a deeper, more holistic analysis of market conditions, providing traders with insights that are not only based on price movements but also on underlying market dynamics.
### Practical Application
The Uptrick indicator excels in environments where understanding the interplay between volume, momentum, and volatility is crucial. It is especially useful for:
- Day Traders : Can leverage real-time data to make quick decisions based on sudden market changes.
- Swing Traders : Benefit from understanding medium-term trends to optimize entry and exit points.
- Position Traders : Utilize long-term market trend data to align with overall market movements.
### Best Practices
To maximize the effectiveness of the Uptrick indicator, consider the following:
- Combine with Other Indicators : Use alongside other technical tools like RSI or MACD for additional validation.
- Adapt Settings to Market Conditions : Adjust the indicator settings based on the asset and market volatility to improve signal accuracy.
- Risk Management : Implement robust risk management strategies, including setting stop-loss orders based on the volatility measured by the ATR.
### Practical Examples and Demonstrations
- Example for Day Trading : In a volatile market, a trader notices a sharp increase in the momentum score coinciding with a surge in volume but stable volatility, signaling a potential bullish breakout.
- Example for Swing Trading : On a 4-hour chart, the indicator shows a gradual alignment of decreasing volatility and increasing buying volume, suggesting a strengthening upward trend suitable for a long position.
### Alerts and Their Uses
- Alert Configurations : Set alerts for when the composite score crosses predefined thresholds to capture potential buy or sell events.
- Strategic Application : Use alerts to stay informed of significant market moves without the need to continuously monitor the markets, enabling timely and informed trading decisions.
Technical Notes
Efficiency and Compatibility: The indicator is designed for efficiency, running smoothly across different trading platforms including TradingView, and can be easily integrated with existing trading setups. It leverages advanced mathematical models for normalizing and smoothing data, ensuring consistent and reliable signal quality across different market conditions.
Limitations : The effectiveness of the Uptrick indicator can vary significantly across different market conditions and asset classes. It is designed to perform best in liquid markets where data on volume, volatility, and price trends are readily available and reliable. Traders should be aware that in low-liquidity or highly volatile markets, the signals might be less reliable and require additional confirmation.
Usage Recommendations : While the Uptrick indicator is a powerful tool, it is recommended to use it in conjunction with other analysis methods to confirm signals. Traders should also continuously monitor the performance and adjust settings as needed to align with their specific trading strategies and market conditions.
### Conclusion
The "Uptrick: Momentum-Volatility Composite Signal" is a revolutionary tool that offers traders an advanced methodology for analyzing market dynamics. By combining momentum, volatility, volume, and trend detection into a single, cohesive indicator, it provides a powerful, actionable insight into market movements, making it an indispensable tool for traders aiming to optimize their trading strategies.

Composite Momentum█ Introduction
The Composite Momentum Indicator is a tool we came across that we found to be useful at detecting implied tops and bottoms within quick market cycles. Its approach to analyzing momentum through a combination of moving averages and summation techniques makes it a useful addition to the range of available indicators on TradingView.
█ How It Works
This indicator operates by calculating the difference between two moving averages—one fast and one slow, which can be customized by the user. The difference between these two averages is then expressed as a percentage of the fast moving average, forming the core momentum value which is then smoothed with an Exponential Moving Average is applied. The smoothed momentum is then compared across periods to identify directional changes in direction
Furthermore, the script calculates the absolute differences between consecutive momentum values. These differences are used to determine periods of momentum acceleration or deceleration, aiming to establish potential reversals.
In addition to tracking momentum changes, the indicator sums positive and negative momentum changes separately over a user-defined period. This summation is intended to provide a clearer picture of the prevailing market bias—whether it’s leaning towards strength or weakness.
Finally, the summed-up values are normalized to a percentage scale. This normalization helps in identifying potential tops and bottoms by comparing the relative strength of the momentum within a given cycle.
█ Usage
This indicator is primarily useful for traders who focus on detecting quick cycle tops and bottoms. It provides a view of momentum shifts that can signal these extremes, though it’s important to use it in conjunction with other tools and market analysis techniques. Given its ability to highlight potential reversals, it may be of interest to those who seek to understand short-term market dynamics.
█ Disclaimer
This script was discovered without any information about its author or original intent but was nonetheless ported from its original format that is available publicly. It’s provided here for educational purposes and should not be considered a guaranteed method for market analysis. Users are encouraged to test and understand the indicator thoroughly before applying it in real trading scenarios.
GKD-C Wavelet Oscillator [Loxx]The Giga Kaleidoscope GKD-C Wavelet Oscillator is a Confirmation module included in AlgxTrading's "Giga Kaleidoscope Modularized Trading System."
█ GKD-C Wavelet Oscillator, a brief overview
The Wavelet Oscillator is an advanced technical analysis tool that integrates wavelet transformations with the Kalman filter to provide a nuanced understanding of market trends and momentum. At the heart of this oscillator is the Haar wavelet transform, a mathematical technique that breaks down price data into different frequency components. The Haar transform works by analyzing the price series in pairs, calculating the average and difference between adjacent data points, effectively separating the underlying signal (trend) from noise or minor fluctuations. This decomposition allows the oscillator to isolate significant price movements and reconstruct them with greater clarity through the inverse Haar transform. The Kalman filter is then applied to further smooth the signal, refining the data and reducing the impact of short-term volatility.
This process enhances the oscillator's ability to detect subtle shifts in market dynamics that might be missed by conventional indicators. The GKD-C Wavelet Oscillator utilizes these refined signals to generate two types of trading signals: Zero-line crosses, where the oscillator moves above or below a central reference point, indicating potential bullish or bearish momentum, and Signal crosses, where the current oscillator value crosses its previous value, signaling possible trend reversals. These features make the Wavelet Oscillator particularly effective in identifying key turning points in the market, providing traders with a powerful tool for anticipating and responding to changes in price momentum within the GKD trading system. (Read the sections below to learn how traders can test these different signal types using AlgxTrading's GKD trading system.)
GKD-C Wavelet Oscillator in Zero-line crosses mode
GKD-C Wavelet Oscillator in Signal crosses mode
To explain the features included in the GKD-C Wavelet Oscillator, let's first dive into the details of the Giga Kaleidoscope (GKD) Modularized Trading System.
█ Giga Kaleidoscope (GKD) Modularized Trading System
The GKD Trading System is a comprehensive, algorithmic trading framework from AlgxTrading, designed to optimize trading strategies across various market conditions. It employs a modular approach, incorporating elements such as volatility assessment, trend identification through a baseline, multiple confirmation strategies for signal accuracy, and volume analysis. Key components also include specialized strategies for entry and exit, enabling precise trade execution. The system allows for extensive backtesting, providing traders with the ability to evaluate the effectiveness of their strategies using historical data. Aimed at reducing setup time, the GKD system empowers traders to focus more on strategy refinement and execution, leveraging a wide array of technical indicators for informed decision-making.
🔶 Core components of a GKD Algorithmic Trading System
Each GKD indicator is denoted with a module identifier of either: GKD-BT, GKD-B, GKD-C, GKD-V, GKD-M, or GKD-E. This allows traders to understand to which module each indicator belongs and where each indicator fits into the GKD system. The GKD algorithm is built on the principles of trend, momentum, and volatility. There are eight core components in the GKD trading algorithm:
🔹 Volatility - In the GKD trading system, volatility is used as a part of the system to help determine the appropriate stop loss and take profit levels for a trade. There are 17+ different types of volatility available in the GKD system including Average True Range (ATR), True Range Double (TRD), Close-to-Close, Garman-Klass, and more.
🔹 Baseline (GKD-B) - The baseline is essentially a moving average and is used to determine the overall direction of the market. The baseline in the GKD trading system is used to filter out trades that are not in line with the long-term trend of the market. The baseline is plotted on the chart along with other GKD indicators.
Trades are only taken when the price is in the same direction as the baseline. For example, if the baseline is sloping upwards or price is above the baseline, then only long trades are taken, and if the baseline is sloping downwards or price is below the baseline, then only short trades are taken. This approach helps to ensure that trades are in line with the overall trend of the market, and reduces the risk of entering trades that are likely to fail.
🔹 Confirmation 1, Confirmation 2, Continuation (GKD-C) - The GKD trading system incorporates technical confirmation indicators for the generation of its primary long and short signals, essential for its operation.
The GKD trading system distinguishes three specific categories. The first category, Confirmation 1, encompasses technical indicators designed to identify trends and generate explicit trading signals. The second category, Confirmation 2, a technical indicator used to identify trends; this type of indicator is primarily used to filter the Confirmation 1 indicator signals; however, this type of confirmation indicator also generates signals*. Lastly, the Continuation category includes technical indicators used in conjunction with Confirmation 1 and Confirmation 2 to generate a special type of trading signal called a "Continuation"
In a full GKD trading system all three categories generate signals. (see the section “GKD Trading System Signals” below)
🔹 Volatility/Volume (GKD-V) - Volatility/Volume indicators are used to measure the amount of buying and selling activity in a market. They are based on the trading Volatility/Volume of the market, and can provide information about the strength of the trend. In the GKD trading system, Volatility/Volume indicators are used to confirm trading signals generated by the various other GKD indicators. In the GKD trading system, Volatility is a proxy for Volume and vice versa.
Volatility/Volume indicators reduce the risk of false signals and improve the overall profitability of trades. These indicators can provide additional information about the market that is not captured by GKD-C confirmation and GKD-B baseline indicators.
🔹 Exit (GKD-E) - The exit indicator in the GKD system is an indicator that is deemed effective at identifying optimal exit points. The purpose of the exit indicator is to identify when a trend is likely to reverse or when the market conditions have changed, signaling the need to exit a trade. By using an exit indicator, traders can manage their risk and prevent significant losses.
🔹 Backtest (GKD-BT) - The GKD-BT backtest indicators link all other GKD-C, GKD-B, GKD-E, GKD-V, and GKD-M components together to create a GKD trading system. GKD-BT backtests generate signals (see the section “GKD Trading System Signals” below) from the confluence of various GKD indicators that are imported into the GKD-BT backtest. Backtest types include: GKD-BT solo and full GKD backtest strategies used for a single ticker; GKD-BT optimizers used to optimize a single indicator or the full GKD trading system; GKD-BT Multi-ticker used to backtest a single indicator or the full GKD trading system across up to ten tickers; GKD-BT exotic backtests like CC, Baseline, and Giga Stacks used to test confluence between GKD components to then be injected into a core GKD-BT Multi-ticker backtest or single ticker strategy.
🔹 Metamorphosis (GKD-M)** - The concept of a metamorphosis indicator involves the integration of two or more GKD indicators to generate a compound signal. This is achieved by evaluating the accuracy of each indicator and selecting the signal from the indicator with the highest accuracy. As an illustration, let's consider a scenario where we calculate the accuracy of 10 indicators and choose the signal from the indicator that demonstrates the highest accuracy.
The resulting output from the metamorphosis indicator can then be utilized in a GKD-BT backtest by occupying a slot that aligns with the purpose of the metamorphosis indicator. The slot can be a GKD-B, GKD-C, GKD-E, or GKD-V slot, depending on the specific requirements and objectives of the indicator. This allows for seamless integration and utilization of the compound signal within the GKD-BT framework.
*(see the section “GKD Trading System Signals” below)
**(not a required component of the GKD algorithm)
🔶 What does the application of the GKD trading system look like?
Example trading system:
Volatility: Average True Range (ATR) (selectable in all backtests and other related GKD indicators)
GKD-B Baseline: GKD-B Multi-Ticker Baseline using Hull Moving Average
GKD-C Confirmation 1: GKD-C Advance Trend Pressure
GKD-C Confirmation 2: GKD-C Dorsey Inertia
GKD-C Continuation: GKD-C Stochastic of RSX
GKD-V Volatility/Volume: GKD-V Damiani Volatmeter
GKD-E Exit: GKD-E MFI
GKD-BT Backtest: GKD-BT Multi-Ticker Full GKD Backtest
GKD-M Metamorphosis: GKD-M Baseline Optimizer
**all indicators mentioned above are included in the same AlgxTrading package**
Each module is passed to a GKD-BT backtest module. In the backtest module, all components are combined to formulate trading signals and statistical output. This chaining of indicators requires that each module conform to AlgxTrading's GKD protocol, therefore allowing for the testing of every possible combination of technical indicators that make up the various indictor types in the GKD algorithm.
🔶 GKD Trading System Signals
🔹 Standard Entry requires a sequence of conditions including a confirmation signal from GKD-C, baseline agreement, price criteria related to the Goldie Locks Zone, and concurrence from a second confirmation and volatility/volume indicators.
🔹 1-Candle Standard Entry introduces a two-phase process where initial conditions must be met, followed by a retraction in price and additional confirmations in the subsequent candle, including baseline, confirmations 1 and 2, and volatility/volume criteria.
🔹 Baseline Entry focuses on signals generated by the GKD-B Baseline, requiring agreement from confirmation signals, specific price conditions within the Goldie Locks Zone, and a timing condition related to the confirmation 1 signal.
🔹 1-Candle Baseline Entry mirrors the baseline entry but adds a requirement for a price retraction and subsequent confirmations in the following candle, maintaining the focus on the baseline's guidance.
🔹 Volatility/Volume Entry is predicated on signals from volatility/volume indicators, requiring support from confirmations, price criteria within the Goldie Locks Zone, baseline agreement, and a timing condition for the confirmation 1 signal.
🔹 1-Candle Volatility/Volume Entry adapts the volatility/volume entry to include a phase of initial signal and agreement, followed by a retracement phase that seeks further agreement from the system's components in the subsequent candle.
🔹 Confirmation 2 Entry is based on the second confirmation signal, requiring the first confirmation's agreement, specific price criteria, agreement from volatility/volume indicators, and baseline, with a timing condition for the confirmation 1 signal.
🔹 1-Candle Confirmation 2 Entry adds a retracement requirement to the confirmation 2 entry, necessitating additional agreements from the system's components in the candle following the signal.
🔹 PullBack Entry initiates with a baseline signal and agreement from the first confirmation, with a price condition related to volatility. It then looks for price to return within the Goldie Locks Zone and seeks further agreement from the system's components in the subsequent candle.
🔹 Continuation Entry allows for the continuation of an active position, based on a previously triggered entry strategy. It requires that the baseline hasn't crossed since the initial trigger, alongside ongoing agreements from confirmations and the baseline.
█ GKD-C Wavelet Oscillator, a deep dive
Now that you have a basic understanding of the GKD trading system. let's dive deeper into the features included in the GKD-C Wavelet Oscillator
🔶 GKD-C Wavelet Oscillator Modes aka "Confirmation Type"
The GKD-C Wavelet Oscillator has 4 modes: Confirmation for confirmation 1 and 2; Continuation; Multi-ticker for multi-ticker confirmation 1 and 2; and Optimizer.
🔹 Confirmation: When in this mode, the GKD-C Wavelet Oscillator generates confirmation 1 and 2 signals. These values can then be exported to a GKD-BT backtest strategy.
Signal Key: L = Long, S = Short
GKD-C Wavelet Oscillator in Confirmation mode
Confirmation Exports
GKD-C Wavelet Oscillator in attached to a GKD-BT backtest strategy
**the backtest data rendered to the chart above uses $5 commission per trade and 10% equity per trade with $1 million initial capital. Each backtest result for each ticker assumes these same inputs. The results are NOT cumulative, they are separate and isolated per ticker and trading side, long or short**
🔹 Continuation: When in this mode, the GKD-C Wavelet Oscillator generates continuation signals.
Signal Key: L = Long, S = Short, CL = Continuation Long, CS = Continuation Short
GKD-C Wavelet Oscillator in Continuation mode
Continuation Exports
🔹 Multi-ticker: When in this mode, the GKD-C Wavelet Oscillator generates multi-ticker confirmation 1 and 2. This mode allows users to generate confirmation 1 and 2, and continuation signals for up to 10 different tickers. These values can then be exported to a GKD-BT Multi-ticker backtest.
Signal Key: L = Long, S = Short
GKD-C Wavelet Oscillator in Multi-ticker mode
Multi-ticker Exports
GKD-C Wavelet Oscillator attached to the GKD-BT Multi-ticker SCS Backtest
**the backtest data rendered to the chart above uses $5 commission per trade and 10% equity per trade with $1 million initial capital. Each backtest result for each ticker assumes these same inputs. The results are NOT cumulative, they are separate and isolated per ticker and trading side, long or short**
🔹 Optimizer: When in this mode, the GKD-C Wavelet Oscillator generates optimization signals. These signals allow the user to backtest a range of input values. These values are exported to a GKD-BT optimizer backtest.
Signal Key: L = Long, S = Short
GKD-C Wavelet Oscillator in Optimizer mode
Optimizer Inputs and Exports
GKD-C Wavelet Oscillator attacked to the GKD-BT Optimizer SCS Backtest
**the backtest data rendered to the chart above uses $5 commission per trade and 10% equity per trade with $1 million initial capital. Each backtest result for each ticker assumes these same inputs. The results are NOT cumulative, they are separate and isolated per ticker and trading side, long or short**
█ Conclusion
The GKD-C Wavelet Oscillator serves as a multi-modal component of the GKD trading system allowing traders to optimize and backtest acorss a range of input parameters and tickers. These features decrease total build time required to create a custom GKD algorithmic trading system by allowing users to spend more time trading and less time guessing.
█ How to Access
You can see the Author's Instructions below to learn how to get access.

Atlas Trend Multi Flow OscilattorThe Atlas Trend Multi Flow Oscillator is a powerful custom indicator designed to combine multiple key financial metrics—volume flow, money flow, and momentum—into a single, easy-to-read oscillatory output. This indicator helps traders better understand market dynamics by presenting a more comprehensive picture of price movements, market sentiment, and potential reversals.
Key Components:
Volume Flow: This is calculated by comparing the current price (hlcc4) to the VWAP (Volume Weighted Average Price). It helps track how volume relates to price changes.
Money Flow: The money flow multiplier is based on the highs and lows of a given period, giving insight into whether the market is experiencing buying or selling pressure.
Momentum: By averaging the price deviation from its mean, the momentum component measures the rate of price change, helping to identify trends.
Combining Factors: The three components are averaged to create the flow momentum, which is normalized and constrained between a specified upper and lower limit (-500 to 500) for better readability.
Visual Interpretation: The indicator visually signals upward or downward market shifts by changing color based on whether the current value exceeds the previous one (green for up, red for down). Additionally, bands (upper and lower) give traders a visual guide for potential overbought or oversold conditions.
How to Use:
Overbought/Oversold Levels: The indicator uses a range of -500 to 500, with additional bands drawn at 400 and -400, which can be used as potential reversal zones.
Momentum Shifts: Pay attention to color changes, as they suggest shifts in momentum. Green signals rising momentum, while red indicates declining momentum.
Zero Line: Crossing the zero line can signal a trend change, making it a valuable confirmation tool for trading decisions.
This oscillator provides a blend of volume, price action, and momentum, making it suitable for traders who want to capture both trend and reversal signals in various market conditions.

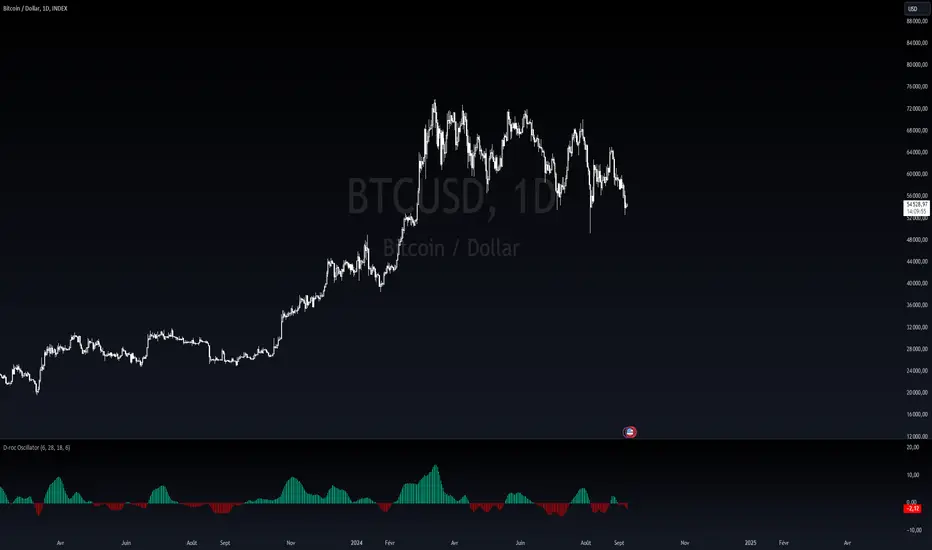
Dynamic Rate of Change OscillatorDynamic Rate of Change (RoC) Oscillator with Color-Coded Histogram
Detailed Description for Publication
The Dynamic Rate of Change (RoC) Oscillator with Color-Coded Histogram is a sophisticated technical analysis tool designed to enhance your understanding of market momentum. Created using Pine Script v5 on the TradingView platform, this indicator integrates multiple Rate of Change (RoC) calculations into a unified momentum oscillator. The resulting data is displayed as a color-coded histogram, providing a clear visual representation of momentum changes.
Key Features and Functionality
Multi-Length RoC Calculation:
Short-term RoC: Calculated over a user-defined period (shortRoCLength), this captures variations in price momentum over a shorter duration, offering insights into the immediate price action.
Long-term RoC: This uses a longer period (longRoCLength) to provide a broader view of momentum, helping to smooth out short-term fluctuations and highlight more established trends.
Mid-term RoC: A weighted average of the short-term and long-term RoCs, the mid-term RoC (midRoCWeight) allows you to balance sensitivity and stability in the oscillator's behavior.
Weighted RoC Calculation:
The indicator calculates a single weighted average RoC by integrating short-term, long-term, and mid-term RoCs. The weighting factor can be adjusted to prioritize different market dynamics according to the trader’s strategy. This flexible approach enables the oscillator to remain applicable across diverse market conditions.
Oscillator Calculation and Smoothing:
The oscillator value is computed by subtracting a 14-period Weighted Moving Average (WMA) from the weighted RoC, which helps to normalize the oscillator, making it more responsive to changes in momentum.
The oscillator is then smoothed using a Simple Moving Average (SMA) over a user-defined period (smoothLength). This process reduces market noise, making the oscillator's signals clearer and easier to interpret.
Color-Coded Histogram:
The smoothed oscillator is displayed as a histogram, which is color-coded to reflect bullish or bearish momentum. You can customize the colors to match your charting style, with green typically representing upward momentum and red representing downward momentum.
The color-coded histogram allows for quick visual identification of momentum changes on the chart, aiding in your market analysis.
Zero-Line Reference:
A horizontal line at the zero level is plotted as a reference point. This zero-line helps in identifying when the histogram shifts from positive to negative or vice versa, which can be useful in understanding momentum shifts.
The zero-line offers a straightforward visual cue, making it easier to interpret the oscillator's signals in relation to market movements.
Customization and Versatility
The Dynamic RoC Oscillator with Histogram is designed with flexibility in mind, making it suitable for a wide range of trading styles, from short-term trading to longer-term analysis. Users have the ability to fine-tune the indicator’s input parameters to align with their specific needs:
Adjustable RoC Periods: Customize the short-term and long-term RoC lengths to match the timeframes you focus on.
Weighted Sensitivity: Adjust the mid-term RoC weight to emphasize different aspects of momentum according to your analysis approach.
Smoothing Options: Modify the smoothing moving average length to control the sensitivity of the oscillator, allowing you to balance responsiveness with noise reduction.
Use Cases
Momentum Analysis: Gain a clearer understanding of momentum changes within the market, which can aid in the evaluation of market trends.
Trend Analysis: The oscillator can help in assessing trends by highlighting when momentum is increasing or decreasing.
Chart Visualization: The color-coded histogram provides a visually intuitive method for monitoring momentum, helping you to more easily interpret market behavior.
Conclusion
The Dynamic Rate of Change (RoC) Oscillator with Color-Coded Histogram is a versatile and powerful tool for traders who seek a deeper analysis of market momentum. With its dynamic calculation methods and high degree of customization, this indicator can be tailored to suit a variety of trading strategies. By integrating it into your TradingView charts, you can enhance your technical analysis capabilities, gaining valuable insights into market momentum.
This indicator is easy to use and highly customizable, making it a valuable addition to any trader’s toolkit. Add it to your charts on the TradingView platform and start exploring its potential to enrich your market analysis.
Cumulative Net Money FlowDescription:
Dive into the financial depth of the markets with the "Cumulative Net Money Flow" indicator, designed to provide a comprehensive view of the monetary dynamics in trading. This tool is invaluable for traders and investors seeking to quantify the actual money entering or exiting the market over a specified period.
Features:
Value-Weighted Calculations: This indicator multiplies the trading volume by the price, offering a money flow perspective rather than just counting shares or contracts.
Custom Timeframe Adaptability: Adjust the timeframe to match your trading strategy, whether you are day trading, swing trading, or looking for longer-term trends.
Cumulative Insight: Tracks and accumulates net money flow to highlight overall market sentiment, making it easier to spot trends in capital movement.
Color-Coded Visualization: Displays positive money flow in green and negative money flow in red, providing clear, visual cues about market conditions.
Utility: "Cumulative Net Money Flow" is particularly effective in revealing the strength behind market movements. By understanding whether the money flow is predominantly buying or selling, traders can better align their strategies with market sentiment. This indicator is suited for various asset classes, including stocks, cryptocurrencies, and forex.

Uptrick: DPO Signal & Zone Indicator
## **Uptrick: DPO Signal & Zone Indicator**
### **Introduction:**
The **Uptrick: DPO Signal & Zone Indicator** is a sophisticated technical analysis tool tailored to provide insights into market momentum, identify potential trading signals, and recognize extreme market conditions. It leverages the Detrended Price Oscillator (DPO) to strip out long-term trends from price movements, allowing traders to focus on short-term fluctuations and cyclical behavior. The indicator integrates multiple components, including a Detrended Price Oscillator, a Signal Line, a Histogram, and customizable alert levels, to deliver a robust framework for market analysis and trading decision-making.
### **Detailed Breakdown:**
#### **1. Detrended Price Oscillator (DPO):**
- **Purpose and Functionality:**
- The DPO is designed to filter out long-term trends from the price data, isolating short-term price movements. This helps in understanding the cyclical patterns and momentum of an asset, allowing traders to detect periods of acceleration or deceleration that might be overlooked when focusing solely on long-term trends.
- **Calculation:**
- **Formula:** `dpo = close - ta.sma(close, smaLength)`
- **`close`:** The asset’s closing price for each period in the dataset.
- **`ta.sma(close, smaLength)`:** The Simple Moving Average (SMA) of the closing prices over a period defined by `smaLength`.
- The DPO is derived by subtracting the SMA value from the current closing price. This calculation reveals how much the current price deviates from the moving average, effectively detrending the price data.
- **Interpretation:**
- **Positive DPO Values:** Indicate that the current price is higher than the moving average, suggesting bullish market conditions and a potential upward trend.
- **Negative DPO Values:** Indicate that the current price is lower than the moving average, suggesting bearish market conditions and a potential downward trend.
- **Magnitude of DPO:** Reflects the strength of momentum. Larger positive or negative values suggest stronger momentum in the respective direction.
#### **2. Signal Line:**
- **Purpose and Functionality:**
- The Signal Line is a smoothed average of the DPO, intended to act as a reference point for generating trading signals. It helps to filter out short-term fluctuations and provides a clearer perspective on the prevailing trend.
- **Calculation:**
- **Formula:** `signalLine = ta.sma(dpo, signalLength)`
- **`ta.sma(dpo, signalLength)`:** The SMA of the DPO values over a period defined by `signalLength`.
- The Signal Line is calculated by applying a moving average to the DPO values. This smoothing process reduces noise and highlights the underlying trend direction.
- **Interpretation:**
- **DPO Crossing Above Signal Line:** Generates a buy signal, suggesting that short-term momentum is turning bullish relative to the longer-term trend.
- **DPO Crossing Below Signal Line:** Generates a sell signal, suggesting that short-term momentum is turning bearish relative to the longer-term trend.
- **Signal Line’s Role:** Provides a benchmark for assessing the strength of the DPO. The interaction between the DPO and the Signal Line offers actionable insights into potential entry or exit points.
#### **3. Histogram:**
- **Purpose and Functionality:**
- The Histogram visualizes the difference between the DPO and the Signal Line. It provides a graphical representation of momentum strength and direction, allowing traders to quickly gauge market conditions.
- **Calculation:**
- **Formula:** `histogram = dpo - signalLine`
- The Histogram is computed by subtracting the Signal Line value from the DPO value. Positive values indicate that the DPO is above the Signal Line, while negative values indicate that the DPO is below the Signal Line.
- **Interpretation:**
- **Color Coding:**
- **Green Bars:** Represent positive values, indicating bullish momentum.
- **Red Bars:** Represent negative values, indicating bearish momentum.
- **Width of Bars:** Indicates the strength of momentum. Wider bars signify stronger momentum, while narrower bars suggest weaker momentum.
- **Zero Line:** A horizontal gray line that separates positive and negative histogram values. Crosses of the histogram through this zero line can signal shifts in momentum direction.
#### **4. Alert Levels:**
- **Purpose and Functionality:**
- Alert levels define specific thresholds to identify extreme market conditions, such as overbought and oversold states. These levels help traders recognize potential reversal points and extreme market conditions.
- **Inputs:**
- **`alertLevel1`:** Defines the upper threshold for identifying overbought conditions.
- **Default Value:** 0.5
- **`alertLevel2`:** Defines the lower threshold for identifying oversold conditions.
- **Default Value:** -0.5
- **Interpretation:**
- **Overbought Condition:** When the DPO exceeds `alertLevel1`, indicating that the market may be overbought. This condition suggests that the asset could be due for a correction or reversal.
- **Oversold Condition:** When the DPO falls below `alertLevel2`, indicating that the market may be oversold. This condition suggests that the asset could be poised for a rebound or reversal.
#### **5. Visual Elements:**
- **DPO and Signal Line Plots:**
- **DPO Plot:**
- **Color:** Blue
- **Width:** 2 pixels
- **Purpose:** To visually represent the deviation of the current price from the moving average.
- **Signal Line Plot:**
- **Color:** Red
- **Width:** 1 pixel
- **Purpose:** To provide a smoothed reference for the DPO and generate trading signals.
- **Histogram Plot:**
- **Color Coding:**
- **Green:** For positive values, signaling bullish momentum.
- **Red:** For negative values, signaling bearish momentum.
- **Style:** Histogram bars are displayed with varying width to represent the strength of momentum.
- **Zero Line:** A gray horizontal line separating positive and negative histogram values.
- **Overbought/Oversold Zones:**
- **Background Colors:**
- **Green Shading:** Applied when the DPO exceeds `alertLevel1`, indicating an overbought condition.
- **Red Shading:** Applied when the DPO falls below `alertLevel2`, indicating an oversold condition.
- **Horizontal Lines:**
- **Dotted Green Line:** At `alertLevel1`, marking the upper alert threshold.
- **Dotted Red Line:** At `alertLevel2`, marking the lower alert threshold.
- **Purpose:** To provide clear visual cues for extreme market conditions, aiding in the identification of potential reversal points.
#### **6. Trading Signals and Alerts:**
- **Buy Signal:**
- **Trigger:** When the DPO crosses above the Signal Line.
- **Visual Representation:** A "BUY" label appears below the price bar in the specified buy color.
- **Purpose:** Indicates a potential buying opportunity as short-term momentum turns bullish.
- **Sell Signal:**
- **Trigger:** When the DPO crosses below the Signal Line.
- **Visual Representation:** A "SELL" label appears above the price bar in the specified sell color.
- **Purpose:** Indicates a potential selling opportunity as short-term momentum turns bearish.
- **Overbought/Oversold Alerts:**
- **Overbought Alert:** Triggered when the DPO crosses below `alertLevel1`.
- **Oversold Alert:** Triggered when the DPO crosses above `alertLevel2`.
- **Visual Representation:** Labels "OVERBOUGHT" and "OVERSOLD" appear with distinctive colors and sizes to highlight extreme conditions.
- **Purpose:** To signal potential reversal points and extreme market conditions that may lead to price corrections or trend reversals.
- **Alert Conditions:**
- **DPO Cross Above Signal Line:** Alerts traders when the DPO crosses above the Signal Line, generating a buy signal.
- **DPO Cross Below Signal Line:** Alerts traders when the DPO crosses below the Signal Line, generating a sell signal.
- **DPO Above Upper Alert Level:** Alerts when the DPO is above `alertLevel1`, indicating an overbought condition.
- **DPO Below Lower Alert Level:** Alerts when the DPO is below `alertLevel2`, indicating an oversold condition.
- **Purpose:** To provide real-time notifications of significant market events, enabling traders to make informed decisions promptly.
### **Practical Applications:**
#### **1. Trend Following Strategies:**
- **Objective:**
- To capture and ride the prevailing market trends by entering trades that align with the direction of the momentum.
- **How to Use:**
- Monitor buy and sell signals generated by the DPO crossing the Signal Line. A buy signal suggests a bullish trend and a potential long trade, while a sell signal suggests a bearish trend and a potential short trade.
- Use the Histogram to confirm the strength of the trend. Expanding green bars indicate strong bullish momentum, while expanding red bars indicate strong bearish momentum.
- **Advantages:**
- Helps traders stay aligned with the market trend, increasing the likelihood of capturing substantial price moves.
#### **2. Reversal Trading:**
- **Objective:**
- To identify potential market reversals
by detecting overbought and oversold conditions.
- **How to Use:**
- Look for overbought and oversold signals based on the DPO crossing `alertLevel1` and `alertLevel2`. These conditions suggest that the market may be due for a reversal.
- Confirm reversal signals with the Histogram. A decrease in histogram bars (from green to red or vice versa) may support the reversal hypothesis.
- **Advantages:**
- Provides early warnings of potential market reversals, allowing traders to position themselves before significant price changes occur.
#### **3. Momentum Analysis:**
- **Objective:**
- To gauge the strength and direction of market momentum for making informed trading decisions.
- **How to Use:**
- Analyze the Histogram to assess momentum strength. Positive and expanding histogram bars indicate increasing bullish momentum, while negative and expanding bars suggest increasing bearish momentum.
- Use momentum insights to validate or question existing trading positions and strategies.
- **Advantages:**
- Offers valuable information about the market's momentum, helping traders confirm the validity of trends and trading signals.
### **Customization and Flexibility:**
The **Uptrick: DPO Signal & Zone Indicator** offers extensive customization options to accommodate diverse trading preferences and market conditions:
- **SMA Length and Signal Line Length:**
- Adjust the `smaLength` and `signalLength` parameters to control the sensitivity and responsiveness of the DPO and Signal Line. Shorter lengths make the indicator more responsive to price changes, while longer lengths provide smoother, less volatile signals.
- **Alert Levels:**
- Modify `alertLevel1` and `alertLevel2` to fit varying market conditions and volatility. Setting these levels appropriately helps tailor the indicator to different asset classes and trading strategies.
- **Color and Shape Customization:**
- Customize the colors and sizes of buy/sell signals, histogram bars, and alert levels to enhance visual clarity and align with personal preferences. This customization helps ensure that the indicator integrates seamlessly with a trader's charting setup.
### **Conclusion:**
The **Uptrick: DPO Signal & Zone Indicator** is a multifaceted analytical tool that combines the power of the Detrended Price Oscillator with customizable visual elements and alert levels to deliver a comprehensive approach to market analysis. By offering insights into momentum strength, trend direction, and potential reversal points, this indicator equips traders with valuable information to make informed decisions and enhance their trading strategies. Its flexibility and customization options ensure that it can be adapted to various trading styles and market conditions, making it a versatile addition to any trader's toolkit.

Xtrender and TSI FusionXtrender and TSI Fusion Indicator
I created this indicator for myself. I was inspired by the indicators created by Bjorgum, Duyck and QuantTherapy and decided to create multiple indicators that either work well combined with their indicators or something new that applies some of their indicator concepts. I decided to share all of the indicator I have created because I believe in learning and earing together as a community. If you guys have any questions or suggestions write them.
Overview: The Xtrender and TSI Fusion Indicator is a powerful tool designed to help traders analyze market momentum, trends, and potential reversals. By combining Xtrender with the True Strength Index (TSI), this indicator provides a comprehensive view of market dynamics, making it easier to identify trading opportunities.
Image: Timeframe is set to daily
Features:
1.Xtrender Analysis:
Short-Term Xtrender: Visualizes short-term momentum using RSI-based calculations on EMA differences. This helps in identifying immediate market trends and pullbacks.
Image above: showcases Short-Term Xtrender
Xtrender T3: A smoothed version of the Xtrender that reduces noise and highlights significant trend changes.
Image above: showcases Xtrender T3 with Xtrender T3 color
2.TSI (True Strength Index):
TSI Value: Measures momentum by comparing price changes over two time periods, offering a clear view of trend strength.
TSI Signal Line: A smoothed version of the TSI value, used to generate buy and sell signals when crossed by the TSI.
Image: showcases TSI Value with TSI Signal Line
TSI Histogram: Shows the difference between the TSI and its signal line, highlighting potential reversals and trend continuations.
Image: showcases TSI Histogram
3.Color Coding and Visual Cues:
Trend Colors: The indicator uses dynamic colors to represent bullish or bearish conditions, making it easy to interpret market sentiment.
Background Color : The background changes color based on TSI signals, further aiding in visual trend analysis.
Image: showcases Background color and Zero line
How to Use
1.Xtrender Analysis:
Short-Term Xtrender: The short-term Xtrender is plotted as columns, changing color based on its direction and value. Green or lime indicates positive momentum, while red or maroon indicates negative momentum.
Xtrender T3: The Xtrender T3 line (black) represents a smoothed version of the short-term Xtrender, providing a clearer picture of the overall trend. The color of this line changes based on the Xtrender's value, helping you spot potential trend changes.
2.TSI (True Strength Index):
TSI Value and Signal Line: The TSI value is plotted as a line, with its color changing based on its relationship to the signal line. A crossover of the TSI above the signal line suggests a potential bullish move, while a crossover below indicates a bearish trend.
TSI Histogram: The histogram represents the difference between the TSI and its signal line. Positive values indicate bullish momentum, while negative values suggest bearish momentum.
3.Background Color:
The background color changes based on the TSI signal, with a greenish hue indicating bullish conditions and a reddish hue indicating bearish conditions. This provides a quick visual reference for market sentiment.
4.Zero Line:
A horizontal gray dotted line at the zero level helps you easily identify when the Xtrender or TSI crosses into positive or negative territory, signaling potential trend shifts.
Image above: Timeframe on daily with the individual elements combined
Example of Use:
•Trend Confirmation: Use the Xtrender and Xtrender T3 to confirm the direction of the trend. If both are aligned with the same color and direction, it increases the probability of a strong trend.
•Momentum Reversals: Watch for TSI crosses and histogram shifts to identify potential reversals. For example, a TSI crossover above its signal line with a corresponding change in the histogram from negative to positive could signal a buying opportunity.
•Pullbacks: Identify pullbacks within a trend by observing temporary shifts in the short-term Xtrender or TSI histogram. Use these signals to enter trades in the direction of the overall trend.
Image above: Showcases, Trend confirmation, reversal and pullbacks on daily timeframe.
Customization:
•TSI Speed: Choose between "Fast" and "Slow" TSI settings based on your trading style. Fast settings are more responsive to price changes, while slow settings offer smoother signals.
•Color Settings: Customize the colors for bullish, bearish, and neutral TSI conditions to match your personal preferences or chart theme.
This indicator is versatile and can be used for various trading strategies, from trend following to momentum trading, making it a valuable tool in any trader's arsenal.
My Scripts/Indicators/Ideas /Systems that I share are only for educational purposes

Uptrick: SMA Pivot Marker### Uptrick: SMA Pivot Marker (SPM) — Extensive Guide
#### Introduction
The **Uptrick: SMA Pivot Marker (SPM)** is a sophisticated technical analysis tool crafted by Uptrick to help traders interpret market trends and identify key price levels where significant reversals might occur. By integrating the principles of the Simple Moving Average (SMA) with pivot point analysis, the SPM offers a comprehensive approach to understanding market dynamics. This extensive guide explores the purpose, functionality, and practical applications of the SPM, providing an in-depth analysis of its features, settings, and usage across various trading strategies.
#### Purpose of the SPM
The **SMA Pivot Marker (SPM)** aims to enhance trading strategies by offering a dual approach to market analysis:
1. **Trend Identification**:
- **Objective**: To discern the prevailing market direction and guide trading decisions based on the overall trend.
- **Method**: Utilizes the SMA to smooth out price fluctuations, providing a clearer picture of the trend. This helps traders align their trades with the market's direction, increasing the probability of successful trades.
2. **Pivot Point Detection**:
- **Objective**: To identify key levels where the price is likely to reverse, providing potential support and resistance zones.
- **Method**: Calculates and marks pivot highs and lows, which are significant price points where previous trends have reversed. These levels are used to predict future price movements and establish trading strategies.
3. **Trend Change Alerts**:
- **Objective**: To notify traders of potential shifts in market direction, enabling timely adjustments to trading positions.
- **Method**: Detects and highlights crossover and crossunder points of the smoothed line, indicating possible trend changes. This helps traders react promptly to changing market conditions.
#### Detailed Functionality
1. **Smoothing Line Calculation**:
- **Simple Moving Average (SMA)**:
- **Definition**: The SMA is a type of moving average that calculates the average of a security’s price over a specified number of periods. It smooths out price data to filter out short-term fluctuations and highlight the longer-term trend.
- **Calculation**: The SMA is computed by summing the closing prices of the chosen number of periods and then dividing by the number of periods. For example, a 20-period SMA adds the closing prices for the past 20 periods and divides by 20.
- **Purpose**: The SMA helps in identifying the direction of the trend. A rising SMA indicates an uptrend, while a falling SMA indicates a downtrend. This smoothing helps traders to avoid being misled by short-term price noise.
2. **Pivot Points Calculation**:
- **Pivot Highs and Lows**:
- **Definition**: Pivot points are significant price levels where a market trend is likely to reverse. A pivot high is the highest price over a certain period, surrounded by lower prices on both sides, while a pivot low is the lowest price surrounded by higher prices.
- **Calculation**: The SPM calculates pivot points based on a user-defined lookback period. For instance, if the lookback period is set to 3, the indicator will find the highest and lowest prices within the past 3 periods and mark these points.
- **Purpose**: Pivot points are used to identify potential support and resistance levels. Traders often use these levels to set entry and exit points, stop-loss orders, and to gauge market sentiment.
3. **Visualization**:
- **Smoothed Line Plot**:
- **Description**: The smoothed line, calculated using the SMA, is plotted on the chart to provide a visual representation of the trend. This line adjusts its color based on the trend direction, helping traders quickly assess the market condition.
- **Color Coding**: The smoothed line is colored green (upColor) when it is rising, indicating a bullish trend, and red (downColor) when it is falling, indicating a bearish trend. This color-coding helps traders visually differentiate between uptrends and downtrends.
- **Line Width**: The width of the line can be adjusted to improve visibility. A thicker line may be more noticeable, while a thinner line might provide a cleaner look on the chart.
- **Pivot Markers**:
- **Description**: Pivot highs and lows are marked on the chart with lines and labels. These markers help in visually identifying significant price levels.
- **Color and Labels**: Pivot highs are represented with green lines and labels ("H"), while pivot lows are marked with red lines and labels ("L"). This color scheme and labeling make it easy to distinguish between resistance (highs) and support (lows).
4. **Trend Change Detection**:
- **Trend Up**:
- **Detection**: The indicator identifies an upward trend change when the smoothed line crosses above its previous value. This crossover suggests a potential shift from a downtrend to an uptrend.
- **Usage**: Traders can interpret this signal as a potential buying opportunity or an indication to review and possibly adjust their trading positions to align with the new uptrend.
- **Trend Down**:
- **Detection**: A downward trend change is detected when the smoothed line crosses below its previous value. This crossunder indicates a potential shift from an uptrend to a downtrend.
- **Usage**: This signal can be used to consider selling opportunities or to reassess long positions in light of the emerging downtrend.
#### User Inputs
1. **Smoothing Period**:
- **Description**: This input determines the number of periods over which the SMA is calculated. It directly affects the smoothness of the line and the sensitivity of trend detection.
- **Range**: The smoothing period can be set to any integer value greater than or equal to 1. There is no specified upper limit, offering flexibility for various trading styles.
- **Default Value**: The default smoothing period is 20, which is a common choice for medium-term trend analysis.
- **Impact**: A longer smoothing period results in a smoother line, filtering out more noise and highlighting long-term trends. A shorter period makes the line more responsive to recent price changes, which can be useful for short-term trading strategies.
2. **Pivot Lookback**:
- **Description**: This input specifies the number of periods used to calculate the pivot highs and lows. It influences the sensitivity of pivot point detection and the relevance of the identified levels.
- **Range**: The pivot lookback period can be set to any integer value greater than or equal to 1, with no upper limit. Traders can adjust this parameter based on their trading timeframe and preferences.
- **Default Value**: The default lookback period is 3, which provides a balance between detecting significant pivots and avoiding excessive noise.
- **Impact**: A longer lookback period generates more stable pivot points, suitable for identifying long-term support and resistance levels. A shorter lookback period results in more frequent and recent pivot points, useful for intraday trading and quick responses to price changes.
#### Applications for Different Traders
1. **Trend Followers**:
- **Using the SMA**: Trend followers utilize the smoothed line to gauge the direction of the market. By aligning trades with the direction of the SMA, traders can capitalize on sustained trends and improve their chances of success.
- **Trend Change Alerts**: The trend change markers alert trend followers to potential shifts in market direction. These alerts help traders make timely decisions to enter or exit positions, ensuring they stay aligned with the prevailing trend.
2. **Reversal Traders**:
- **Pivot Points**: Reversal traders focus on pivot highs and lows to identify potential reversal points in the market. These points indicate where the market has previously reversed direction, providing potential entry and exit levels for trades.
- **Pivot Markers**: The visual markers for pivot highs and lows serve as clear signals for reversal traders. By monitoring these levels, traders can anticipate price reversals and plan their trades to exploit these opportunities.
3. **Swing Traders**:
- **Combining SMA and Pivot Points**: Swing traders can use the combination of the smoothed line and pivot points to identify medium-term trading opportunities. The smoothed line helps in understanding the broader trend, while pivot points provide specific levels for potential swings.
- **Trend Change Alerts**: Trend change markers help swing traders spot new swing opportunities as the market shifts direction. These markers provide potential entry points for swing trades and help traders adjust their strategies to capitalize on market movements.
4. **Scalpers**:
- **Short-Term Analysis**: Scalpers benefit from the short-term signals provided by the SPM. The smoothed line and pivot points offer insights into rapid price movements, while the trend change markers highlight quick trading opportunities.
- **Pivot Points**: For scalpers, pivot points are particularly useful in identifying key levels where price may reverse within a short time frame. By focusing on these levels, scalpers can plan trades with tight stop-loss orders and capitalize on quick price changes.
#### Implementation and Best Practices
1. **Setting Parameters**:
- **Smoothing Period**: Adjust the smoothing period according to your trading strategy and market conditions. For long-term analysis, use a longer period to filter out noise and highlight broader trends. For short-term trading, a shorter period provides more immediate insights into price movements.
- **Pivot Lookback**: Choose a lookback period that matches your trading timeframe. For intraday trading, a shorter lookback period offers quick identification of recent price levels. For swing trading or long-term strategies, a longer lookback period provides more stable pivot points.
2. **Combining with Other Indicators**:
- **Integration with Technical Tools**: The SPM can be used in conjunction with other technical indicators to enhance trading decisions. For instance, combining the
SPM with indicators like RSI (Relative Strength Index) or MACD (Moving Average Convergence Divergence) can provide additional confirmation for trend signals and pivot points.
- **Support and Resistance**: Integrate the SPM’s pivot points with other support and resistance levels to gain a comprehensive view of market conditions. This combined approach helps in identifying stronger levels of support and resistance, improving trade accuracy.
3. **Backtesting**:
- **Historical Performance**: Conduct backtesting with historical data to evaluate the effectiveness of the SPM. Analyze past performance to fine-tune the smoothing period and pivot lookback settings, ensuring they align with your trading style and market conditions.
- **Scenario Analysis**: Test the SPM under various market scenarios to understand its performance in different conditions. This analysis helps in assessing the reliability of the indicator and making necessary adjustments for diverse market environments.
4. **Customization**:
- **Visual Adjustments**: Customize the appearance of the smoothed line and pivot markers to enhance chart readability and match personal preferences. Clear visual representation of these elements improves the effectiveness of the indicator.
- **Alert Configuration**: Set up alerts for trend changes to receive timely notifications. Alerts help traders act quickly on potential market shifts without constant monitoring, allowing for more efficient trading decisions.
#### Conclusion
The **Uptrick: SMA Pivot Marker (SPM)** is a versatile and powerful technical analysis tool that combines the benefits of the Simple Moving Average with pivot point analysis. By providing insights into market trends, identifying key reversal points, and detecting trend changes, the SPM caters to a wide range of trading strategies, including trend following, reversal trading, swing trading, and scalping.
With its customizable inputs, visual markers, and trend change alerts, the SPM offers traders the flexibility to adapt the indicator to different market conditions and trading styles. Whether used independently or in conjunction with other technical tools, the SPM is designed to enhance trading decision-making and improve overall trading performance. By mastering the use of the SPM, traders can gain a valuable edge in navigating the complexities of financial markets and making more informed trading decisions.

Uptrick: Trend SMA Oscillator### In-Depth Analysis of the "Uptrick: Trend SMA Oscillator" Indicator
---
#### Introduction to the Indicator
The "Uptrick: Trend SMA Oscillator" is an advanced yet user-friendly technical analysis tool designed to help traders across all levels of experience identify and follow market trends with precision. This indicator builds upon the fundamental principles of the Simple Moving Average (SMA), a cornerstone of technical analysis, to deliver a clear, visually intuitive overlay on the price chart. Through its strategic use of color-coding and customizable parameters, the Uptrick: Trend SMA Oscillator provides traders with actionable insights into market dynamics, enhancing their ability to make informed trading decisions.
#### Core Concepts and Methodology
1. **Foundational Principle – Simple Moving Average (SMA):**
- The Simple Moving Average (SMA) is the heart of the Uptrick: Trend SMA Oscillator. The SMA is a widely-used technical indicator that calculates the average price of an asset over a specified number of periods. By smoothing out price data, the SMA helps to reduce the noise from short-term fluctuations, providing a clearer picture of the overall trend.
- In the Uptrick: Trend SMA Oscillator, two SMAs are employed:
- **Primary SMA (oscValue):** This is applied to the closing price of the asset over a user-defined period (default is 14 periods). This SMA tracks the price closely and is sensitive to changes in market direction.
- **Smoothing SMA (oscV):** This second SMA is applied to the primary SMA, further smoothing the data and helping to filter out minor price movements that might otherwise be mistaken for trend reversals. The default period for this smoothing is 50, but it can be adjusted to suit the trader's preference.
2. **Color-Coding for Trend Visualization:**
- One of the most distinctive features of this indicator is its use of color to represent market trends. The indicator’s line changes color based on the relationship between the primary SMA and the smoothing SMA:
- **Bullish (Green):** The line turns green when the primary SMA is equal to or greater than the smoothing SMA, indicating that the market is in an upward trend.
- **Bearish (Red):** Conversely, the line turns red when the primary SMA falls below the smoothing SMA, signaling a downward trend.
- This color-coded system provides traders with an immediate, easy-to-interpret visual cue about the market’s direction, allowing for quick decision-making.
#### Detailed Explanation of Inputs
1. **Bullish Color (Default: Green #00ff00):**
- This input allows traders to customize the color that represents bullish trends on the chart. The default setting is green, a color commonly associated with upward market movement. However, traders can adjust this to any color that suits their visual preferences or matches their overall chart theme.
2. **Bearish Color (Default: Red RGB: 245, 0, 0):**
- The bearish color input determines the color of the line when the market is trending downwards. The default setting is a vivid red, signaling caution or selling opportunities. Like the bullish color, this can be customized to fit the trader’s needs.
3. **Line Thickness (Default: 5):**
- This setting controls the thickness of the line plotted by the indicator. The default thickness of 5 makes the line prominent on the chart, ensuring that the trend is easily visible even in complex or crowded chart setups. Traders can adjust the thickness to make the line thinner or thicker, depending on their visual preferences.
4. **Primary SMA Period (Value 1 - Default: 14):**
- The primary SMA period defines how many periods (e.g., days, hours) are used to calculate the moving average based on the asset’s closing prices. The default period of 14 is a balanced setting that offers a good mix of responsiveness and stability, but traders can adjust this depending on their trading style:
- **Shorter Periods (e.g., 5-10):** These make the indicator more sensitive, capturing trends more quickly but also increasing the likelihood of reacting to short-term price fluctuations or "noise."
- **Longer Periods (e.g., 20-50):** These smooth the data more, providing a more stable trend line that is less prone to whipsaws but may be slower to respond to trend changes.
5. **Smoothing SMA Period (Value 2 - Default: 50):**
- The smoothing SMA period determines how much the primary SMA is smoothed. A longer smoothing period results in a more gradual, stable line that focuses on the broader trend. The default of 50 is designed to smooth out most of the short-term fluctuations while still being responsive enough to detect significant trend shifts.
- **Customization:**
- **Shorter Smoothing Periods (e.g., 20-30):** Make the indicator more responsive, better for fast-moving markets or for traders who want to capture quick trends.
- **Longer Smoothing Periods (e.g., 70-100):** Enhance stability, ideal for long-term traders looking to avoid reacting to minor price movements.
#### Unique Characteristics and Advantages
1. **Simplicity and Clarity:**
- The Uptrick: Trend SMA Oscillator’s design prioritizes simplicity without sacrificing effectiveness. By relying on the widely understood SMA, it avoids the complexity of more esoteric indicators while still providing reliable trend signals. This simplicity makes it accessible to traders of all levels, from novices who are just learning about technical analysis to experienced traders looking for a straightforward, dependable tool.
2. **Visual Feedback Mechanism:**
- The indicator’s use of color to signify market trends is a particularly powerful feature. This visual feedback mechanism allows traders to assess market conditions at a glance. The clarity of the green and red color scheme reduces the mental effort required to interpret the indicator, freeing the trader to focus on strategy execution.
3. **Adaptability Across Markets and Timeframes:**
- One of the strengths of the Uptrick: Trend SMA Oscillator is its versatility. The basic principles of moving averages apply equally well across different asset classes and timeframes. Whether trading stocks, forex, commodities, or cryptocurrencies, traders can use this indicator to gain insights into market trends.
- **Intraday Trading:** For day traders who operate on short timeframes (e.g., 1-minute, 5-minute charts), the oscillator can be adjusted to be more responsive, capturing quick shifts in momentum.
- **Swing Trading:** Swing traders, who typically hold positions for several days to weeks, will find the default settings or slightly adjusted periods ideal for identifying and riding medium-term trends.
- **Long-Term Trading:** Position traders and investors can adjust the indicator to focus on long-term trends by increasing the periods for both the primary and smoothing SMAs, filtering out minor fluctuations and highlighting sustained market movements.
4. **Minimal Lag:**
- One of the challenges with moving averages is lag—the delay between when the price changes and when the indicator reflects this change. The Uptrick: Trend SMA Oscillator addresses this by allowing traders to adjust the periods to find a balance between responsiveness and stability. While all SMAs inherently have some lag, the customizable nature of this indicator helps traders mitigate this effect to align with their specific trading goals.
5. **Customizable and Intuitive:**
- While many technical indicators come with a fixed set of parameters, the Uptrick: Trend SMA Oscillator is fully customizable, allowing traders to tailor it to their trading style, market conditions, and personal preferences. This makes it a highly flexible tool that can be adjusted as markets evolve or as a trader’s strategy changes over time.
#### Practical Applications for Different Trader Profiles
1. **Day Traders:**
- **Use Case:** Day traders can customize the SMA periods to create a faster, more responsive indicator. This allows them to capture short-term trends and make quick decisions. For example, reducing the primary SMA to 5 and the smoothing SMA to 20 can help day traders react promptly to intraday price movements.
- **Strategy Integration:** Day traders might use the Uptrick: Trend SMA Oscillator in conjunction with volume-based indicators to confirm the strength of a trend before entering or exiting trades.
2. **Swing Traders:**
- **Use Case:** Swing traders can use the default settings or slightly adjust them to smooth out minor price fluctuations while still capturing medium-term trends. This approach helps in identifying the optimal points to enter or exit trades based on the broader market direction.
- **Strategy Integration:** Swing traders can combine this indicator with oscillators like the Relative Strength Index (RSI) to confirm overbought or oversold conditions, thereby refining their entry and exit strategies.
3. **Position Traders:**
- **Use Case:** Position traders, who hold trades for extended periods, can extend the SMA periods to focus on long-term trends. By doing so, they minimize the impact of short-term market noise and focus on the underlying trend.
- **Strategy Integration:** Position traders might use the Uptrick: Trend SMA Oscillator in combination with fundamental analysis. The indicator can help confirm the timing of entries and exits based on broader economic or corporate developments.
4. **Algorithmic and Quantitative Traders:**
- **Use Case:** The simplicity and clear logic of the Uptrick: Trend SMA Oscillator make it an excellent candidate for algorithmic trading strategies. Its binary output—bullish or bearish—can be easily coded into automated trading systems.
- **Strategy Integration:** Quant traders might use the indicator as part of a larger trading system that incorporates multiple indicators and rules, optimizing the SMA periods based on historical backtesting to achieve the best results.
5. **Novice Traders:**
- **Use Case:** Beginners can use the Uptrick: Trend SMA Oscillator to learn the basics of trend-following strategies.
The visual simplicity of the color-coded line helps novice traders quickly understand market direction without the need to interpret complex data.
- **Educational Value:** The indicator serves as an excellent starting point for those new to technical analysis, providing a practical example of how moving averages work in a real-world trading environment.
#### Combining the Indicator with Other Tools
1. **Relative Strength Index (RSI):**
- The RSI is a momentum oscillator that measures the speed and change of price movements. When combined with the Uptrick: Trend SMA Oscillator, traders can look for instances where the RSI shows divergence from the price while the oscillator confirms the trend. This can be a powerful signal of an impending reversal or continuation.
2. **Moving Average Convergence Divergence (MACD):**
- The MACD is another popular trend-following momentum indicator. By using it alongside the Uptrick: Trend SMA Oscillator, traders can confirm the strength of a trend and identify potential entry and exit points with greater confidence. For example, a bullish crossover on the MACD that coincides with the Uptrick: Trend SMA Oscillator turning green can be a strong buy signal.
3. **Volume Indicators:**
- Volume is often considered the fuel behind price movements. Using volume indicators like the On-Balance Volume (OBV) or Volume Weighted Average Price (VWAP) in conjunction with the Uptrick: Trend SMA Oscillator can help traders confirm the validity of a trend. A trend identified by the oscillator that is supported by increasing volume is typically more reliable.
4. **Fibonacci Retracement:**
- Fibonacci retracement levels are used to identify potential reversal levels in a trending market. When the Uptrick: Trend SMA Oscillator indicates a trend, traders can use Fibonacci retracement levels to find potential entry points that align with the broader trend direction.
#### Implementation in Different Market Conditions
1. **Trending Markets:**
- The Uptrick: Trend SMA Oscillator excels in trending markets, where it provides clear signals on the direction of the trend. In a strong uptrend, the line will remain green, helping traders stay in the trade for longer periods. In a downtrend, the red line will signal the continuation of bearish conditions, prompting traders to stay short or avoid long positions.
2. **Sideways or Range-Bound Markets:**
- In range-bound markets, where price oscillates within a confined range without a clear trend, the Uptrick: Trend SMA Oscillator may produce more frequent changes in color. While this could indicate potential reversals at the range boundaries, traders should be cautious of false signals. It may be beneficial to pair the oscillator with a volatility indicator to better navigate such conditions.
3. **Volatile Markets:**
- In highly volatile markets, where prices can swing rapidly, the sensitivity of the Uptrick: Trend SMA Oscillator can be adjusted by modifying the SMA periods. A shorter SMA period might capture quick trends, but traders should be aware of the increased risk of whipsaws. Combining the oscillator with a volatility filter or using it in a higher time frame might help mitigate some of this risk.
#### Final Thoughts
The "Uptrick: Trend SMA Oscillator" is a versatile, easy-to-use indicator that stands out for its simplicity, visual clarity, and adaptability. It provides traders with a straightforward method to identify and follow market trends, using the well-established concept of moving averages. The indicator’s customizable nature makes it suitable for a wide range of trading styles, from day trading to long-term investing, and across various asset classes.
By offering immediate visual feedback through color-coded signals, the Uptrick: Trend SMA Oscillator simplifies the decision-making process, allowing traders to focus on execution rather than interpretation. Whether used on its own or as part of a broader technical analysis toolkit, this indicator has the potential to enhance trading strategies and improve overall performance.
Its accessibility and ease of use make it particularly appealing to novice traders, while its adaptability and reliability ensure that it remains a valuable tool for more experienced market participants. As markets continue to evolve, the Uptrick: Trend SMA Oscillator remains a timeless tool, rooted in the fundamental principles of technical analysis, yet flexible enough to meet the demands of modern trading.

Uptrick: Price Action Momentum Oscillator### Detailed Description of the Indicator: "Uptrick: Price Action Momentum Oscillator (PAM Oscillator)"
The "Uptrick: Price Action Momentum Oscillator" (PAM Oscillator) is a highly customized and sophisticated trading indicator designed to provide traders with a multi-dimensional analysis of market momentum across varying timeframes. It stands out due to its comprehensive approach, combining price action analysis with cycle detection to deliver insights into potential trend reversals, continuations, and market strength or weakness. The PAM Oscillator is not just another momentum oscillator; its design incorporates both the granular details of price swings and broader cyclical trends, offering a unique blend of short-term agility and long-term reliability.
#### 1. **Input Settings**
- **PAM Oscillator Settings:**
- **Enable PAM Oscillator:** This feature allows traders to toggle the main oscillator on or off, making it versatile for different trading setups or when combining with other indicators.
- **Short-Term Influence (Default: 1.2):** This parameter controls how much weight short-term price movements have on the overall oscillator. The ability to adjust this weight provides traders with the flexibility to fine-tune the sensitivity of the indicator to short-term fluctuations.
- **Mid-Term Influence (Default: 2.5):** The mid-term weight balances the oscillator by adding a medium-term perspective, essential for capturing sustained price movements without getting swayed by short-term noise.
- **Long-Term Influence (Default: 3.5):** The long-term weight adds stability to the oscillator, ensuring that the indicator reflects broader market trends, which is crucial for long-term traders or when trading in higher timeframes.
- **Oscillator Smoothing (Default: 3):** This parameter allows traders to smooth the oscillator output, reducing the effect of market noise and making the indicator more reliable by filtering out minor price fluctuations.
- **Bullish Trend Color (Default: Green - #4caf50):** The color customization for bullish trends enables traders to visually distinguish market conditions quickly.
- **Bearish Trend Color (Default: Red - #e91e63):** Similarly, the bearish trend color customization aids in quickly identifying market downturns.
- **Enable Oscillator Signals:** This setting allows for the plotting of explicit buy and sell signals, helping traders who prefer clear, actionable insights rather than interpreting raw oscillator values.
- **Bullish Signal Color (Default: Green - #4caf50):** The ability to customize signal colors enhances the clarity of the signals, allowing them to stand out on the chart.
- **Bearish Signal Color (Default: Red - #e91e63):** Like the bullish signal color, this ensures that bearish signals are easily distinguishable.
- **Cycle Analysis Settings:**
- **Enable Cycle Analysis Histogram:** This feature introduces an additional layer of analysis by displaying a histogram that represents cyclical market behavior. It's particularly useful for traders looking to understand the underlying cyclical trends in momentum.
- **Cycle Length (Default: 6):** Adjusting the cycle length allows traders to tailor the cycle detection to different market conditions or asset classes, making the PAM Oscillator adaptable across different markets.
- **Cycle Bullish Color (Default: Light Green - #8bc34a):** The histogram's color customization for bullish cycles aids in quickly identifying periods of positive market momentum.
- **Cycle Bearish Color (Default: Orange - #ff5722):** The bearish cycle color helps in visualizing negative momentum phases.
- **Enable Cycle Signals:** This option allows traders to generate additional buy and sell signals based on the cycle histogram, offering further opportunities to enter or exit trades based on cyclic trends.
- **Cycle Bullish Signal Color (Default: Light Green - #8bc34a):** Customizable signal colors for cycle-based bullish signals improve the indicator's usability by making important signals more visible.
- **Cycle Bearish Signal Color (Default: Orange - #ff5722):** Similarly, bearish signal colors ensure that traders can quickly identify when the market is potentially entering a downtrend.
#### 2. **Custom Types and Functions**
- **PriceData Structure:** The `PriceData` structure encapsulates essential price information (open, high, low, close) along with the bar index. This structure is fundamental for the accurate calculation of swings and trends, ensuring that the oscillator is grounded in precise and up-to-date market data.
- **SwingData Structure:** This structure manages the market's swing points (highs and lows) and their respective indices. It is crucial for detecting and updating the oscillator with significant price levels, helping to identify key turning points in the market.
- **detectSwing Method:** The `detectSwing` method is a core component that determines whether a significant swing (high or low) has occurred. This detection is pivotal for the oscillator, as it triggers the update of the swing data, marking crucial levels where momentum may shift.
- **updateSwing Method:** This method updates the `SwingData` structure when new swing points are detected. It resets the structure's state, ensuring that the most recent price action is accurately reflected in the oscillator.
- **normalizeOsc Function:** The `normalizeOsc` function standardizes the oscillator values between 0 and 100, ensuring consistency across different timeframes and smoothing the data to emphasize genuine momentum changes. This normalization makes the oscillator easier to interpret and more reliable, especially when comparing across different assets or timeframes.
#### 3. **Core Calculations for the Oscillator**
- **Short-Term Oscillator Calculation:**
- This calculation focuses on recent price action to detect short-term trends or reversals. It updates the swing structures based on new highs and lows, determining whether the market is currently bullish or bearish on a short-term basis.
- This feature is particularly useful for traders who need to react quickly to market changes, such as scalpers or day traders.
- **Multi-Term Oscillator Calculation:**
- This function handles the mid-term and long-term oscillators, combining data from these timeframes to produce a comprehensive view of market momentum. It detects and updates swing points across these periods, offering a more robust trend analysis.
- By focusing on multiple timeframes, this calculation helps in filtering out noise and identifying more sustained market trends.
- **Oscillator Data Collection:**
- The `collectOscData` function aggregates oscillator values from short-term, mid-term, and long-term analyses. This comprehensive approach ensures that the final oscillator value reflects a balanced view of the market, taking into account different time horizons and their respective weights.
- The weighted average calculation of the oscillator values allows traders to customize the importance of each timeframe, tailoring the indicator to their specific trading style or strategy.
#### 4. **Plotting the Oscillator and Cycle Histogram**
- **Oscillator Plot:**
- The main oscillator is plotted on the chart, providing a color-coded visualization of market momentum. The gradient from bearish to bullish colors helps traders quickly assess the current market condition.
- Buy and sell signals are plotted based on the oscillator's crossing of the 50 line, offering clear entry and exit points for traders. This feature is particularly beneficial for those who prefer straightforward signals over interpreting complex data.
- **Cycle Histogram Plot:**
- The cycle histogram adds another layer of analysis, highlighting the cyclical nature of market momentum. By displaying the difference between the oscillator value and its smoothed cycle, traders can visualize the strength and direction of cyclical trends.
- The histogram is color-coded to differentiate between bullish and bearish cycles, making it easier to identify periods of rising or falling momentum.
- **Cycle Signal Plot:**
- If cycle signals are enabled, the indicator plots additional buy and sell signals based on the cycle histogram. This feature provides further opportunities for traders to act on cyclical trends, potentially capturing profits from both major and minor market cycles.
### Uniqueness of the PAM Oscillator
The PAM Oscillator is unique in its approach to blending multiple timeframes and cyclical analysis into a single, cohesive indicator. Unlike traditional oscillators that focus on a single aspect of price action, the PAM Oscillator integrates short-term, mid-term, and long-term price data, giving traders a more holistic view of market momentum. Its ability to adjust the influence of different timeframes and the inclusion of cycle analysis makes it exceptionally versatile, catering to a wide range of trading strategies.
- **Comprehensive Multi-Term Analysis:** The PAM Oscillator doesn't just focus on a single timeframe; it aggregates data across short, mid, and long-term horizons, providing a nuanced and adaptable view of market conditions.
- **Integrated Cycle Analysis:** By incorporating a cycle histogram, the PAM Oscillator allows traders to understand and act on the cyclical nature of markets, something that is often overlooked in standard momentum indicators.
- **Customizable Weighting System:** The ability to adjust the weighting of different timeframes and customize colors and signals makes the PAM Oscillator adaptable to different trading environments and preferences, offering a level of customization that is rare among other indicators.
- **Signal Clarity:** The indicator not only visualizes market momentum but also provides clear buy and sell signals based on oscillator and cycle data, making it user-friendly and effective for traders at all levels.
### How Different Traders May Use the PAM Oscillator
1. **Scalpers:**
- **Short-Term Focus:** Scalpers will primarily use the short-term oscillator to identify quick momentum changes for intraday trades. The oscillator’s responsiveness to recent price swings allows them to catch rapid price movements and capitalize on brief market opportunities.
- **Cycle Avoidance:** The cycle histogram can help scalpers avoid periods of low momentum, ensuring they only trade when the market is actively trending, thereby enhancing their profitability.
2. **Day Traders:**
- **Multi-Term Strategy:** Day traders can leverage both the short-term and mid-term oscillators to confirm trend directions before entering trades. This dual-layered approach minimizes the chances of getting
caught in false breakouts, improving trade accuracy.
- **Signal-Based Entries:** The buy/sell signals generated by the oscillator crossing the 50 line offer clear entry and exit points, making it easier for day traders to make quick decisions.
3. **Swing Traders:**
- **Long-Term Influence:** Swing traders might emphasize the long-term oscillator to identify major trend reversals. By smoothing out noise and focusing on longer-term price action, they can hold positions through minor corrections and capitalize on larger market movements.
- **Cycle Confirmation:** The cycle histogram can serve as a confirmation tool, helping swing traders stay in trades during strong cycles and exit when momentum starts to weaken.
4. **Position Traders:**
- **Cycle Dominance:** Position traders can use the cycle histogram to identify macro trends, holding positions for extended periods based on long-term cyclical analysis. This approach is particularly useful in markets with clear cyclical patterns.
- **Multi-Term Validation:** These traders can use the multi-term oscillator to ensure that all timeframes are aligned with their long-term trading strategy, providing greater confidence in maintaining positions through periods of short-term volatility.
### In Summary
The PAM Oscillator is not just an indicator; it’s a comprehensive toolkit for understanding and trading market momentum across different timeframes and cycles. Its unique combination of customizable weighting, multi-term analysis, and integrated cycle detection makes it a powerful tool for traders of all styles, from scalpers to long-term investors. Whether you're looking to capitalize on short-term price movements or identify long-term trends, the PAM Oscillator provides the insights and flexibility needed to navigate the complexities of modern trading.
---------------------------------------------------------------------------------
This indicator's code will soon be available on: discord.gg
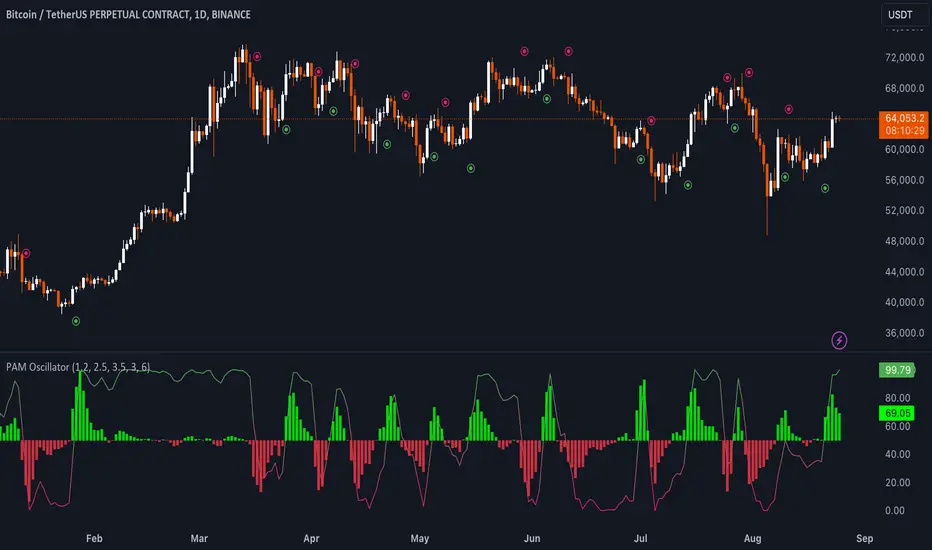
Uptrick: Momentum Channel Indicator
### 🌟 **Uptrick: Momentum Channel Indicator (MC_Ind)** 🌟
The **"Uptrick: Momentum Channel Indicator"** is a powerful tool designed to help traders gauge market momentum and identify potential overbought or oversold conditions. Whether you're a day trader, swing trader, or long-term investor, this indicator can be your compass 🧭 in the complex world of trading.
### 🎯 **Purpose of the Indicator**
The primary goal of the **Momentum Channel Indicator** is to measure the deviation of price from its moving average (the mid-point) and to smooth this deviation to identify momentum shifts. By plotting overbought and oversold levels, the indicator helps traders spot potential reversal points where the market might change direction, offering valuable entry or exit signals.
### 🔧 **Inputs & Parameters**
Let's break down the input parameters that you can adjust to tailor the indicator to your trading style:
1. **`length1` (Channel Length) 📏**: This is the period over which the moving average (mid-point) and price deviation are calculated. The default value is 14, meaning the last 14 bars are considered for calculations.
2. **`length2` (Smoothing Length) 🧘**: This parameter controls the smoothing of the channel index, with a default value of 28. The higher the value, the smoother the momentum line, reducing noise and making trends more visible.
3. **`overbought1` & `overbought2` (Overbought Levels) 🔴**: These levels, set at 70 and 65 by default, represent the threshold above which the market is considered overbought, potentially signaling a selling opportunity.
4. **`oversold1` & `oversold2` (Oversold Levels) 🟢**: Similarly, these levels, set at -70 and -65, mark the threshold below which the market is considered oversold, indicating a potential buying opportunity.
### 🛠️ **How the Indicator Works**
Now, let's dive into the mechanics of the Momentum Channel Indicator:
1. **Mid-Point Calculation 🏁**: The mid-point is calculated using a simple moving average (SMA) of the closing prices over the `length1` period. This mid-point acts as a reference line from which deviations are measured.
2. **Price Deviation 📊**: The price deviation is the absolute difference between the closing price and the mid-point, smoothed over the same period (`length1`). This represents the typical price movement away from the mid-point.
3. **Channel Index 📉**: The channel index is calculated by dividing the price deviation by a fraction (0.01) of the mid-point, providing a normalized measure of how far the price has deviated from the average.
4. **Smoothing of the Channel Index 🌊**: The smoothed index (`mci1`) is calculated by applying a smoothing filter (SMA) over the channel index using the `length2` parameter. This helps reduce noise and highlight the true momentum of the market.
5. **Momentum Lines 📈**:
- **`mci1`**: The main momentum line, representing the smoothed channel index.
- **`mci2`**: A secondary momentum line, which is a further smoothed version of `mci1` using a 6-period SMA.
6. **Signal Lines 🚦**:
- **Overbought & Oversold Levels**: Horizontal lines plotted at `overbought1`, `overbought2`, `oversold1`, and `oversold2` levels serve as visual cues for overbought and oversold conditions.
- **Zero Line**: A central reference line at 0, indicating neutral momentum.
### 📈 **How to Use the Indicator**
#### 1. **Day Traders ⚡**
For day traders, the Momentum Channel Indicator can be a quick signal generator for short-term trades. Here's how you can use it:
- **Identify Entry Points 🎯**: Look for a **bullish crossover** when `mci1` crosses above `mci2` from below the `oversold1` level. This signals a potential upward reversal.
- **Spot Exit Points 🏁**: Watch for a **bearish crossunder** when `mci1` crosses below `mci2` from above the `overbought1` level. This could indicate a downward reversal.
- **Scalping 🔄**: In a fast-moving market, use the indicator to scalp by entering and exiting trades at these crossover points, with a tight stop-loss strategy.
#### 2. **Swing Traders 🎢**
Swing traders benefit from using the Momentum Channel Indicator to identify potential reversal points over a longer period:
- **Trend Confirmation 📊**: Use the smoothing effect of `mci2` to confirm trends. If `mci2` remains consistently above 0, it indicates a strong bullish trend, and vice versa.
- **Overbought/Oversold Reversals 🚀**: Enter trades when the price approaches the overbought or oversold levels (`overbought1`, `oversold1`). Combine this with other indicators, such as RSI, for more reliable signals.
- **Hold Positions 🧗**: Let the momentum lines guide your hold strategy. If the momentum lines stay aligned (both `mci1` and `mci2` are moving in the same direction), consider holding the position until a crossover or reversal signal appears.
#### 3. **Long-Term Investors 🏦**
For long-term investors, the Momentum Channel Indicator helps in fine-tuning entry and exit points based on broader market momentum:
- **Divergence Analysis 📐**: Look for divergence between the price and the momentum lines. If the price makes new highs but the momentum lines do not, it could signal a weakening trend and a potential reversal.
- **Strategic Entry/Exit 🏹**: Use the `overbought2` and `oversold2` levels to strategically enter or exit positions. These secondary levels provide an early warning before the market reaches extreme conditions.
- **Risk Management 🛡️**: The indicator can also be used as part of a risk management strategy by identifying when to reduce exposure in overbought markets or increase exposure in oversold markets.
### 🖼️ **Visualization & Interpretation**
The Momentum Channel Indicator is visually intuitive, with each component providing key insights:
1. **Momentum Lines (MCI1 & MCI2) 📈**:
- **Blue Line (`mci1`)**: Represents the main momentum line, providing immediate insights into market direction.
- **Orange Line (`mci2`)**: A secondary momentum line, further smoothed to confirm trends.
2. **Overbought/Oversold Levels 🔴🟢**:
- **Solid & Dashed Lines**: These lines highlight overbought and oversold regions, guiding traders on when to consider entering or exiting trades.
3. **MCI Difference (Purple Area) 🌌**:
- **Shaded Area**: The difference between `mci1` and `mci2`, shaded in purple, helps visualize the strength of the momentum. The larger the shaded area, the stronger the momentum.
### 🚀 **Advanced Tips & Tricks**
For those looking to maximize the potential of the Momentum Channel Indicator, here are some advanced strategies:
1. **Combine with Volume Indicators 📊**: Use volume indicators like OBV (On-Balance Volume) or Volume Oscillator to confirm momentum signals. For instance, a bullish crossover combined with increasing volume can reinforce a buy signal.
2. **Multiple Timeframe Analysis 🕒**: Apply the Momentum Channel Indicator across multiple timeframes (e.g., daily and weekly) to get a more comprehensive view of the market. This can help in aligning short-term trades with long-term trends.
3. **Adjusting Parameters 🔄**: Depending on market conditions, tweak the `length1` and `length2` parameters. In a highly volatile market, shorter lengths might provide quicker signals, whereas in a stable market, longer lengths could smooth out noise.
4. **Divergence & Convergence 📐**: Watch for divergence between price and momentum lines as a leading indicator of potential reversals. Convergence (when the price and momentum move in sync) can confirm the strength of the trend.
### **Conclusion**
The **Uptrick: Momentum Channel Indicator** is a versatile tool that can be customized for various trading styles and market conditions. Whether you're trading in fast-paced environments or analyzing long-term trends, this indicator offers a clear and intuitive way to gauge market momentum, identify potential reversals, and make informed trading decisions.
By understanding and applying the principles outlined above, you can harness the full power of this indicator, transforming your trading strategy from good to great! 🌟

Uptrick: MultiTrend Squeeze System**Uptrick: MultiTrend Squeeze System Indicator: The Ultimate Trading Tool for Precision and Versatility 📈🔥**
### Introduction
The MultiTrend Squeeze System is a powerful, multi-faceted trading indicator designed to provide traders with precise buy and sell signals by combining the strengths of multiple technical analysis tools. This script isn't just an indicator; it's a comprehensive trading system that merges the power of SuperTrend, RSI, Volume Filtering, and Squeeze Momentum to give you an unparalleled edge in the market. Whether you're a day trader looking for short-term opportunities or a swing trader aiming to catch longer-term trends, this indicator is tailored to meet your needs.
### Key Features and Unique Aspects
1. **SuperTrend with Dynamic Adjustments 📊**
- **Adaptive SuperTrend Calculation:** The SuperTrend is a popular trend-following indicator that adjusts dynamically based on market conditions. It uses the Average True Range (ATR) to calculate upper and lower bands, which shift according to market volatility. This script takes it further by combining it with the RSI and Volume filtering to provide more accurate signals.
- **Direction Sensitivity:** The SuperTrend here is not static. It adjusts based on the direction of the previous SuperTrend value, ensuring that the indicator remains relevant even in choppy markets.
2. **RSI Integration for Overbought/Oversold Conditions 💹**
- **RSI Calculation:** The Relative Strength Index (RSI) is incorporated to identify overbought and oversold conditions, adding an extra layer of precision. This helps in filtering out false signals and ensuring that trades are taken only in optimal conditions.
- **Customizable RSI Settings:** The RSI settings are fully customizable, allowing traders to adjust the RSI length and the overbought/oversold levels according to their trading style and market.
3. **Volume Filtering for Enhanced Signal Confirmation 📉**
- **Volume Multiplier:** This unique feature integrates volume analysis, ensuring that signals are only generated when there is sufficient market participation. The Volume Multiplier can be adjusted to filter out weak signals that occur during low-volume periods.
- **Optional Volume Filtering:** Traders have the flexibility to turn the volume filter on or off, depending on their preference or market conditions. This makes the indicator versatile, allowing it to be used across different asset classes and market conditions.
4. **Squeeze Momentum Indicator (SMI) for Market Pressure Analysis 💥**
- **Squeeze Detection:** The Squeeze Momentum Indicator detects periods of market compression and expansion. This script goes beyond the traditional Bollinger Bands and Keltner Channels by incorporating true range calculations, offering a more nuanced view of market momentum.
- **Customizable Squeeze Settings:** The lengths and multipliers for both Bollinger Bands and Keltner Channels are customizable, giving traders the flexibility to fine-tune the indicator based on their specific needs.
5. **Visual and Aesthetic Customization 🎨**
- **Color-Coding for Clarity:** The indicator is color-coded to make it easy to interpret signals. Bullish trends are marked with a vibrant green color, while bearish trends are highlighted in red. Neutral or unconfirmed signals are displayed in softer tones to reduce noise.
- **Histogram Visualization:** The primary trend direction and strength are displayed as a histogram, making it easy to visualize the market's momentum at a glance. The height and color of the bars provide immediate feedback on the strength and direction of the trend.
6. **Alerts for Real-Time Trading 🚨**
- **Custom Alerts:** The script is equipped with custom alerts that notify traders when a buy or sell signal is generated. These alerts can be configured to send notifications through various channels, including email, SMS, or directly to the trading platform.
- **Immediate Reaction:** The alerts are triggered based on the confluence of SuperTrend, RSI, and Volume signals, ensuring that traders are notified only when the most robust trading opportunities arise.
7. **Comprehensive Input Customization ⚙️**
- **SuperTrend Settings:** Adjust the ATR length and factor to control the sensitivity of the SuperTrend. This allows you to adapt the indicator to different market conditions, whether you're trading a volatile cryptocurrency or a more stable stock.
- **RSI Settings:** Customize the RSI length and thresholds for overbought and oversold conditions, enabling you to tailor the indicator to your specific trading strategy.
- **Volume Settings:** The Volume Multiplier and the option to toggle the volume filter provide an additional layer of customization, allowing you to fine-tune the indicator based on market liquidity and participation.
- **Squeeze Momentum Settings:** The lengths and multipliers for Bollinger Bands and Keltner Channels can be adjusted to detect different levels of market compression, providing flexibility for both short-term and long-term traders.
### How It Works: A Deep Dive Into the Mechanics 🛠️
1. **SuperTrend Calculation:**
- The SuperTrend is calculated using the ATR, which measures market volatility. The indicator creates upper and lower bands around the price, adjusting these bands based on the current level of market volatility. The direction of the trend is determined by the position of the price relative to these bands.
- The script enhances the standard SuperTrend by ensuring that the bands do not flip-flop too quickly, reducing the chances of false signals in a choppy market. The direction is confirmed by checking the position of the close relative to the previous band, making the trend detection more reliable.
2. **RSI Integration:**
- The RSI is calculated over a customizable length and compared to user-defined overbought and oversold levels. When the RSI crosses below the oversold level, and the SuperTrend indicates a bullish trend, a buy signal is generated. Conversely, when the RSI crosses above the overbought level, and the SuperTrend indicates a bearish trend, a sell signal is triggered.
- The combination of RSI with SuperTrend ensures that trades are only taken when there is a strong confluence of signals, reducing the chances of entering trades during weak or indecisive market phases.
3. **Volume Filtering:**
- The script calculates the average volume over a 20-period simple moving average. The volume filter ensures that buy and sell signals are only valid when the current volume exceeds a multiple of this average, which can be adjusted by the user. This feature helps filter out weak signals that might occur during low-volume periods, such as just before a major news event or during after-hours trading.
- The volume filter is particularly useful in markets where volume spikes are common, as it ensures that signals are only generated when there is significant market interest in the direction of the trend.
4. **Squeeze Momentum:**
- The Squeeze Momentum Indicator (SMI) adds a layer of market pressure analysis. The script calculates Bollinger Bands and Keltner Channels, detecting when the market is in a "squeeze" — a period of low volatility that typically precedes a significant price move.
- When the Bollinger Bands are inside the Keltner Channels, the market is in a squeeze (compression phase). This is often a precursor to a breakout or breakdown. The script colors the histogram bars black during this phase, indicating a potential for a strong move. Once the squeeze is released, the bars are colored according to the direction of the SuperTrend, signaling a potential entry point.
5. **Integration and Signal Generation:**
- The script brings together the SuperTrend, RSI, Volume, and Squeeze Momentum to generate highly accurate buy and sell signals. A buy signal is triggered when the SuperTrend is bullish, the RSI indicates oversold conditions, and the volume filter confirms strong market participation. Similarly, a sell signal is generated when the SuperTrend is bearish, the RSI indicates overbought conditions, and the volume filter is met.
- The combination of these elements ensures that the signals are robust, reducing the likelihood of entering trades during weak or indecisive market conditions.
### Practical Applications: How to Use the MultiTrend Squeeze System 📅
1. **Day Trading:**
- For day traders, this indicator provides quick and reliable signals that can be used to enter and exit trades multiple times within a day. The volume filter ensures that you are trading during the most liquid times of the day, increasing the chances of successful trades. The Squeeze Momentum aspect helps you catch breakouts or breakdowns, which are common in intraday trading.
2. **Swing Trading:**
- Swing traders can use the MultiTrend Squeeze System to identify longer-term trends. By adjusting the ATR length and factor, you can make the SuperTrend more sensitive to catch longer-term moves. The RSI and Squeeze Momentum aspects help you time your entries and exits, ensuring that you get in early on a trend and exit before it reverses.
3. **Scalping:**
- For scalpers, the quick signals provided by this system, especially in combination with the volume filter, make it easier to take small profits repeatedly. The histogram bars give you a clear visual cue of the market's momentum, making it easier to scalp effectively.
4. **Position Trading:**
- Even position traders can benefit from this indicator by using it to confirm long-term trends. By adjusting the settings to less sensitive parameters, you can ensure that you are only entering trades when a strong trend is confirmed. The Squeeze Momentum indicator will help you stay in the trade during periods of consolidation, waiting for the next big move.
### Conclusion: Why the MultiTrend Squeeze System is a Game-Changer 🚀
The MultiTrend Squeeze System is not just another trading indicator; it’s a comprehensive trading strategy encapsulated within a single script. By combining the power
of SuperTrend, RSI, Volume Filtering, and Squeeze Momentum, this indicator provides a robust and versatile tool that can be adapted to various trading styles and market conditions.
**Why is it Unique?**
- **Multi-Dimensional Analysis:** Unlike many other indicators that rely on a single data point or calculation, this script incorporates multiple layers of analysis, ensuring that signals are based on a confluence of factors, which increases their reliability.
- **Customizability:** The vast range of input settings allows traders to tailor the indicator to their specific needs, whether they are trading forex, stocks, cryptocurrencies, or commodities.
- **Visual Clarity:** The color-coded bars, labels, and signals make it easy to interpret the market conditions at a glance, reducing the time needed to make trading decisions.
Whether you are a novice trader or an experienced market participant, the MultiTrend Squeeze System offers a powerful toolset to enhance your trading strategy, reduce risk, and maximize your potential returns. With its combination of trend analysis, momentum detection, and volume filtering, this indicator is designed to help you trade with confidence and precision in any market condition.
