Trend StrengthA NRTH_ Technical Indicator Study
Comes included with the Essentials or Premium Package.
Indicator features
MTF Capability
Custom Candle Colors
Identify Trend Direction and Strength
Usage Tips
Works on all timeframes and markets, recommended use with bar colors on.
Backgrounds = Confirmed Trend
Oscillator Colors;
Bright Green/Red = Strong Trend
Black/White = Weak Trend / Pullback
(NOTE: Using MTF Candles does cause Repainting until higher timeframe candle closes)
-------------------------------------------
Disclaimer
Copyright NRTH_ Indicators 2021.
NRTH_ and all affiliated parties are not registered as financial advisors. The products & services NRTH_ offers are for educational purposes only and should not be construed as financial advice. You must be aware of the risks and be willing to bear any level of risk to invest in financial markets. Past performance is not necessarily indicative of future results. NRTH_ and all individuals associated assume no responsibility for your trading results or investments.
All investments involve risk, and the past performance of a security, industry, sector, market, financial product, trading strategy, or individual’s trading does not guarantee future results or returns. Investors are fully responsible for any investment decisions they make. Such decisions should be based solely on an evaluation of their financial circumstances, investment objectives, risk tolerance, and liquidity needs.
مؤشر الزخم

Smart Entry BETAA Custom Unique indicator by NRTH_
Comes included with the Premium Package.
Indicator features
Built-In Alerts
Visual Risk Management
Customizable Entry Rules
Usage Tips
Smart Entry is currently a BETA algo. we are still in the process of tweaking and programming it only give entry signals when they are confirmed, and work of very strict parameters to allow for trading all the way down to the 5m timeframe. It is currently at a stage where it can produce profitable trades or even just act as a confirmation signal in use with another strategy, but this project will be ongoing until we can obtain high profitability levels on very low timeframes.
The algo uses both momentum and trend calculation to find an entry, highly recommended use with the built-in MA Filter for best results.
Works for all markets with the ability to customize to your liking.
Backtesting Results Info
Period 1/1/2021-1/10/2021
Entry value at $1000 with 10x leverage
Binance standard taker fee rate (0.04%)
ATR Exits : 1:2.9 RR
-------------------------------------------
Disclaimer
Copyright NRTH_ Indicators 2021.
NRTH_ and all affiliated parties are not registered as financial advisors. The products & services NRTH_ offers are for educational purposes only and should not be construed as financial advice. You must be aware of the risks and be willing to bear any level of risk to invest in financial markets. Past performance is not necessarily indicative of future results. NRTH_ and all individuals associated assume no responsibility for your trading results or investments.
All investments involve risk, and the past performance of a security, industry, sector, market, financial product, trading strategy, or individual’s trading does not guarantee future results or returns. Investors are fully responsible for any investment decisions they make. Such decisions should be based solely on an evaluation of their financial circumstances, investment objectives, risk tolerance, and liquidity needs.

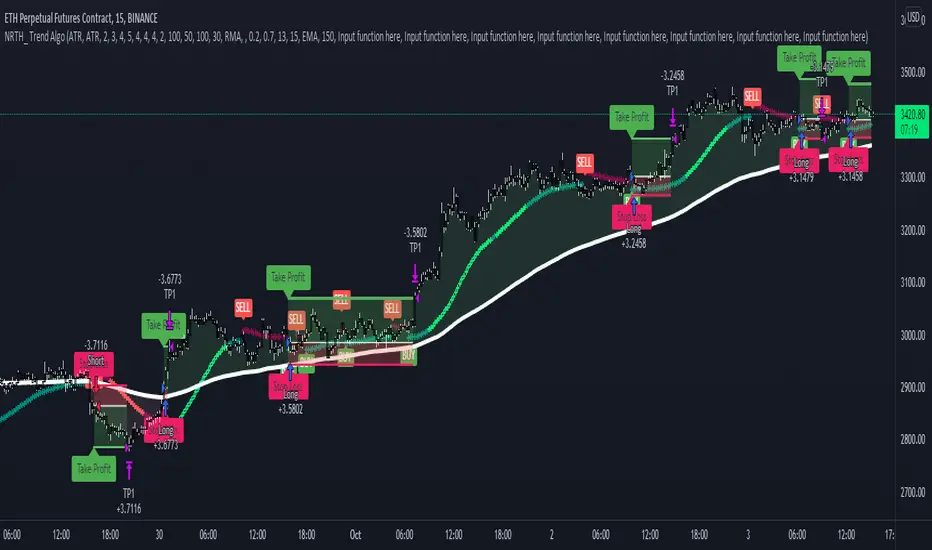
Trend AlgoA NRTH_ Premium Momentum Based Strategy
Comes included with the Premium Package.
Indicator features
Built-In Alerts
Visual Risk Management
Customizable Entry Rules
Usage Tips
This strategy works on timeframes as low as 5m, great for scalping or day trading.
The algo identifies price momentum with strict entry signal settings (can be made more or less sensitive).
Works for all markets with the ability to customize to your liking.
Backtesting Results Info
Period 1/1/2021-1/10/2021
Entry value at $1000 with 10x leverage
Binance standard taker fee rate (0.04%)
ATR Exits : 1:2 RR
-------------------------------------------
Disclaimer
Copyright NRTH_ Indicators 2021.
NRTH_ and all affiliated parties are not registered as financial advisors. The products & services NRTH_ offers are for educational purposes only and should not be construed as financial advice. You must be aware of the risks and be willing to bear any level of risk to invest in financial markets. Past performance is not necessarily indicative of future results. NRTH_ and all individuals associated assume no responsibility for your trading results or investments.
All investments involve risk, and the past performance of a security, industry, sector, market, financial product, trading strategy, or individual’s trading does not guarantee future results or returns. Investors are fully responsible for any investment decisions they make. Such decisions should be based solely on an evaluation of their financial circumstances, investment objectives, risk tolerance, and liquidity needs.
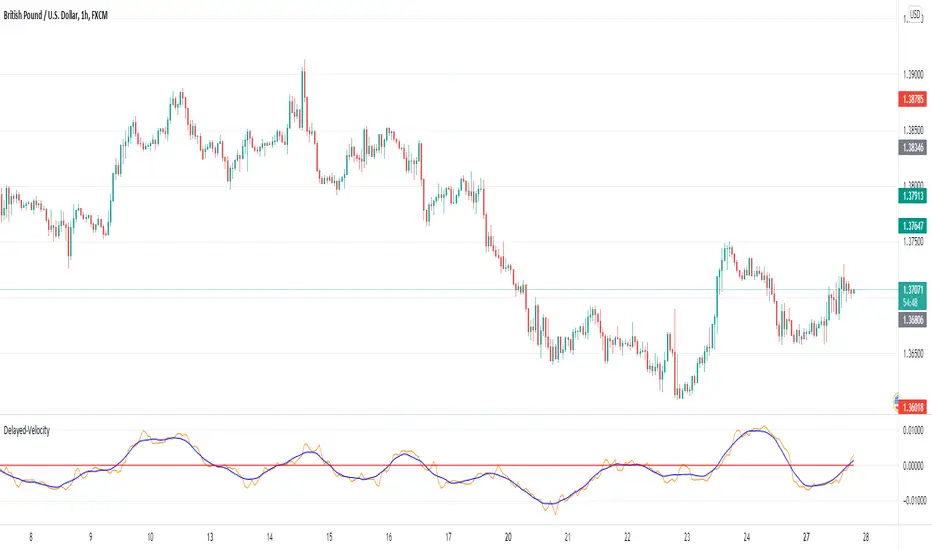
Delayed-VelocityThis indicator shows the delayed velocity and it's moving average (delayed further) of the price pattern
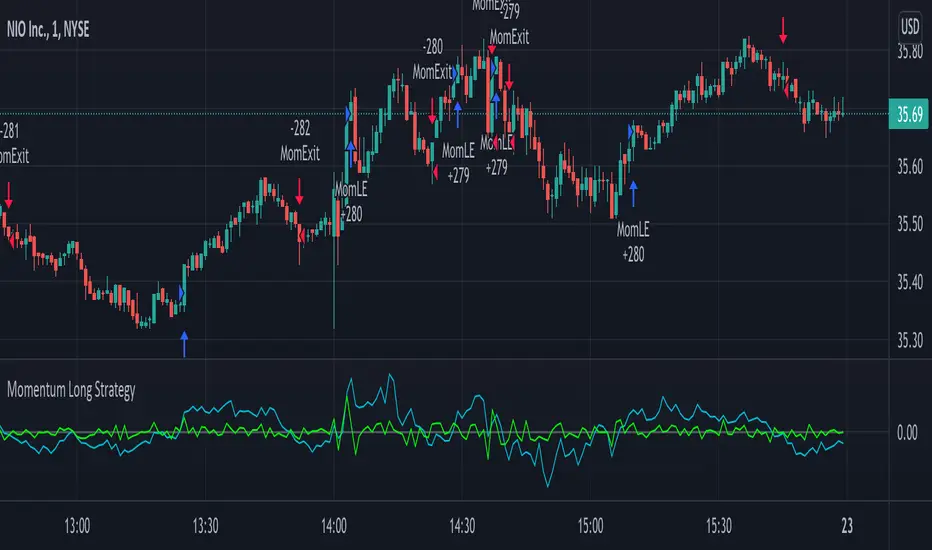
Momentum Long StrategyThis is a momentum indicator strategy that plots 2 lines on the momentum indicator and if both cross above zero a long entry is generated and if both cross below zero a long exit is generated. It also has code to check and make sure the condition is still true when launching the official alert, which helps back testing and live results line up, however be sure to enter commission and slippage into the properties to accurately reflect profits. There's also an optional "percent" option and selecting the MOM1 option in the "MOM Choice" field as it uses a slightly different calculation and may provide better results than the standard momentum calculation. The zero line plotted on the indicator so you can clearly see when lines are crossing above or below zero. Also I'd like to thank @felipecms14 for his open source momentum code. I added back testing date ranges to this so you can easily pull up and see back tested results for a certain date range. I also added a buy and sell message field in the properties so you can launch alerts that will work with automated trading services. Simply enter your buy message and sell message into those fields in the properties and then when you create an alert enter {{strategy.order.alert_message}} into the alert body and it will dynamically pull in your buy and sell messages when it fires alerts.
Momentum StrategyThis is a momentum indicator strategy that plots 2 lines on the momentum indicator and if both cross above zero a long entry is generated and if both cross below zero a short entry is generated. It also has code to check and make sure the condition is still true when launching the official alert, which helps back testing and live results line up, however be sure to enter commission and slippage into the properties to accurately reflect profits. There's also an optional "percent" option and selecting the MOM1 option in the "MOM Choice" field as it uses a slightly different calculation and may provide better results than the standard momentum calculation. Also I'd like to thank @felipecms14 for his open source momentum code. I added back testing date ranges to this so you can easily pull up and see back tested results for a certain date range.

Jerry Romine Momentum Dream With Risk ManagementThe Momentum Dream Indicator with Risk Management is really two powerful indicators combined in one.
The Momentum Dream Indicator is a volatility and momentum indicator that measures the relationship between the Bollinger Bands and Keltner Channels to help identify consolidations and signal potential breakouts.
MOMENTUM DREAM INDICATOR:
SIGNALS AND ZONES:
Green Arrow = Post Squeeze Buy Triggered = GREEN ⇧ shows squeeze out on upward momentum (often a good time to buy)
Orange Arrow = Post Squeeze Sell Alert = ORANGE ⇩ shows squeeze out on downward momentum (often a good time to sell or NOT buy)
Green Dot on Chart - Day one of the buy zone
Green Shading - Buy Zone
Pink Dot on Chart - Day one of warning zone
Red Shading - Warning zone. Often a good time not to buy or to consider selling.
LABELS (Color Indicates Direction):
Momo Up / Down = Current momentum direction.
Squeeze = Squeeze is on and squeeze line dots are red.
Dots = number of day or bars the squeeze has been in red(on)
Squeeze Fired = Green or Orange arrow shows squeeze fired direction.
Stacked = Fibonacci 8, 21, 34, 55, 89 EMA are stacked up or down
SQUEEZE LINE COLOR DEFINITIONS:
Dark Red = Extra Squeeze (In & Out)
Red = Original Squeeze (In & Out)
Pink = Pre-Squeeze (In)
Yellow = Pre-Squeeze (Out)
Green = Bollinger Bands are officially outside of Keltner Channels
STRATEGY
There are multiple ways the Momentum Dream Indicator can be used.
1. Buy/Sell during the squeeze (generally lower volatility and lower option premiums)
2. Buy/Sell when the squeeze fires to catch the breakout (volume/volatility often increase)
3. Use Buy/Sell Zones with other signals for entering positions
4. Use Momentum to assist with position direction
5. Use fading momentum to tighten stops or close positions.
* The labels only show when certain criteria are met. For example if a squeeze fired the label only shows on that day but the indicator arrow will always show. For this reason the labels on the chart above will vary from day to day and only alert you when needed. :)
RISK MANAGEMENT INDICATOR
Risk management is a vital part of investing and this indicator provides 2 recommended positions sizes. One based on the classic 1-2% risk rule where you never risk more than X% of your account. A second based on position size not exceeding X% of your account.
The Risk Management Indicator does all of the hard math and provides you with a realistic trading plan, position size, and trail stop based on your customizable criteria. If you’ve ever wondered how much of a stock to buy, when to sell and when to take profits this indicator is for you!
Please Use the link below for more information or to purchase.

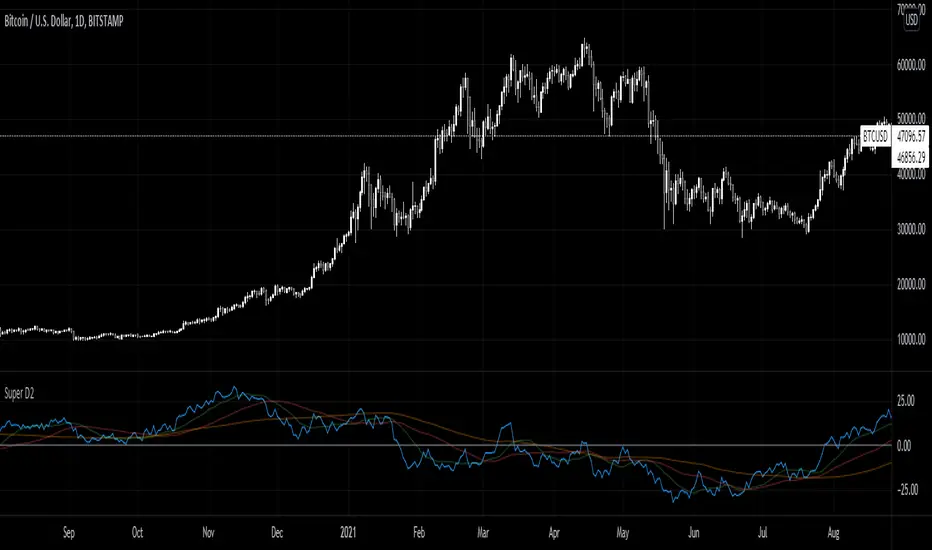
Super D2Momentum Indicator based on previous candle structure over past 40 periods
- Blue is momentum score
- Green = 15 ema
- Red = 50 sma
- orange = 100 sma
The indicator looks at the previous candles differences between open, close, high, and low to determine momentum. A high close relative to open or low indicates very strong momentum for example.

Trend Strength Directional IndicatorThis study was inspired by two famous Trading View contributors. Shout out to Lazy Bear and Crypto Face!
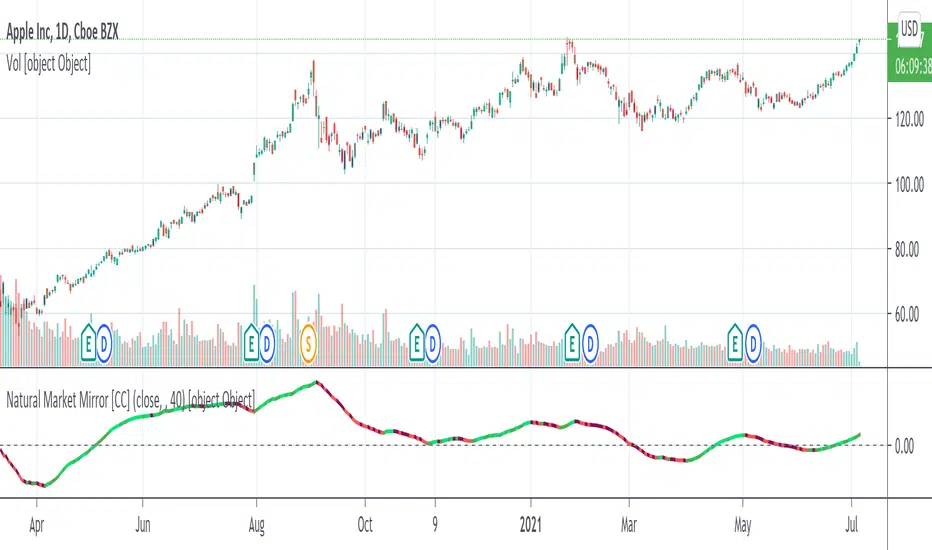
In this study you have a live view of the strength of direction the market is heading. The indicator that looks like a black wave is showing us the momentum of price action. When a green dot appears under the lower level it is a indication that we should consider buying, and if the red dot appears over the upper level we should sell. The custom MFI indicator determines how much money is flowing into the market. If it is green that means money is flowing into the market and if it shows red it means that money is flowing out of the market.

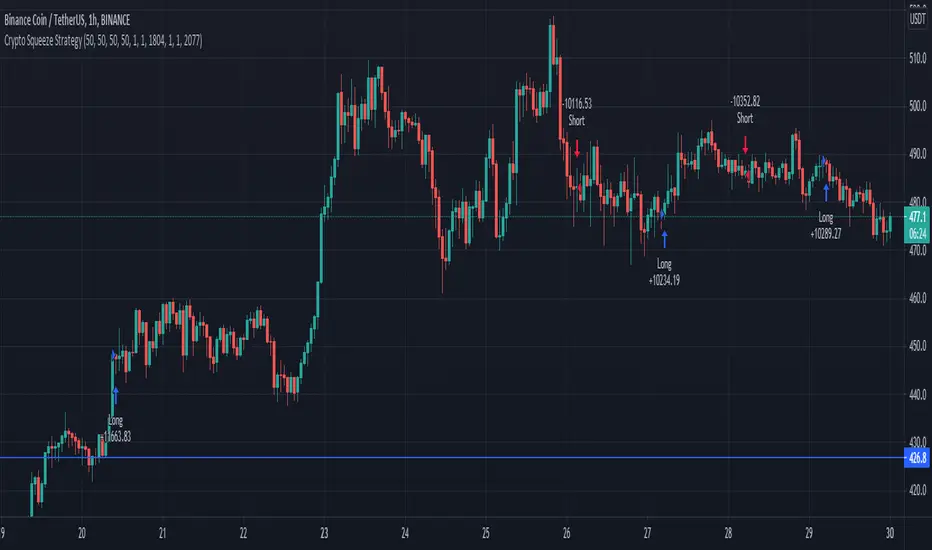
Crypto Squeeze StrategyThis strategy was inspired by two famous Trading View contributors. Shout out to Lazy Bear and Crypto Face!
The strategy includes a similar replication of the blue wave, and MFI indicator. The point of the strategy is to buy when the blue wave crosses up the zero value, and the MFI is greater than zero value. This indicates that there is strong bullish momentum and money flowing into the market.
Ehlers Relative Vigor Index [CC]The Relative Vigor Index was created by John Ehlers (Cybernetic Analysis For Stocks And Futures pg 58) and this is a momentum indicator that is similar to the Accumulation Distribution Oscillator created by Jim Waters and Larry Williams. He uses digital signal processing to smooth the indicator to provide clear buy and sell signals. The idea behind this indicator is that during uptrends, prices tend to close near the high and during downtrends, prices tend to close near the low. I have included strong buy and sell signals in addition to normal ones so strong signals are darker in color and normal ones are lighter in color. Buy when the line turns green and sell when it turns red. Usually the best signals I have found for this indicator is when the indicator is below the 0 line and turns green then it is usually a sign of a strong uptrend.
Let me know if there are any other scripts you would like to see me publish!

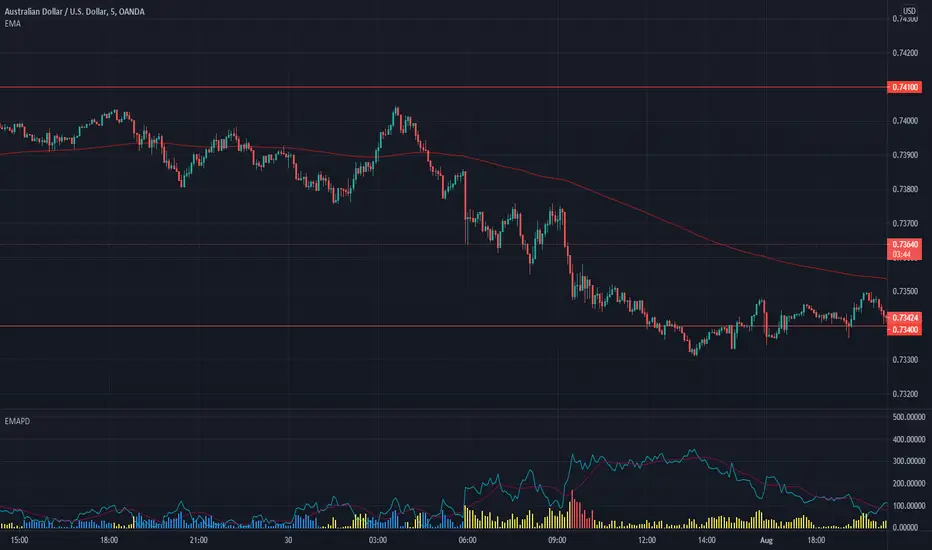
EMA Price DistanceEMA Price Distance, EMAPD for short, is a trend following indicator that can help you predict how price is going to move, in respect to your EMA. It can give overbought and oversold signals, as well as ranging market and retracement signals. The indicator consists of three parts, the Difference Line, the Average Line, and the Histograms.
- The blue line is the Difference Line. It is calculated from difference between the close price and the EMA. An increasing Difference Line indicates price moving further away from the EMA.
- The purple line is the Average Line. It is calculated based on the average of the difference Line for a certain lookback period.
- The Histograms are the difference between the Difference Line and the Average Line
Some basic signals:
- The easiest signal to spot is when the Difference Line is further away from the Average Line than normal. This usually signifies a retracement in the near future.
- Another signal is when the histograms are making smaller peaks or troughs, approaching 0. Signifies that price is retracing towards EMA. This can also be seen when the Difference Line is below the Average Line
How to Use:
The first use case is to detect when the market is ranging. This can be seen when both lines near 0 like so:
Another use case, is to use the indicator to signify how strong the current trend is / how likely it is to continue. This is signified by the Difference Line and Average line making higher highs
We can see that as the trend continues, both lines increase in harmony.
EMAPD can also be used to give easy to see signs of retracement or reversal.
Here we can see that the Difference line made a lower high as well as crossed below the Average Line. Whether this is a retracement or reversal usually depends on how the long the trend has occurred. The longer, the more likely of a trend reversal
One of the best use cases is to keep you out of bad trades. This usually happens right before a trend starts, when the market is choppier. This is when you usually get a lot of fake outs and false signals.
Here are 2 examples of where someone trading Supply and Demand would've been kept out of a losing trade.
In the first purple oval, a supply zone is formed. As price re enters the zone, it would be tempting to go long but the EMAPD is creating lower lowers on the histograms, signifying that price is moving closer to its average instead of expanding. We also get the Difference Line to cross under the average line, signifying price is moving closer to the EMA than it has been recently. These signals tell us that price has a good chance to "re group" with the EMA, which it ends up doing.
This also kept us out of the second trade, signified by the second purple oval. Here, we can see the difference line creating lower lows, signaling that price is moving closer to the EMA.
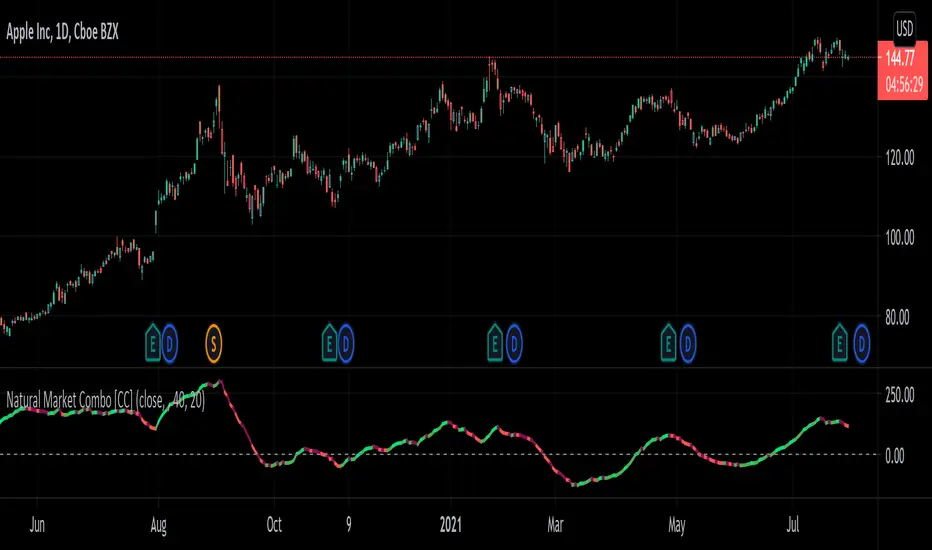
Natural Market Combo [CC]The Natural Market Combo was created by Jim Sloman and this is another one of my Ocean series of indicators to provide his full life's work free of charge to everyone. Just as the name implies, this is a combination of his two market indicators ( Natural Market River and Natural Market Mirror ) and this is a momentum indicator like the others. Big thanks to @altcoinz and @tmac87 for providing me the full source code and documentation to be able to publish all of Jim's work. This indicator is very simple to understand in that it takes the 2 market indicators and creates his own average of both indicators then smooths the result. I did fix an error that he didn't account for in his original script so the results are much more accurate. I have included strong buy and sell signals as darker colors and normal buy and sell signals as normal colors. Buy when the line turns green and sell when it turns red.
Let me know if there are any other indicators or scripts you would like to see me publish!
Natural Market Slope [CC]The Natural Market Slope was created by Jim Sloman and this is one of his many Ocean Indicators which I'm publishing thanks to receiving source materials from @altcoinz and @tmac87. I did completely rewrite the formula for this indicator but I commented out the original calculation so you can compare or just for study purposes. I like this version better because it is very smooth and the original formula is a bit faster with response but is very choppy in comparison.
This indicator was the basis for his Natural Market Combo which I will be publishing very soon so stay tuned for that. The idea behind all of his Natural indicators was to use the natural log of the current price in different ways. This indicator obviously focuses on the slope and it essentially becomes another momentum indicator which peaks when the upward momentum is gone and vice versa. Buy when the line turns green and sell when it turns red. I have added strong buy and sell signals in addition to the normal ones and strong signals are darker in color in comparison to the original lighter colors.
Let me know if there are any other indicators you would like to see me publish!

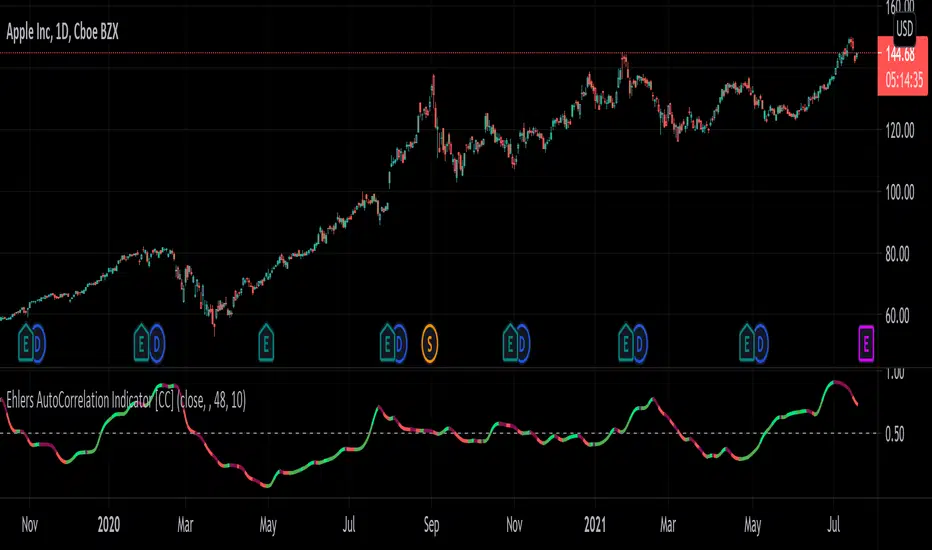
Ehlers AutoCorrelation Indicator [CC]The AutoCorrelation Indicator was created by John Ehlers (Cycle Analytics pgs 94-98) and this can be viewed as both a momentum indicator and a trend indicator. This was his basis for several other indicators that he created which I will be publishing soon but essentially as this indicator goes up then the stock is in an uptrend and also has upward momentum. You will notice that this indicator starts to go down even during an uptrend showing that the underlying trend is going to have an upcoming reversal. He also warns that the halfway mark is a possible reversal point so keep an eye out for that.
Generally speaking a good signal is to enter a long position when the indicator is under the midline and is starting to go up (or when the line is green) and to exit the position when the indicator goes over the midline. I have included strong buy and sell signals in addition to normal ones so darker colors mean strong signals and lighter colors mean normal signals.
Let me know if there are any other indicators you would like me to publish!
MC Pro | BMS V3Published 10 July 2021
MC Pro (Momentum Compressor) with Fast MACD
Detects buying selling momentum & consolidation
suitable for Swing & Day Trading.
Check settings option switch to FIFO setup.
Histogram
Green = Buying momentum firing up (good for swing trade)
Red = Pullback (Red below histogram line is Downtrend)
Pink = Rebound (good for bottom catch / FIFO trade)
Dots
Gray = Expansion (can fire up or fire down)
Light Blue = Low compression
Dark Blue = Medium compression
Purple = High compression (sideways consolidation)
Fast MACD & Signal line crossover Green dot & cross-down Purple dot

Natural Market River [CC]The Natural Market River was created by Jim Sloman (Ocean Theory pgs 59-62) and this is another momentum indicator that is extremely similar to the previous indicator I published, the Natural Market Mirror . This has almost identical buy and sell signals but different way to handle calculations so I'm going to leave it up to you which one you will prefer. Since this is almost identical, the buy and sell signals work in the same way with both strong signals and normal ones. Buy when the line turns green and sell when it turns red.
Let me know what other indicators you would like to see me publish!

Natural Market Mirror [CC]The Natural Market Mirror was created by Jim Sloman (Ocean Theory pgs 49-57) and this is a continuation of my series from Jim Sloman's indicators. This indicator is also a momentum indicator and is very similar to the previous indicator I published, the Ocean Indicator and of course this indicator is built using ideas from the Ocean indicator. It may just be my opinion but I feel like this indicator provides better buy and sell signals in comparison. I built this using strong buy and sell indicators in addition to normal ones so darker colors are the strong signals and lighter colors are the normal signals. Buy when the line turns green and sell when it turns red.
Let me know what other indicators you would like me to publish!
Momentum Performance This Indicator displays the momentum (performance) of the symbol in percent.
You can compare the performance with other symbols.
The default benchmarks are the S&P 500, the MSCI World and the FTSE All World EX US.
The default length corresponds to one year in the timeframes monthly, weekly and daily.
In intraday the default length is 200, but you can also set your own setting.
You have also the opportunity to display a average momentum performance of the main symbol.

Imbalance FinderImbalance Finder
I struggled to always see it visually this marks whether there is or isn't imbalance
Very quick way of finding imbalance between bars

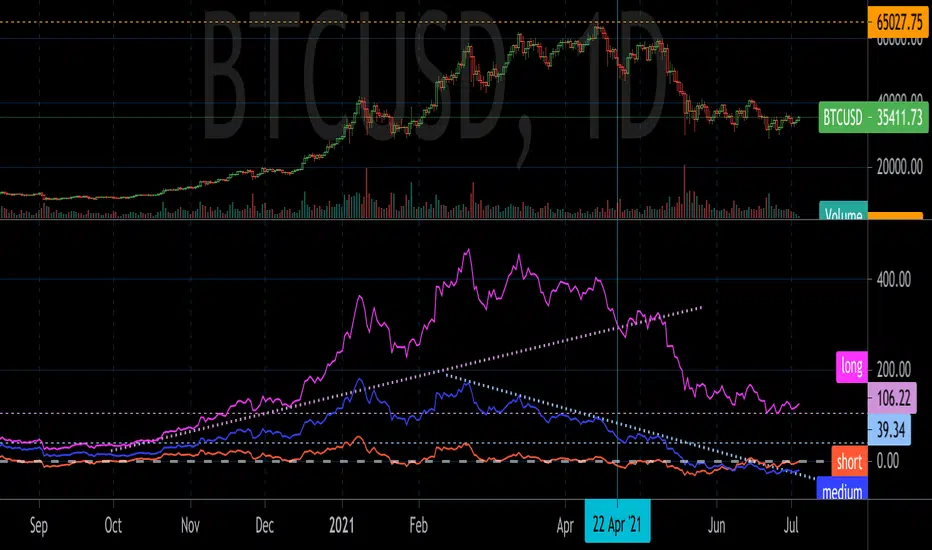
GD MomentumGD Momentum plots short, medium, and long term momentum indicators. The indicators are inspired by momentum structural analysis techniques, and are the % above or below different moving averages. The short term plot is the % above or below the 30 unit moving average, medium is 200 units, and long is 1000 units.
Draw trend lines and horizontal lines to identify the momentum structure and detect trend changes before they show up in price action.
Triple Stochastic RSITriple Stochastic RSI
As the name suggests, this indicator is a combination of three stochastic RSI indicators on three different time frames.
It will flash green when all three stochastics are in the lower range specified in the settings (signaling a possible bottom) and will flash red when all three stochastics are in the upper range(signaling a possible top). The bottom and top thresholds are user-configurable, as well as the timeframes for each stochastic and the standard stochastic settings.
Use this indicator on the lowest timeframe specified in the settings or you may get unexpected results.
