StocksDeveloper_AutoTraderWebLibrary "StocksDeveloper_AutoTraderWeb"
AutoTrader Web trading API functions implementation for Trading View.
preparePlaceOrderJson(account, symbol, group, variety) Prepare a place order json
Parameters:
account : Pseudo or group account number
symbol : AutoTrader Web's stock/derivative symbol
group : Set it to true to use group account (Default: false)
variety : Variety (Default: REGULAR)
Returns: A json message for the given order data
preparePlaceOrderAlertUsingOrderJson(orderJsonArray) Prepare a place order alert message using order json array
Parameters:
orderJsonArray : Order json can contain one or more orders
Returns: A complete alert message to place orders
preparePlaceOrderAlertMessage(account, symbol, group, variety, validity) Prepare a place order alert json message
Parameters:
account : Pseudo or group account number
symbol : AutoTrader Web's stock/derivative symbol
group : Set it to true to use group account (Default: false)
variety : Variety (Default: REGULAR)
validity : Validity (Default: DAY)
Returns: A complete alert message to place orders
ابحث في النصوص البرمجية عن "BOS"
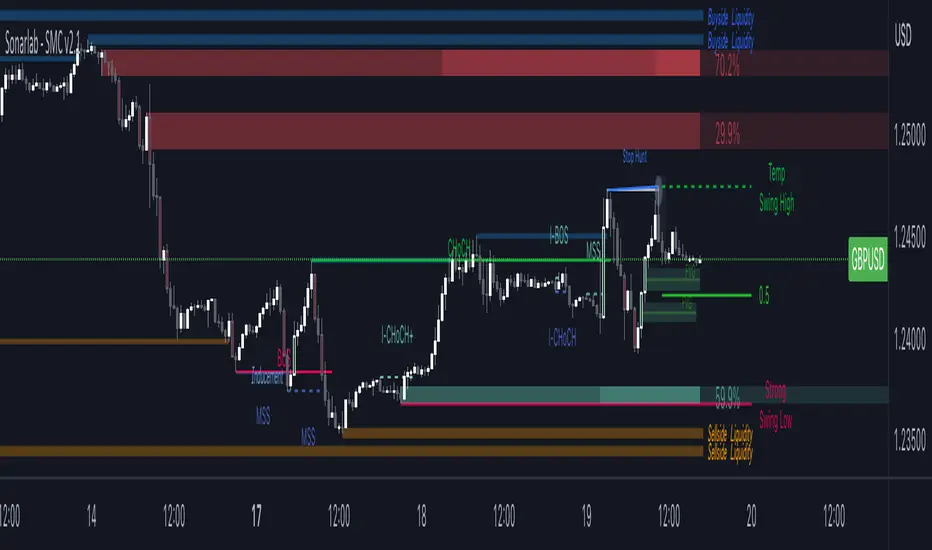
Sonarlab - Smart Money ConceptsSupply and Demand is one of the core strategies used in trading. It focuses on the ancient laws of supply and demand and how price moves in a free-flowing market. Supply and demand zones are a popular analysis technique used in all kinds of trading styles. The zones are the periods of sideways price action that come before explosive price moves, and are typically marked out using a box. We wanted to make these squares drawn automatically for you - so it will save you time spotting the zones.
Green Box
The green box defines demand - in these areas you will look for long opportunities. You can also use these zones for take profit levels when you are in a sell trade.
Blue Box
The blue box defines supply - in these areas you will look for short opportunities. You can also use these zones for take profit levels when you are in a buy trade.
Break of structure
For markets to move up and down a break in market structure must occur. A break in market structure occurs when the market begins to shift direction and break the previous HH and HL or HL and LL of the market. We also integrated the feature that you can see the BOS lines. In the indicator settings you can adjust the values:
1) Sensitivity
2) Min. candles in structure
3) BOS type: close or wick
Warning Never blindly take a position on each box - wait for a proper signal to occur before considering a position.
Comprehensive Market AnalyzerVERSION 2.0:
Notice to users: To better reflect its extensive features, this indicator has been renamed from "Tsūrubokkusu (Toolbox) 🧰" to "Comprehensive Market Analyzer". Thank you for your understanding and adaptation to this change.
Purpose and Usage:
The Comprehensive Market Analyzer is designed to provide traders with a holistic view of market conditions by integrating various technical indicators into a single,
cohesive tool. Each indicator has been carefully selected and improved to work together, offering enhanced customization and advanced market insights.
This combination allows for more comprehensive market analysis, improved decision-making, and efficient trading strategies.
📘 Machine Learning Integration
Purpose : Utilizes machine learning algorithms to analyze past market data and provides predictive insights based on historical data.
Usage : Activate machine learning features, set lookback windows, influence weighting, and start bar for improved trend predictions.
Activate Machine Learning :
Description : Enables advanced machine learning features that analyze past market data.
Details : This feature allows the algorithm to use historical data to forecast market movements, providing traders with enhanced predictive insights on historical data.
Kernel Lookback Window :
Description : Sets the number of previous bars that the algorithm will analyze.
Details : A higher number provides a broader view of market trends, while a lower number makes the model more sensitive to recent changes.
Kernel Influence Weighting :
Description : Adjusts the emphasis on recent versus older data.
Details : Increasing this value gives more importance to recent data, potentially making predictions more responsive to new trends.
Kernel Calculation Start Bar :
Description : Specifies the bar number from which to start the machine learning calculations.
Details : Avoids early data which may contain excessive noise and less reliable market signals.
Kernel Functions :
Gaussian Kernel :
Description : Uses a Gaussian distribution to weight historical data, focusing on more recent data points for trend analysis.
Details : Calculates weights based on the Gaussian distribution, emphasizing data points closer to the present.
Laplacian Kernel :
Description : Applies Laplacian distribution, emphasizing data points closer to the current time more heavily.
Details : Uses the Laplacian function to provide a different perspective on data weighting.
RBF Kernel :
Description : Utilizes a Radial Basis Function for smoothing and analyzing data, providing a different approach to trend prediction.
Details : Applies the RBF function to smooth data and enhance the accuracy of trend predictions.
Wavelet Kernel :
Description : Applies wavelet transform for analyzing frequency components, helping to detect patterns in the price movements.
Details : Uses wavelet-based calculations to focus on specific frequency components within the data, aiding in pattern recognition.
📘 Enhanced Ichimoku Kinkō Hyō Integration
Purpose : Provides a comprehensive overview of market trends and momentum using the Ichimoku Kinkō Hyō indicator.
Usage : Display various components of the Ichimoku Kinkō Hyō, customize their appearance, provides additional calculations for trend analysis.
Display Ichimoku Kinkō Hyō :
Description : Toggle to show or hide the Ichimoku Kinkō hyō indicator.
Details : This indicator helps traders see support and resistance levels, trend direction, and potential future movements.
Activate Heikin-Ashi Source :
Description : Switches between regular price data and Heikin-Ashi candles for analysis.
Details : Heikin-Ashi candles smooth price data, making trends easier to spot.
Display Tenkan-Sen Line :
Description : Shows the Tenkan-Sen line, a key short-term trend indicator.
Color Customization : Set the color of the Tenkan-Sen line for better visibility.
Minimum Length : Determine the shortest period for calculating the Tenkan-Sen line.
Maximum Length : Determine the longest period for calculating the Tenkan-Sen line.
Dynamic Length Adjustment : Automatically adjusts the length of the Tenkan-Sen based on market conditions.
Display Kijun-Sen Line :
Description : Shows the Kijun-Sen line, a key medium-term trend indicator.
Color Customization : Set the color of the Kijun-Sen line for better visibility.
Minimum Length : Determine the shortest period for calculating the Kijun-Sen line.
Maximum Length : Determine the longest period for calculating the Kijun-Sen line.
Dynamic Length Adjustment : Automatically adjusts the length of the Kijun-Sen based on market conditions.
Kijun-Sen Divider Tool : Adjust the sensitivity of the Kijun-Sen calculation.
Display Chikou Span :
Description : Shows the Chikou Span, which lags behind the current price to help confirm trends.
Bear Phase Color : Set the color for bearish periods.
Bull Phase Color : Set the color for bullish periods.
Consolidation Color : Set the color for consolidation periods.
Minimum Length : Determine the shortest lag period for the Chikou Span.
Maximum Length : Determine the longest lag period for the Chikou Span.
Dynamic Length Adjustment : Automatically adjusts the length of the Chikou Span based on market conditions.
Display Senkou Span A and B :
Description : Shows the Senkou Span A and B, which form the Ichimoku Cloud indicating future support and resistance levels.
Bear Color : Set the color for bearish clouds.
Bull Color : Set the color for bullish clouds.
Neutral Color : Set the color for neutral periods.
Minimum Length : Determine the shortest period for calculating the Senkou Span.
Maximum Length : Determine the longest period for calculating the Senkou Span.
Dynamic Length Adjustment : Automatically adjusts the length of the Senkou Span based on market conditions.
Projection Offset : Set how far ahead the Senkou Span is projected.
Kumo Cloud Settings :
Enable Kumo Cloud Fill : Toggle to fill the space between Senkou Span A and B with color.
Cloud Fill Transparency : Adjust the transparency of the cloud fill.
Apply WMA Smoothing :
Description : Smooths the indicator lines using a Weighted Moving Average to clarify trends.
Bar Coloring Based on Ichimoku Signals :
Description : Colors the bars based on Ichimoku signals to provide a quick visual indication of market sentiment.
Bearish Signal Bar Color : Set the color for bars during bearish signals.
Bullish Signal Bar Color : Set the color for bars during bullish signals.
Consolidation Signal Bar Color : Set the color for bars during consolidation periods.
Neutral Bar Color : Set the color for bars during neutral conditions.
Enhanced Calculations :
Heikin Ashi Values : Smooths price movements to make trends more visible.
Alternative Source Calculation : Uses a different method for calculating the indicator based on user settings.
Volume Calculations : Enhanced functions for calculating volume based on different candlestick patterns.
Dynamic Length Adjustment : Automatically adjusts the length of Ichimoku components based on market volatility.
Gaussian Kernel Calculations : Uses advanced calculations for smoother and more accurate trend analysis.
Chikou Span Adaptation : Improved calculation for the Chikou Span using dynamic lengths and advanced methods.
Visual Enhancements : Adds color gradients to the Senkou Span and dynamic coloring for the Chikou Span to improve trend visibility.
Plotting Ichimoku Components :
Tenkan-Sen : Plots the Tenkan-Sen line with dynamic adjustments.
Kijun-Sen : Plots the Kijun-Sen line with dynamic adjustments.
Senkou Span A and B : Plots these lines with dynamic projections and advanced smoothing.
Chikou Span : Plots the Chikou Span with dynamic offsets and coloring.
📘 Enhanced Candlestick Patterns Integration
Purpose : Identifies and displays various candlestick patterns to help traders spot key market movements and potential reversals.
Usage : Toggle the display of patterns, select specific pattern types, and customize pattern labels for improved visual analysis.
Display Patterns :
Description : Toggle to enable or disable the display of all candlestick patterns.
Details : When enabled, all selected candlestick patterns will be displayed on the chart, aiding traders in identifying key market movements and potential reversals.
Select Pattern Type :
Description : Select the type of candlestick patterns to detect.
Details : Options include Bullish (indicating potential upward trends), Bearish (indicating potential downward trends), or Both.
Trend Filter Method :
Description : Select the method to filter trends.
Details : Options include True Range (based on price range), Fractals, Volume, Combined, or None (no filtering).
Pattern Label Colors :
Bullish Pattern Color : Choose the color for labeling Bullish patterns, indicating potential upward trends.
Bearish Pattern Color : Choose the color for labeling Bearish patterns, indicating potential downward trends.
Indecision Pattern Color : Choose the color for labeling Indecision patterns, indicating no clear trend direction.
Base Line and Patterns Display Options :
Show Base Line in Place of Labels : Toggle to display a base line instead of labels for detected patterns. This helps visualize the general trend.
Show Counterattack Lines : Toggle to display Counterattack Lines patterns, indicating potential reversal points.
Show Dark Cloud Cover : Toggle to display Dark Cloud Cover patterns, a bearish pattern suggesting a potential reversal from an uptrend to a downtrend.
Show Engulfing Patterns : Toggle to display Engulfing patterns. Bullish Engulfing patterns suggest a potential upward reversal, while Bearish Engulfing patterns suggest a potential downward reversal.
Show Hammer Patterns : Toggle to display Hammer patterns, a bullish pattern indicating a potential reversal from a downtrend to an uptrend.
Show Hanging Man Patterns : Toggle to display Hanging Man patterns, a bearish pattern indicating a potential reversal from an uptrend to a downtrend.
Show Harami Patterns : Toggle to display Harami patterns. Bullish Harami patterns suggest a potential upward reversal, while Bearish Harami patterns suggest a potential downward reversal.
Show In-Neck Patterns : Toggle to display In-Neck patterns, indicating a potential continuation of the current trend.
Show On-Neck Patterns : Toggle to display On-Neck patterns, indicating a potential continuation of the current trend.
Show Piercing Patterns : Toggle to display Piercing patterns, a bullish pattern suggesting a potential reversal from a downtrend to an uptrend.
Show Three Black Crows : Toggle to display Three Black Crows patterns, a bearish pattern suggesting a potential reversal from an uptrend to a downtrend.
Show Thrusting Patterns : Toggle to display Thrusting patterns, a bearish pattern suggesting a potential continuation of the downtrend.
Show Upside Gap Two Crows : Toggle to display Upside Gap Two Crows patterns, a bearish pattern suggesting a potential downward reversal after an upward gap.
Show Evening Star : Toggle to display Evening Star patterns, a bearish pattern suggesting a potential reversal from an uptrend to a downtrend.
Show Inverted Hammer : Toggle to display Inverted Hammer patterns, a bullish pattern suggesting a potential reversal from a downtrend to an uptrend.
Show Morning Star : Toggle to display Morning Star patterns, a bullish pattern suggesting a potential reversal from a downtrend to an uptrend.
Show Shooting Star : Toggle to display Shooting Star patterns, a bearish pattern suggesting a potential reversal from an uptrend to a downtrend.
Show Doji Patterns : Toggle to display Doji patterns, indicating market indecision and potential reversals.
Show Dragonfly Doji : Toggle to display Dragonfly Doji patterns, a bullish pattern suggesting a potential reversal from a downtrend to an uptrend.
Show Evening Doji Star : Toggle to display Evening Doji Star patterns, a bearish pattern suggesting a potential reversal from an uptrend to a downtrend.
Show Gravestone Doji : Toggle to display Gravestone Doji patterns, a bearish pattern suggesting a potential reversal from an uptrend to a downtrend.
Show Long-Legged Doji : Toggle to display Long-Legged Doji patterns, indicating high market indecision and potential reversals.
Show Morning Doji Star : Toggle to display Morning Doji Star patterns, a bullish pattern suggesting a potential reversal from a downtrend to an uptrend.
Show Rising Three Methods : Toggle to display Rising Three Methods patterns, a bullish pattern suggesting a continuation of the uptrend.
Show Falling Three Methods : Toggle to display Falling Three Methods patterns, a bearish pattern suggesting a continuation of the downtrend.
Show Tasuki Patterns : Toggle to display Tasuki patterns, indicating potential trend continuation after a gap.
Show Marubozo : Toggle to display Marubozo patterns, indicating strong trend continuation, either bullish or bearish.
Show Long Lower Shadow : Toggle to display Long Lower Shadow patterns, indicating strong buying pressure and potential upward movement.
Show Long Upper Shadow : Toggle to display Long Upper Shadow patterns, indicating strong selling pressure and potential downward movement.
Show Three Inside Up/Down : Toggle to display Three Inside Up/Down patterns, indicating potential bullish or bearish reversals.
Show Kicker Pattern : Toggle to display Kicker patterns, indicating significant potential reversals.
Show Tweezer Tops/Bottoms : Toggle to display Tweezer Tops/Bottoms patterns, indicating potential reversals at the tops or bottoms.
Show Mat Hold Pattern : Toggle to display Mat Hold patterns, a bullish pattern suggesting a continuation of the uptrend.
Candle Body/Shadow Comparison Options :
Candle Body/Shadow Comparison : Choose the criteria to compare candle sizes: Shadows (larger shadows), Body (larger body), Both (larger shadows and body), Either (larger shadows or body), or None (no comparison).
Look-back Period for Candle Comparison : Specify the number of periods to look back when comparing the current candle size to determine if it is significant.
Period for Body Length Average : Specify the period for calculating the average body length of candles to help identify significant patterns.
Period for Candle Length Average : Specify the period for calculating the average length of candles to help identify significant patterns.
Specific Pattern Thresholds :
Doji Body Percentage Threshold : Set the percentage threshold for identifying Doji patterns based on the candle body size compared to its range.
Upper Shadow Percentage Limit : Set the maximum allowed upper shadow percentage of the candle’s range for identifying specific Doji patterns.
Lower Shadow Percentage Limit : Set the maximum allowed lower shadow percentage of the candle’s range for identifying specific Doji patterns.
Price Deviation Tolerance : Specify the price deviation tolerance for pattern recognition, which helps in identifying patterns within a certain price range.
Thrusting Neck Percentage : Set the percentage threshold for identifying Thrusting Neck patterns, indicating a potential continuation of the current trend.
Base Line Settings :
Base Line EMA Length : Specify the length of the EMA for the Base Line, helping to visualize the general trend.
Enhanced Calculations :
Wavelet Transform : If machine learning is enabled, calculates the wavelet transform for smoother and more accurate pattern detection.
Candle Body and Shadows Calculation : Detailed calculations for candle body and shadow lengths to improve pattern detection.
Average Calculations : Calculate averages for body and candle sizes to help identify significant patterns.
Fractals Calculation : Identify fractal highs and lows to aid in trend detection.
Trend Filters : Apply user-selected trend filters based on True Range, Fractals, Volume, or a combination.
Pattern Detection and Labeling : Detects and labels various candlestick patterns, including Doji, Engulfing, Hammer, and more, with options for displaying labels or base lines.
Alerts and Notifications : Set alerts for detected patterns and base line colors to notify traders of significant market events.
Plotting Candlestick Patterns :
Pattern Detection : Automatically detects and labels various candlestick patterns based on user settings.
Label Customization : Customize the labels for different patterns, including color and text.
Base Line Plotting : Option to plot a base line instead of labels for detected patterns, enhancing trend visualization.
Alerts for Patterns : Set alerts for detected patterns to keep traders informed of significant market changes.
📘 Enhanced Fibonacci Retracement Integration
Purpose : Provides a tool for identifying potential support and resistance levels using Fibonacci retracement.
Usage : Toggle the display of Fibonacci levels, adjust the lookback period, and customize the appearance of Fibonacci levels for better market analysis.
Auto Mode :
Description : Toggle to enable or disable automatic detection of price points.
Details : When enabled, the highest and lowest price points within a specified period will be automatically detected to set Fibonacci levels. Disable to manually set the top and bottom prices.
Period :
Description : Set the lookback period for detecting price points.
Details : Defines the number of bars to look back when detecting the highest and lowest prices in Auto Mode, used for calculating Fibonacci levels.
Manual Top :
Description : Manually set the top price level.
Details : Adjust this setting to reflect the peak price of interest when Auto Mode is disabled.
Manual Bottom :
Description : Manually set the bottom price level.
Details : Adjust this setting to reflect the low price of interest when Auto Mode is disabled.
Display Fibonacci :
Description : Toggle to show or hide Fibonacci retracement levels.
Details : When enabled, the calculated Fibonacci levels will be displayed on the chart, overlaying the price data.
Baseline Levels :
Description : Select Fibonacci levels to highlight as baselines.
Details : Choose specific levels to be visually distinct, emphasizing their significance in the analysis.
Fibonacci Levels Colors :
Upper Levels Color : Set the color for Fibonacci levels above the baseline, indicating potential resistance levels.
Lower Levels Color : Set the color for Fibonacci levels below the baseline, indicating potential support levels.
Baseline Levels Color : Set the color for highlighted baseline Fibonacci levels, making them stand out from other levels.
Display Individual Fibonacci Levels :
Show Level : Toggle to enable or disable the display of specific Fibonacci levels.
Level Value : Set the multiplier used to calculate each specific Fibonacci level relative to the price range.
Reverse Levels :
Description : Toggle to switch the calculation direction of Fibonacci levels.
Details : When enabled, levels are calculated in reverse, useful for analyzing downtrends.
Line Extension :
Description : Choose how Fibonacci level lines are extended on the chart.
Details : Options include extending lines to the left, right, or both, affecting their visual presentation.
Text Size :
Description : Adjust the font size of the labels for Fibonacci levels.
Details : Options range from large to tiny, allowing for readability adjustments according to user preference.
Line Style :
Description : Select the line style for Fibonacci levels.
Details : Options include solid, dotted, and dashed, providing visual distinction.
Line Width :
Description : Set the thickness of the Fibonacci level lines.
Details : A higher value makes the lines more prominent on the chart.
Baseline Line Style :
Description : Choose the line style specifically for the baseline levels.
Details : This can differ from other Fibonacci levels to emphasize their importance.
Baseline Line Width :
Description : Adjust the thickness of the baseline level lines.
Details : Can be set differently from other levels for visual emphasis.
Enhanced Calculations :
Automatic and Manual Top/Bottom Setup : Detect or manually set the highest and lowest price points.
Price Range Calculation : Determine the range between the highest and lowest prices.
Fibonacci Level Values : Calculate the values for each Fibonacci level.
Visual and Label Configuration : Configure visual aspects and labels for each level.
Plotting and Labeling :
Level Plotting :
Description : Plot each Fibonacci level on the chart.
Details : Draw lines representing each calculated level.
Label Customization :
Description : Customize the labels for Fibonacci levels.
Details : Include text, colors, and positioning for clarity.
📘 Supports and Resistances Integration
Purpose : Identifies key support and resistance levels to aid in market analysis.
Usage : Toggle the display of support and resistance lines, customize their appearance, and use Bollinger Bands for additional insights.
Display Supports and Resistances :
Description : Toggle to enable or disable the display of support and resistance lines.
Details : When enabled, support and resistance lines will be shown on the chart, providing key levels for market analysis.
Swing Period :
Description : Set the retrospective period for identifying swing points.
Details : A longer period captures more significant trends but may reduce sensitivity. The default value is 10.
Support Line Color :
Description : Set the color for support lines.
Details : Choose a color that enhances chart readability. Default is green.
Resistance Line Color :
Description : Set the color for resistance lines.
Details : Choose a color that makes resistance lines easily distinguishable. Default is red.
Trend-Based Line Color :
Description : Toggle to enable dynamic coloring based on trend direction.
Details : When enabled, the color of the lines will change according to the trend, aiding visual analysis.
Line Thickness :
Description : Adjust the thickness of the support and resistance lines.
Details : Choose a thickness value between 1 and 5 for better visibility.
Line Style :
Description : Select the style of the lines.
Details : Options include Solid, Dotted, or Dashed lines for visual distinction.
Number of Lines to Display :
Description : Set the maximum number of support/resistance lines to display.
Details : Adjust the number of lines to avoid clutter or to show more levels.
Display Bollinger Bands :
Description : Toggle to show or hide Bollinger Bands on the chart.
Details : Bollinger Bands provide a visual representation of volatility and potential price ranges.
Bollinger Bands Integration :
Description : Enable the integration of Bollinger Bands for S/R calculation.
Details : This feature adjusts the placement of S/R lines based on the market volatility captured by the Bollinger Bands.
Bollinger Bands Color Settings :
Description : Set colors for different Bollinger Band conditions.
Details :
Green: Prices above the median but below the upper band (potential overbought area).
Dark green: Prices above the upper band (strong upward momentum).
Light red: Prices below the median but above the lower band (potential oversold area).
Dark red: Prices below the lower band (strong downward momentum).
Fill Opacity Adjustment :
Description : Adjust the fill opacity between Bollinger Bands.
Details : Set the opacity level to balance visibility with other chart elements.
BB Sensitivity Level :
Description : Adjust the sensitivity for determining S/R levels near Bollinger Bands.
Details : A higher value increases the consideration of levels near the bands.
Band Width Multiplier :
Description : Control the width of the Bollinger Bands.
Details : Adjust the multiplier to expand or contract the bands based on market volatility.
Uniform BB Coloring :
Description : Apply a consistent color to Bollinger Bands.
Details : Simplify visual interpretation with a uniform color.
Plotting and Alerts :
Plotting Bollinger Bands :
Description : Plot the Bollinger Bands on the chart.
Details : The bands are colored based on the conditions set for market volatility and price ranges.
Alerts and Notifications :
Description : Set alerts for support/resistance breaks and Bollinger Band breakouts.
Details : Notify traders of significant market events related to these levels.
📘 Enhanced Trend Lines Integration
Purpose : Identifies and plots trend lines based on market structure to help traders understand market direction and potential buy/sell points.
Usage : Toggle the display of trend lines, customize their appearance, and use enhanced calculations for trend analysis.
Display Trend Lines :
Description : Enable or disable the display of trend lines on the chart.
Details : These trend lines are calculated based on market structure, specifically through the detection of Breaks of Structure (BOS). If enabled, the trend lines will help in identifying the market overall trend and potential buy and sell points.
Trend Line Colors :
Upper Line Color : Set the color for the upper trend lines to enhance visual distinction.
Lower Line Color : Set the color for the lower trend lines, aiding in easy identification of support levels.
Pivot Labels :
Show Pivots Labels : Control the display of pivot labels on the chart.
Pivot Label Size : Select the size of the pivot labels displayed on the chart. Options include Tiny, Small, Normal, Large, and Huge.
Trend Line Calculations :
Pivot Depth : Adjust the depth for pivot calculation based on the selected timeframe to capture significant price movements.
Pivot Deviation : Set the deviation for pivot calculation to identify key turning points.
Pivot Backstep : Define the backstep for pivot calculation to ensure accurate detection of pivot points.
Enhanced Calculations :
Market Structure Detection : Utilize advanced algorithms to identify key market structures, improving trend line accuracy.
Adaptive Parameters : Automatically adjust pivot depth, deviation, and backstep based on the selected timeframe for better relevance.
Zigzag Calculation : Implement zigzag patterns to dynamically adjust trend lines, ensuring they reflect current market conditions.
Slope and Intercept Calculation : Compute the slope and intercept for trend lines to enhance precision in trend detection.
Dynamic Updates : Continuously update trend lines as new data becomes available, ensuring real-time accuracy.
Alerts and Notifications : Set alerts for new high and low pivots, as well as for when the price crosses upper or lower trend lines, keeping traders informed of significant market changes.
Plotting Trend Lines :
Trend Line Plotting : Automatically draw trend lines based on detected BOS, helping traders visualize the market trend.
Diagonal Support/Resistance Lines : Plot diagonal lines to indicate support and resistance levels, enhancing the understanding of market dynamics.
Pivot Label Customization : Customize pivot labels for clear identification of high and low points in the trend.
Alerts for Trend Lines : Set alerts for when price crosses trend lines, ensuring timely notifications of potential trading opportunities.
📘 Enhanced Linear Regression Integration
Purpose : Uses linear regression to analyze price movements and identify trends.
Usage : Display the linear regression projection line, customize its appearance, and use enhanced calculations for better trend analysis.
Display Projection Line :
Description : Toggle to display or hide the linear regression projection line on the chart.
Details : This line represents the best fit line that predicts future prices based on historical data.
Data Source :
Description : Select the data source for the linear regression projection.
Details : This is typically the closing price but can be any price point such as open, high, or low. The selected source will be used to calculate the linear regression projection line.
Trend-Based Line Color :
Enable Trend-Based Line Color : Toggle to automatically color the projection line based on the trend direction. When enabled, the line will be red for a downward trend and green for an upward trend, providing a visual indication of market direction.
Uptrend Line Color : Select the color for the projection line when the trend is upward. This color will be used when "Enable Trend-Based Line Color" is active.
Downtrend Line Color : Select the color for the projection line when the trend is downward. This color will be used when "Enable Trend-Based Line Color" is active.
Enhanced Calculations :
Standard Deviation Calculation : Calculate the standard deviation for a given length to understand the volatility around the linear regression line.
Pearson's Correlation Calculation : Compute Pearson's R to measure the strength of the linear relationship between the price points and the linear regression line.
Slope and Intercept Calculation : Calculate the slope and intercept for the regression line, providing the basis for the projection.
Kernel Application : Optionally apply the RBF Kernel to the selected source data for smoothing and enhancing the regression calculations.
Dynamic Length Selection : Automatically select the optimal regression period based on the highest Pearson's R value, ensuring the most accurate trend representation.
Real-Time Updates : Continuously update the regression line and related calculations as new data becomes available, maintaining accuracy in real-time.
Alerts and Notifications : Set alerts for when the price crosses the linear regression projection line, notifying traders of significant market events.
Plotting Linear Regression Components :
Projection Line Plotting : Automatically draw the linear regression projection line based on historical data and the selected data source.
Label Customization : Customize the label for the projection line, including color and text, for clear identification on the chart.
Alerts for Projection Line : Set alerts for when the price crosses the projection line, ensuring timely notifications of potential trading opportunities.
📘 POC Analysis Integration
Purpose : Identifies the Point of Control (POC) to highlight price levels with the highest trading volume.
Usage : Toggle the display of the POC, customize its appearance, and use enhanced calculations for better market analysis.
Display POC :
Description : Toggle to display or hide the Point of Control (POC) on the chart.
Details : The POC is the price level at which the highest volume of trading occurred, indicating a focal point of market activity.
Data Source :
Description : Select the price source for POC analysis.
Details : This is typically the closing price but can be any price point such as open, high, or low. The selected source will be used to calculate the POC.
POC Line Colors :
Color Above POC : Set the line color when the closing price is above the POC.
Color Below POC : Set the line color when the closing price is below the POC.
Width Multiplier :
Description : Adjust the width around the price for POC analysis.
Details : A higher value broadens the calculation range.
POC Calculation and Visualization :
Price Level Initialization : Calculate the initial spacing between price levels based on the first candlestick and user settings.
Volume Data Accumulation : Accumulate volume data at specified price levels for each candlestick to determine the POC.
Dynamic Array Expansion : Expand price levels array to accommodate new price data outside the current range.
POC Determination : Determine and visualize the POC at the last candlestick if enabled by the user.
Alerts and Notifications : Set alerts for when the price crosses the POC, notifying traders of significant market events.
Plotting POC Components :
POC Line Plotting : Automatically draw the POC line based on historical data and the selected data source.
Label Customization : Customize the label for the POC line, including color and text, for clear identification on the chart.
Alerts for POC : Set alerts for when the price crosses the POC, ensuring timely notifications of potential trading opportunities.
📘 Enhanced Divergences Integration
Purpose : Detects and displays divergences between price movements and indicators to identify potential reversal points.
Usage : Toggle the display of divergences, select data sources, customize divergence colors, and use enhanced calculations for better trend analysis.
Display Divergences :
Description : Toggle to display or hide the detected divergences on the chart.
Details : Divergences occur when the price movement of an asset and a related indicator (e.g., volume or momentum) move in opposite directions. They are used to identify potential reversal points in the market. Regular divergences signal possible reversals, while hidden divergences can indicate continuation.
Data Source :
Description : Defines the timeframe from which to fetch data for analysis.
Details : Typically lower than the chart current timeframe for multi-timeframe analysis.
Divergence Colors :
Bearish Divergence Color : Sets the color for bearish divergence lines. Bearish divergences typically suggest potential downward price movement.
Bullish Divergence Color : Sets the color for bullish divergence lines. Bullish divergences typically indicate potential upward price movement.
Pivot Bars :
Left Bars : Number of bars to the left of the pivot point to consider. Helps in identifying the pivot high or low by looking back these many bars.
Right Bars : Number of bars to the right of the pivot point to consider. Assists in confirming a pivot point by ensuring no higher high or lower low is present within this range.
Display Hidden Divergences :
Description : When enabled, this setting reveals hidden divergences on the chart.
Details : Hidden divergences are a subtler form of divergence that often signal continuation rather than reversal. A hidden bullish divergence occurs when price makes a higher low while the indicator makes a lower low, suggesting the continuation of an uptrend. Conversely, a hidden bearish divergence occurs when price makes a lower high while the indicator makes a higher high, indicating the continuation of a downtrend. These divergences are particularly useful for identifying the strength of the current trend.
Dynamic Line Width Based on Divergence Count :
Description : When enabled, adjusts the width of the divergence line dynamically based on the count of divergences detected.
Details : This provides visual emphasis on stronger signals.
Enhanced Calculations :
Standard Deviation Calculation : Calculate the standard deviation for a given length to understand the volatility around the linear regression line.
Pearson's Correlation Calculation : Compute Pearson's R to measure the strength of the linear relationship between the price points and the linear regression line.
Slope and Intercept Calculation : Calculate the slope and intercept for the regression line, providing the basis for the projection.
Kernel Application : Optionally apply the RBF Kernel to the selected source data for smoothing and enhancing the regression calculations.
Dynamic Length Selection : Automatically select the optimal regression period based on the highest Pearson's R value, ensuring the most accurate trend representation.
Real-Time Updates : Continuously update the regression line and related calculations as new data becomes available, maintaining accuracy in real-time.
Alerts and Notifications : Set alerts for when the price crosses the linear regression projection line, notifying traders of significant market events.
Plotting Divergence Components :
Divergence Line Plotting : Automatically draw divergence lines based on historical data and the selected data source.
Label Customization : Customize the label for the divergence lines, including color and text, for clear identification on the chart.
Alerts for Divergences : Set alerts for when a divergence is detected, ensuring timely notifications of potential trading opportunities.
📘 Enhanced Average True Range Integration
Purpose : Measures market volatility using the Average True Range (ATR) to assist in identifying potential buy and sell points.
Usage : Set the ATR period, minimum tick filter, upper and lower coefficients, and customize ATR colors for better market analysis.
Show Labels :
Description : Enable or disable the display of labels for the Average True Range (ATR) indicator.
Details : This option controls whether the ATR signals (buy and sell) are shown on the chart with respective labels.
ATR Period :
Description : Sets the period for calculating the Average True Range (ATR).
Details : The ATR measures market volatility by calculating the average range of price movement over a specified period. A shorter period makes the ATR more sensitive to recent price movements, while a longer period smooths out short-term volatility.
Minimum Tick Filter :
Description : Sets the minimum tick filter for buy and sell signals.
Details : This filter ensures that the price movement is significant enough to be considered a valid signal. For example, a value of 20 means that the price must move at least 20 ticks from the open to the close to generate a signal.
Upper Coefficient :
Description : Sets the upper coefficient for band calculation.
Details : This value adjusts the sensitivity of the upper band used to detect high points. A higher coefficient makes the band wider, capturing more significant price movements, while a lower coefficient makes the band narrower, making it more sensitive to smaller price changes.
Lower Coefficient :
Description : Sets the lower coefficient for band calculation.
Details : This value adjusts the sensitivity of the lower band used to detect low points. A higher coefficient makes the band wider, capturing more significant price movements, while a lower coefficient makes the band narrower, making it more sensitive to smaller price changes.
ATR Colors :
Bullish Color : Sets the color for the bullish signal, helping to visually distinguish bullish trends.
Bearish Color : Sets the color for the bearish signal, helping to visually distinguish bearish trends.
Enhanced Calculations :
Dynamic Coefficient Calculation : Calculates dynamic coefficients based on market volatility, adjusting the sensitivity of ATR bands accordingly.
Band Calculation : Computes high and low bands using dynamic coefficients to detect significant price movements.
High/Low Point Detection : Identifies potential high and low points based on ATR band calculations and price thresholds.
Real-Time Updates : Continuously updates ATR calculations and signals as new data becomes available, ensuring accuracy in real-time.
Plotting ATR Components :
Signal Plotting : Plots bullish and bearish ATR signals on the chart based on calculated conditions.
Label Customization : Customize the labels for ATR signals, including color and text, for clear identification on the chart.
Alerts for Signals : Set alerts for detected bullish and bearish signals, ensuring timely notifications of potential trading opportunities.
📘 Enhanced ATR Visualization Parameters
Purpose : Provides a visual representation of market volatility using the ATR Strength Meter.
Usage : Toggle the display of the ATR Strength Meter, set thresholds, and customize its appearance for better market analysis.
Display ATR Strength Meter :
Description : Toggle to display or hide the ATR Strength Meter, a visual representation of market volatility.
Details : The meter is based on the Average True Range (ATR) and helps identify volatility trends.
High ATR Threshold :
Description : Set the threshold for high volatility.
Details : ATR values above this threshold indicate increased market volatility.
Low ATR Threshold :
Description : Set the threshold for low volatility.
Details : ATR values below this threshold indicate decreased market volatility.
Progression Bar Position :
Description : Select the position of the ATR Strength Meter on the chart.
Details : Options are "Top" or "Bottom", affecting where the volatility meter is displayed relative to price action.
Progress Bar Length :
Description : Set the horizontal length of the ATR Strength progression bar.
Details : Adjust to increase or decrease the bar's width, accommodating different chart sizes and user preferences.
Enhanced Calculations :
ATR Strength Calculation : Calculate the ATR strength to measure market volatility.
Dynamic Coefficients : Use dynamic coefficients based on volatility for more accurate calculations.
Progress Bar Calculation : Determine the position and color of the progression bar based on ATR strength.
Label Positioning : Dynamically position labels for minimum and maximum values to avoid overlap.
Plotting ATR Strength Meter :
Progression Bar Plotting : Plot the progression bar to represent the ATR strength.
Label Customization : Customize labels for the ATR strength, minimum, and maximum values.
📘 Enhanced Relative Strength Index Integration
(A special thanks to RumpyPumpyDumpy for allowing the private reuse of his script.)
Purpose : Measures market momentum using the Relative Strength Index (RSI) and Stochastic RSI to assist in identifying potential buy and sell points.
Usage : Set the RSI and StochRSI parameters, toggle the display of the RSI Meter, and customize its appearance for better market analysis.
RSI Calculation Parameters :
RSI Length : Defines the length of the RSI calculation.
Details : A longer period captures more data points but may reduce sensitivity.
RSI Overbought Level : Sets the overbought level for RSI.
Details : Values above this level indicate overbought conditions.
RSI Oversold Level : Sets the oversold level for RSI.
Details : Values below this level indicate oversold conditions.
StochRSI Length : Defines the length of the StochRSI calculation.
Details : A longer period captures more data points but may reduce sensitivity.
StochRSI %K Length : Defines the length of the %K line of the StochRSI.
StochRSI %D Length : Defines the length of the %D line (SMA of %K) of the StochRSI.
RSI Visualization Parameters :
Display RSI Meter : Toggle the display of the RSI Meter on the chart.
RSI Meter Size : Adjust the size of the RSI Meter displayed on the chart.
Details : Measured as the diameter of the meter. Increase the value for larger display size, enhancing visibility and making it easier to read the RSI trend at a glance.
Horizontal Offset : Move the RSI Meter horizontally across the chart.
Details : Positive values shift the meter to the left, allowing for placement adjustments relative to the chart's current view or specific visual preferences.
RSI Meter Components :
Sectors and Ticks : Draw sector arcs and tick marks around the RSI Meter to represent different RSI levels and thresholds.
Needle : Draw the needle on the RSI Meter to indicate the current RSI value.
Sector Labels : Label each sector of the RSI Meter to indicate market conditions like "Strong Buy," "Buy," "Neutral," "Sell," and "Strong Sell."
Title Label : Draw the title label for the RSI Meter displaying the RSI value and its period.
Enhanced Calculations :
RSI Calculation : Calculate the RSI using the built-in function with the specified length and source.
StochRSI Calculation : Calculate StochRSI values using the specified lengths for RSI, %K, and %D.
Dynamic Line Management : Efficiently manage and update dynamically created line objects to prevent potential memory leaks.
Optimized Sector and Needle Drawing : Enhanced the drawing functions for sectors, needles, and ticks to improve visual clarity and performance.
Plotting RSI Meter :
Sector Plotting : Draw the sectors on the RSI Meter using specified colors and widths to represent different RSI levels and thresholds.
Needle Plotting : Plot the needle on the RSI Meter based on the calculated RSI value to visually indicate the current RSI level.
Tick Plotting : Plot tick marks around the RSI Meter to denote key RSI levels and thresholds for better readability.
Label Plotting : Draw sector labels and a title label on the RSI Meter to provide context and information about the RSI levels and their corresponding market conditions.
📘 Market Sentiment Integration
Purpose : Analyzes market sentiment using various indicators to provide an overall sentiment score.
Usage : Enable or disable individual sentiment indicators, set account type, and customize sentiment calculations for better market analysis.
Volatility Index (IV) :
Description : Enable or disable the use of the Volatility Index in sentiment calculation.
Details : When enabled, the Volatility Index (IV) provides insight into market sentiment by measuring market volatility. The selected Volatility Index varies based on your TradingView account type.
Account Type :
Description : Select your TradingView account type.
Details : Free accounts use SPX, while Premium accounts use VIX.
Put/Call Ratio (PCR) :
Description : Enable or disable the use of the Put/Call ratio in sentiment calculation.
Details : The Put/Call ratio is a sentiment indicator that measures the volume of put options traded relative to call options, indicating market sentiment towards bearish or bullish expectations.
Fear and Greed Index :
Description : Enable or disable the use of the Fear and Greed Index in sentiment calculation.
Details : The Fear and Greed Index gauges the prevailing emotions in the market, indicating whether investors are inclined towards fear (bearish sentiment) or greed (bullish sentiment).
Momentum Indicators :
Description : Enable or disable the use of momentum indicators like MACD and RoC in sentiment calculation.
Details : Momentum indicators help identify the strength and direction of price movements, assisting in sentiment analysis.
Adaptive Periods for Shorter Timeframes :
Description : Toggle this option to use shorter periods for sentiment indicators when analyzing lower timeframes.
Details : Enabling this option allows for more responsive and sensitive analysis when working with shorter timeframes.
Calculation Details :
Normalization Function : Normalize the values of the indicators over a 252-period range.
Set Periods Function : Set periods based on user preference for faster or slower periods, adjusting the analysis sensitivity.
IV Calculation : Calculate the IV value based on the selected Volatility Index (SPX for Free accounts, VIX for Premium accounts).
Put/Call Ratio Calculation : Calculate the Put/Call ratio using volume data, where put volume is proportional to the trading range, and call volume is proportional to the price change.
RoC Calculation : Calculate the Rate of Change (RoC) as a momentum indicator, measuring the percentage change in closing prices over a specified period.
Dynamic Thresholds : Define dynamic thresholds based on historical data, calculating mean and standard deviation to determine upper and lower thresholds for IV, PCR, and RoC.
📘 Enhanced Market Trend Dashboard Integration
Purpose : Provides a summary of key market indicators and signals in a single dashboard for quick and easy reference.
Usage : Customize the dashboard settings to display relevant market information, including Ichimoku components, Linear Regression, Support/Resistance levels, MACD, RSI, and Market Sentiment.
Market Trend Dashboard Parameters :
Display Market Trend Dashboard : Toggle to show or hide the market trend dashboard, providing a summary of key indicators and signals.
Panel Position : Select the position of the dashboard on the chart for optimal viewing.
Panel Text Size : Choose the text size for the information displayed in the dashboard, ensuring readability.
Panel Background Color : Set the background color of the market trend dashboard, enhancing contrast with the chart.
Ichimoku Dashboard Parameters :
Display Ichimoku Dashboard : Toggle to show or hide the Ichimoku section in the dashboard.
Display Tenkan-Sen Price Cross : Indicate when the price crosses the Tenkan-Sen line, signaling potential trade opportunities.
Display Kijun-Sen Price Cross : Indicate when the price crosses the Kijun-Sen line, often considered a stronger signal than Tenkan-Sen crosses.
Display Chikou Span Price Cross : Indicate Chikou Span price crosses, providing insight into potential trend reversals.
Display Kumo Breakout : Indicate Kumo (cloud) breakouts, which can signify major trend shifts.
Display Kumo Twist : Indicate Kumo twists, suggesting changing market dynamics and potential reversals.
Linear Regression Projection Dashboard Parameters :
Display LR Projection Dashboard : Toggle to show or hide the Linear Regression Projection section in the dashboard.
Display Linear Regression Period : Indicate the period used for Linear Regression Projection analysis.
Display Pearson R Details : Show the Pearson R value in the dashboard, indicating the strength and direction of the correlation in the Linear Regression Projection.
Supports and Resistances Dashboard Parameters :
Display S/R Dashboard : Toggle to show or hide the Support and Resistance section in the dashboard.
Display S/R Break Prices : Show the latest break prices of support and resistance levels in the dashboard.
MACD Dashboard Parameters :
Display MACD Dashboard : Toggle to show or hide the MACD section in the dashboard.
RSI Dashboard Parameters :
Display RSI Dashboard : Toggle to show or hide the Relative Strength Index section in the dashboard.
Display RSI Details : Show the RSI value and status in the dashboard.
Display StochRSI Details : Show the StochRSI %K, %D values and status in the dashboard.
Market Sentiment Dashboard Parameters :
Display Market Sentiment Dashboard : Enable or disable the display of the Market Sentiment Dashboard, which summarizes key market sentiment indicators like Implied Volatility, Put/Call Ratio, and Fear and Greed Index.
Display Implied Volatility Details : Show or hide the Implied Volatility details in the Market Sentiment Dashboard.
Display Put/Call Ratio Details : Show or hide the Put/Call Ratio details in the Market Sentiment Dashboard.
Display Fear and Greed Index Details : Show or hide the Fear and Greed Index details in the Market Sentiment Dashboard.
Enhanced Calculations :
Ichimoku Cloud Trend Calculation : Calculates trend based on the relationship between Ichimoku Cloud components, identifying bullish or bearish trends.
Support and Resistance Break Detection : Detects breaks in support and resistance levels and updates the dashboard accordingly.
Linear Regression Projection Calculation : Calculates Linear Regression Projection and Pearson R value for trend analysis.
MACD Signal Calculation : Determines MACD status based on histogram values.
RSI and StochRSI Calculation : Calculates RSI and StochRSI values and updates their statuses in the dashboard.
Market Sentiment Score Calculation : Calculates overall market sentiment score based on individual sentiment indicators.
Dynamic Alert Management : Manages alerts for various dashboard signals to prevent repeated alerts.
Real-Time Data Integration : Continuously updates the dashboard with real-time data for accurate and current trend analysis.
Plotting Market Trend Dashboard Components :
Ichimoku Components Plotting : Plots Tenkan-Sen, Kijun-Sen, Chikou Span, and Kumo cloud with dynamic adjustments.
Support and Resistance Levels Plotting : Plots support and resistance levels and updates them dynamically based on market data.
Linear Regression Projection Plotting : Plots the Linear Regression Projection line and labels with trend-based colors.
MACD and RSI Plotting : Plots MACD and RSI signals on the dashboard, including status updates.
Market Sentiment Indicators Plotting : Plots Market Sentiment indicators like IV, PCR, and Fear and Greed Index with dynamic updates.
Alert Notifications Plotting : Plots alert notifications for significant market changes based on dashboard signals.
Summary
This comprehensive market analyzer integrates multiple technical indicators, including machine learning, Ichimoku Kinkō Hyō, candlestick patterns, Fibonacci retracement, support and resistance levels, trend lines, linear regression, POC analysis, divergences, ATR, RSI, and market sentiment. Each section includes detailed descriptions and usage instructions to help traders understand how to effectively utilize the indicator in their trading strategies.

Custom MyMA Contrarian IndicatorThis indicator was inspired on the Sofien Kaabar's Moving Average Contrarian Indicator - MACI. It is actually a (K,1,1) stochastic indicator built on top of the distance from the price to, what a I call, a Base Moving Average.
What I have found insteresting is that, instead of only paying attention to 0% and 100% moments, I put two K stochastic lines together and observe their relative behavior. My intention, as much as Mr Kaabar's, is to detect mean-reversion moments. I am particularly interested in detecting trends ending and, while I am not able to make the Hurst exponent useful for that purpose, I have found very insightful situations with this Contrarian Indicator.
The Base Moving Average can be chosen between EMA and MyMA. MyMA is a Moving Average that tries to mimic Bo William's MIMA. Due to the close resemblance between MyMA and MIMA, I do not feel comfortable to open this script source code.
Base Moving Average default length is set to 305, and the two stochastic K lines default lengths are 17 and 72. These default lengths come from one of the Fibonacci Phi^3/2 sub series (17, 72, 305), but they can be changed to any values, particularly to the traditionally used 20, 50 and 200. Up to my knowledge, Fibonacci Phi^3 and Phi^3/2 sub series lengths were first proposed by Bo Williams.
This indicator has shown to be particularly useful when used together with the PVPC indicator at moments when the price is above 3 green lines. On these situations we must choose between keeping in the trend or inverting our position due to a potential mean-reversion. The PVPC indicator can be found on my published scripts list under the name CMyMA + Fibo.
I have noticed that when the price is above 3 PV (green) lines, but the smallest K line is below the largest K line, then the up trend does not persist. I have not used with it to check for down trends but the smallest K line above the largest K line should suggest the start of a, possibly small, upward movement.
As Kaabar suggests, when both K lines are at 100%, the price will eventualy start to fall. On the other hand, when both are at 0% it will start to rise. Things get interesting when they separate from each other, as described right abaove.
This script has also a smothing option that I have not found very useful but could work as stochastic D line.

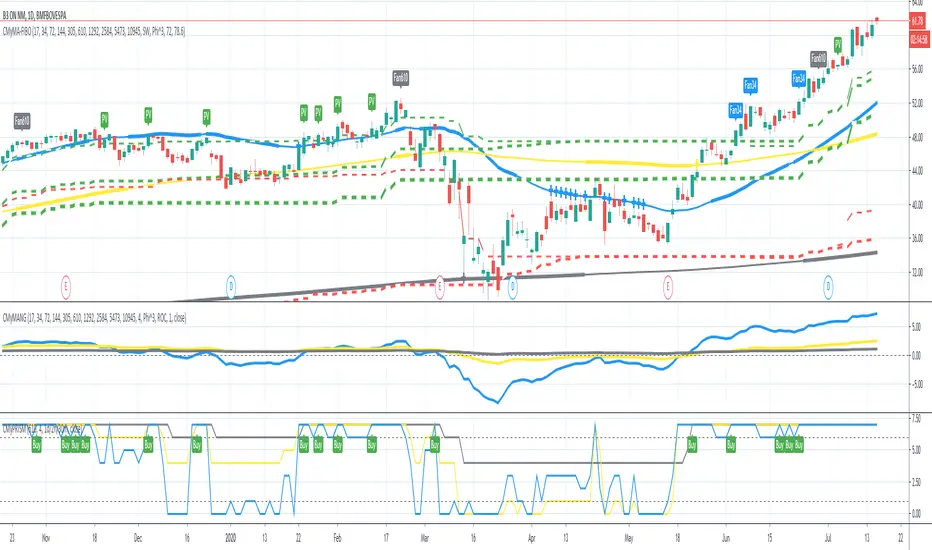
Super EMA PrismThis script implements the Binary Trade Logic (BTL) algorithm to calculate two distinct scores that range from 0 to 7. One score is calculated assigning a power of 2 weight to the positive sign of 3 Phi^3 distant Moving Average (MA) slopes. The other score is calculated assigning a power of 2 weight to the sign of the difference between the price and the value of 3 Phi^3 distant Moving Average (MA).
For the first score, hereafter called as the angle score (AS), the largest MA slope positive sign receives weight 4, the middle length MA slope positive sign receives weight 2 and the shortest MA slope positive sign receives weight 1. The positive sign of an MA is defined as 1 if the slope of the MA is positive and 0, otherwise. Therefore, for MAs 305, 72 and 17, if slope(MA305) > 0, slope(MA72) < 0 and slope(MA17) > 0, then score will be 4*1 + 2*0 + 1*1 = 5. Up to my knowledge, this score was first proposed by Bo Williams and named by him as Prisma.
For the second score, hereafter called as the value score (VS), if the price > largest MA, it receives weight 4. If the price > the middle length MA, it receives weight 2 and if the price > the the shortest MA, it receives weight 1. Therefore, for MAs 305, 72 and 17, if price < MA305, price > MA72 and price > MA17, then score will be 4*0 + 2*1 + 1*1 = 3. Up to my knowledge, this score was first proposed by Bo Williams and named by him as Prisma.
Both AS and VS are calculated for Phi^3 lengths (610, 144, 34) and for Phi^3/2 lengths (305, 72, 17). The scores of the same kind calculated for each set of length are combined multiplying the Phi^3 length score by 10 and adding with with the Phi^3/2 score, therefore providing a 2 digit score ranging from 0 to 77. For instance, if we have AS(610, 144, 34) = 7 and AS(305, 72, 17) = 5, we have AS=75. At the same time, if we have VS(610, 144, 34) = 6 and VS(305, 72, 17) = 4, we have VS=64.
VS score is plotted by default in black, but it can be on white for dark themes. AS is plotted with the color of the longest MA used.
Chart background is colored according to the range of values for AS and VS, checked in the following order:
if AS >= 13 and VS <= 13 then back color = red
if AS >= 13 or VS <= 13 then back color = orange
if AS >= 64 and VS >= 64 then back color = green
if AS >= 64 or VS >= 64 then back color = blue
otherwise back color = none (white o black)

Phicube EMASAR ( EMA Support and Resistance )Indicator based on the Concept created by Bo Williams. But unlike the original that uses MIMAs, EMAs are used here.
Exponential moving averages will be shown according to fractal alignment, in order to show the important support and resistance levels ( SAR ).
When the fractals are aligned to become support,
we will have the EMA in the graph with a bright color.
When the fractals are aligned to become resistance, we will have EMA in the graph with a matte color.
Available exponential moving averages: 17,34,72,144,305,610,1292 and 2584
____________________________________________________//_____________________________________________________________________
Indicador baseado no Conceito criado pelo Bo Williams. Mas diferente do original que utiliza MIMAs, aqui é utilizado EMAs.
As médias móveis exponenciais serão mostradas de acordo com o alinhamento dos fractais, com objetivo de mostrar os níveis importantes
de suporte e resistência( SAR ).
Quando estiver com os fractais alinhados virando suporte, teremos no gráfico a EMA com uma cor em tom brilhante.
Quando estiver com os fractais alinhados virando resistência, teremos no gráfico a EMA com uma cor em tom fosco.
Médias móveis exponenciais disponíveis: 17,34,72,144,305,610,1292 e 2584

MyMA PrismThis script implements the Binary Logic Trading (BLT) algorithm to calculate a score from 0 to 7. This score is calculated assigning a power of 2 weight to the positive sign of 3 Phi^3 distant Moving Average (MA) slopes. The largest MA slope positive sign receives weight 4, the middle length MA slope positive sign receives weight 2 and the shortest MA slope positive sign receives weight 1. The positive sign of an MA is defined as 1 if the slope of the MA is positive and 0, otherwise. Therefore, for MAs 305, 72 and 17, if slope(MA305) > 0, slope(MA72) < 0 and slope(MA17) > 0, then score will be 4*1 + 2*0 + 1*1 = 5. Up to my knowledge, this score was first proposed by Bo Williams and named by him as Prisma.
The used Moving Averages can be chosen between EMA and MyMA. MyMA is a Moving Average that tries to mimic Bo William's MIMA. Due to the close resemblance between MyMA and MIMA, I do not feel comfortable to open this script source code. In order to learn how this script operates with EMAs, please refer to my Custom EMA Prism indicator that has its source code open.
Due too sampling issues, this script ONLY WORKS with graphic time of 1d. I would like to thanks to MrBitmanBob for showing me how to get quotations from a graphic time distinct from the current one.
This script also gets sampling data from graphic times 2h and 30m to calculate their score. As, even for smaller graphic times, price data is sampled at the current time frequency, the MA lengths for those smaller graphic times needed to be proportionally decreased, meaning that when calculating the score for 1d with lengths 305, 72 and 17, the score for 2h must be calculated with lengths 72, 17 and 4, and the score for 30m must be calculated with lengths 17, 4 an 1. I understand that some precision may be lost but it is the best that is possible.
There is an optional setting for Crypto Currencies that instead of calculating the score for 1d, 2h and 30m, it calculates the score for 1d, 4h and 60m. This is due to the fact that Crypto Currencies are traded 24x7. Despite of this setting, the labels at the Style tab of the settings window remains 2h and 30m, because they must be constants.
This script with the corresponding MyMAs chart and the MyMAs Angle chart provides a broader view of the trading scenario.
MyMA AngleThis script shows the angle of 6 Moving Averages (MAs) to perform trade analysis. The MA angle is also known as its Rate Of Change ( ROC ). The 6 MAs (I, II, III , IV, V and VI ) default lengths come from one of the Fibonacci Phi^3 and Phi^3/2 sub series (17, 34, 72, 144, 305 and 610), but can be changed to any values, particularly to the traditionally used 20, 40, 50, 100, 200 and 300. Up to my knowledge, Fibonacci Phi^3 and Phi^3/2 sub series lengths were first proposed by Bo Williams.
The used Moving Averages can be chosen between EMA and MyMA. MyMA is a Moving Average that tries to mimic Bo William's MIMA. Due to the close resemblance between MyMA and MIMA, I do not feel comfortable to open this script source code. In order to learn how this script operates with EMAs, please refer to my Custom EMA + FIBO indicator that has its source code open.
Angle calculation is performed by calculating the tangent over a delta interval. Normalization is required to make the angle independent of the price range.
This script is meant to be used together with the corresponding MAs on the candle pane. Non normalized view shows a more realistic angle condition but, if intended to be used with the MyMAS indicator, normalized view should be used.

MyMA StrategyThis script combines 3 Moving Averages (MAs) with Bollinger Bands to build a trend based trading strategy. The 3 MAs (I, II and III ) default lengths come from one of the Fibonacci Phi^3/2 sub series (17, 72 and 305), but can be changed to any values, particularly to the traditionally used 20, 50 and 200.
The used Moving Averages can be chosen between EMA and MyMA. MyMA is a Moving Average that tries to mimic Bo William's MIMA. Due to the close resemblance between MyMA and MIMA, I do not feel comfortable to open this script source code. In order to learn how this script operates with EMAs, please refer to my Custom EMA Strategy indicator that has its source code open.
Bollinger Band length is set to the same length as MA I. Up to my knowledge, Fibonacci Phi^3/2 sub series lengths were first proposed by Bo Williams.
Buy Recommendations happen when src (close) > MA I > MA II, MA I angle > 0 degree, MA II angle > -1 degree and MA III angle > -1 degree. My simulations have show that -1 degree usage results in better returns than zero degree.
Top Buy Recommendations happen when, besides Buy recommendation conditions are met, src (close) > HBand, the Bollinger Band High Band.
Sell Recommendations come in 3 flavors: Short Term (close < MA I), Medium Term (close < MA2) and Long Term (MA I < MA II).
Angle calculation is performed by calculating the "normalized" tangent over a delta interval. Normalization is required to make the angle independent of the price range.

Custom EMA + FIBOThis script combines 6 EMAs with 3 Donchian Channel 78.6% and 21.4% intermediary level lines to perform trade analysis. The 6 EMAs (I, II, III , IV, V and VI ) default lengthes come from one of the Fibonacci Phi^3 and Phi^3/2 sub series (17, 34, 72, 144, 305 and 610), but can be changed to any values, particularly to the traditionally used 20, 40, 50, 100, 200 and 300. Up to my knowledge, Fibonacci Phi^3 and Phi^3/2 sub series lengthes were first proposed by Bo Williams.
The 3 Donchian Channels used have default lengthes 72, 305 and 1292, calculated after the first length default value of 72. For each of the 3 Donchian Channels only an upper line, set by default at 78.6%, is plotted in green and its complement, set to 21.4%, is plotted in red. When the closing price is above 3 green lines, we say it is Forbidden to Sell ( PV ), and when the closing price is below 3 red lines, we say it is Forbidden to Buy ( PC ). Those conditions are flagged on the chart. These PV-PC conditions were, up to my knowledge, first proposed by Bo Williams.

Liquidations (TV Source / Manual / Proxy) Cruz Pro Stack + Liquidations (TV Source / Manual / Proxy) is a high-confluence crypto trading indicator built to merge reversal detection, volatility timing, structure confirmation, and liquidation pressure into one clean decision engine.
This script combines five pro-grade components:
1) RSI Divergence (Regular + Hidden)
Detects early momentum shifts at tops and bottoms to anticipate reversals before price fully reacts.
2) BBWP (Bollinger Band Width Percentile)
Identifies volatility compression and expansion cycles to time breakout conditions and avoid low-quality chop.
3) Market Structure (BOS / CHOCH proxy)
Confirms trend continuation or change-of-character using swing breaks for more reliable directional bias.
4) Liquidations Layer (3 Modes)
Adds liquidation-driven context for where price is likely to squeeze or flush next:
TV Source: Use TradingView’s built-in Liquidations plot when available.
Manual Totals: Paste 12h/24h/48h long/short totals for higher-level regime bias.
Proxy (Volume Shock): A fallback approximation for spot charts using volume + candle direction.
The script automatically converts your chart timeframe into rolling 12/24/48-hour windows, then computes a weighted liquidation bias and a spike detector to flag potential exhaustion moves.
5) Confluence Score + Signals
A simple scoring engine highlights high-probability setups when multiple factors align.
Signals are printed only when divergence + structure + volatility context agree with liquidation pressure.
How to use
Best on BTC/ETH perps across 15m–4H.
For maximum accuracy:
Add TradingView’s Liquidations indicator (if your exchange/symbol supports it).
Set Liquidations Mode = TV Source.
Select the Liquidations plot as the source.
If that plot can’t be selected, switch to Proxy or Manual Totals.
What this indicator is designed to improve
Earlier reversal recognition
Cleaner breakout timing
Structure-confirmed entries
Better risk management around liquidation-driven moves
Fewer low-quality trades during dead volatility

AJ Price Action Trading SetupThe AJ Price action trading setup Involves :
1. Buy / Sell Signals Based On Previous Price Action
2. BOS/ COCH Showing Trend Reversals
3. Market Momentum Based On Price Action
Disclaimer :
Never Take trades based on Indicator only, make your own analysis and trade accordingly.
Price Action is not every body cup of cake, we are trading against smart and educated institutions its not easy to steal money from them.There is nothing in this world which helps in guaranteed returns,no indicator have done yet neither this one do.Try to Control your emotions and do not over trade.This is my updated version of my previous indicator Previous Candle Breakout Startegy.Follow and Comment for any clarifications.

AR-LiquidityAR-Liquidity is a clean, “chart-first” liquidity mapping tool built to automatically identify and maintain Buy-Side Liquidity (BSL) and Sell-Side Liquidity (SSL) levels, classify them as IRL / ERL using a dealing range filter, and mark sweeps/raids with an optional raid zone box—while keeping drawings stable using a fixed object bank (no random disappearing lines).
________________________________________
What it detects
1) BSL & SSL (Liquidity Pools)
• BSL (Buy-Side Liquidity): swing highs clustered into meaningful levels (areas where stops tend to rest above price).
• SSL (Sell-Side Liquidity): swing lows clustered into meaningful levels (areas where stops tend to rest below price).
Instead of plotting every single pivot, the script clusters nearby pivots using an ATR-based margin so you get clean, actionable liquidity levels, not noise.
2) IRL / ERL (Dealing Range Context)
Each liquidity level is labeled as:
• IRL (Internal Range Liquidity): inside the dealing range
• ERL (External Range Liquidity): outside the dealing range
By default, the dealing range uses:
• PDH / PDL (Previous Day High / Previous Day Low) as the IRL boundaries.
This helps you instantly understand whether a level is “internal” (often targeted during consolidation/mean reversion) or “external” (often targeted during expansion/displacement).
3) Sweeps / Raids (Liquidity Taken)
A sweep is flagged when price:
• Wicks through a confirmed level
• Then closes back inside (classic raid behavior)
The script marks swept levels with a ✓ check mark in the label.
Optionally, it can draw a raid zone box showing the wick-extreme to the level.
________________________________________
How it draws (stable & clean)
This indicator uses banked objects for lines/labels/boxes. That means:
• No flickering
• No unstable rendering
• No “objects disappearing” when new levels are created
Lines will extend to the right, and can be configured to stop when invalidated (depending on your build/settings).
________________________________________
Inputs (what each one actually means)
Detection
• Swing length (pivot L=R): controls pivot sensitivity (higher = fewer, stronger swings).
• ATR length: ATR basis for clustering margin.
• Cluster margin × ATR: how close pivots must be to merge into one liquidity level.
• Min touches to confirm: how many pivot touches are required before a level is considered valid.
• Max clusters to scan (perf): performance cap for how many stored levels the script checks.
Show / Filters
• Mode (Present/Historical):
o Present focuses on most relevant/active levels.
o Historical can show deeper history depending on your scan/visibility limits.
• Max visible levels per side: maximum number of BSL lines + SSL lines drawn at once.
• Extend levels right: keeps levels projected forward.
• Only above / only below: filter BSL above price and SSL below price (cleaner “current context” view).
• Hide swept levels: removes already-raided levels from view (if you want only “untouched” liquidity).
IRL / ERL (Dealing Range)
• Use PDH/PDL as dealing range: defines IRL boundaries using previous day high/low.
• Show PDH/PDL lines: plots those boundaries as dotted reference lines.
Sweeps / Raid Zones
• Mark sweeps: enables raid detection + check mark labeling.
• Show raid zone box: displays a box from level to wick extreme.
• Raid box extend (bars): how far the box projects to the right.
Style
Full control over:
• IRL vs ERL colors for BSL/SSL
• Line width
• Label size
• Raid box colors
________________________________________
How to use it (practical)
• Use BSL above price as likely upside draw / where liquidity may be taken.
• Use SSL below price as likely downside draw / where liquidity may be taken.
• Use IRL/ERL to decide whether the market is targeting internals (range) or externals (expansion).
• Use the ✓ sweep mark to identify “liquidity already taken” vs “still resting.”
• Pair it with structure (MSS/BOS), sessions, and displacement to time entries after raids.
________________________________________
Pro tips
• If you want more lines, increase:
o Max visible levels per side
o Max clusters to scan (perf)
• If the chart is too busy, increase:
o Swing length
o Min touches
o Or reduce Max visible levels per side

AR–Volumized Blocks & S&DAR–Volumized Blocks & S&D is a clean, price-action order-block tool that automatically detects Bullish & Bearish Order Blocks (OB), tracks their evolving state into Mitigation Blocks (MB) and Breaker Blocks (BB), and adds a volumetric overlay showing an estimated split between buyers vs sellers inside each zone. It also includes a lightweight Supply & Demand (S&D) module with the same buy/sell visualization.
This indicator is designed to keep the chart readable: zones are drawn with thin boundaries, optional breaker fill, short reference lines, centered labels, and shortened volumetric bars (instead of huge full-width blocks).
________________________________________
What it draws
1) Order Blocks with State Tracking
Each detected Order Block is shown with:
• Top/Bottom boundaries (thin lines)
• A zone container (mostly invisible for OB/MB, semi-filled for BB)
• A label that updates live with:
o Total zone volume
o Volumetric balance %
o Current state: OB / MB / BB
o Optional extra line: Buy vs Sell estimate
States
• OB (Order Block): Newly detected zone, still valid.
• MB (Mitigation Block): Zone has been touched by price (mitigated) but not broken.
• BB (Breaker Block): Zone has been invalidated (broken through) and becomes a breaker.
Optional BB cleanup
• “Hide invalidated BB” can auto-remove breaker blocks that become invalid again (to keep the chart clean and only show active breakers).
________________________________________
2) Supply & Demand Zones
Supply & Demand zones are detected using pivot logic:
• Supply: pivot highs → zone from pivot high down to pivot candle body area
• Demand: pivot lows → zone from pivot low up to pivot candle body area
They are drawn as:
• A zone holder + thin lines
• A label (“Supply” / “Demand”), with optional volumetric text
• Optional buy/sell volumetric bars, same style as OB/BB/MB
S&D zones are removed completely once broken (clean and decisive behavior).
________________________________________
Volumetric Buy/Sell (the mini bars + text)
This script adds an extra layer called Volumetric (Buy/Sell):
-Volumetric Bars (short + clean)
Inside each zone, it can draw two small stacked bars:
• Top half: Buy volume (green)
• Bottom half: Sell volume (red)
You can choose:
• Display side (Left or Right of the zone)
• Bar length in bars (shortened by design)
• Transparency
-Volumetric Text (buyers vs sellers)
The label can optionally show:
• B 123K | S 98K
So you instantly see who dominated in that block.
Important Note (Very Honest)
These buy/sell numbers are NOT real bid/ask delta.
They are an estimate based on candle direction:
• If a candle closes green (close ≥ open) → its volume is counted as “buy”
• If it closes red (close < open) → its volume is counted as “sell”
This is still extremely useful for visual confirmation, but it is not a broker-level footprint.
________________________________________
Detection Logic Summary (simple + effective)
Order Block detection (swing-based)
• Uses a swing finder to identify relevant turning points.
• Confirms OB creation on a breakout beyond the swing level.
• Builds the OB range by walking backward to capture the strongest base candle area.
• Filters out oversized zones using ATR × Max OB height filter.
Zone lifetime handling
• Zones extend forward automatically.
• OB becomes MB on first meaningful touch.
• OB becomes BB if violated in the opposite direction.
• BB can optionally be hidden if it becomes invalid (depending on your settings).
________________________________________
Inputs & Customization
Detection
• Swing length (OB): controls sensitivity. Lower = more zones, higher = fewer stronger zones.
• Use candle body for extremes: reduces wick noise by using candle bodies for boundaries.
• ATR filter: avoids huge messy blocks (keeps zones tradable).
• Max zones to keep: keeps chart lightweight.
Visual
• Bull/Bear colors
• Label size
• Forward extension
• Short line length
• Label offset
Supply & Demand
• Enable/disable S&D
• Pivot swing length
• Forward extension, line length
• Label offset X and Y (ticks)
• Max S&D zones
Volumetric Buy/Sell
• Turn bars on/off
• Turn text on/off
• Bars side (left/right)
• Bar length (short, by bars)
• Bar transparency
________________________________________
How to use (practical workflow)
For Entries
• Use Bullish OB / Demand as a potential buy zone after a displacement up.
• Use Bearish OB / Supply as a potential sell zone after a displacement down.
• Look for confluence:
o market structure shift / BOS + displacement candle + return to OB/MB
For Bias Filtering
• The buy/sell split helps you quickly sanity-check:
o A “bullish OB” that shows heavy sell dominance might be weaker (and vice versa)
o Strong imbalance zones often show a clear dominance split
For Risk Management
• BB zones are great “line in the sand” areas.
• Use zone boundaries for invalidation, with your own model rules.
________________________________________
Performance Notes
This script is built with object limits in mind and includes:
• max_boxes_count, max_lines_count, max_labels_count
• Cleanup logic when max zones are exceeded
• Optional hiding of invalid breakers to reduce clutter
________________________________________
Disclaimer
This tool provides technical visualization and estimated volumetric info based on candle direction. It does not represent true order flow, bid/ask delta, or broker tape. Always risk-manage properly and confirm with your trading plan.
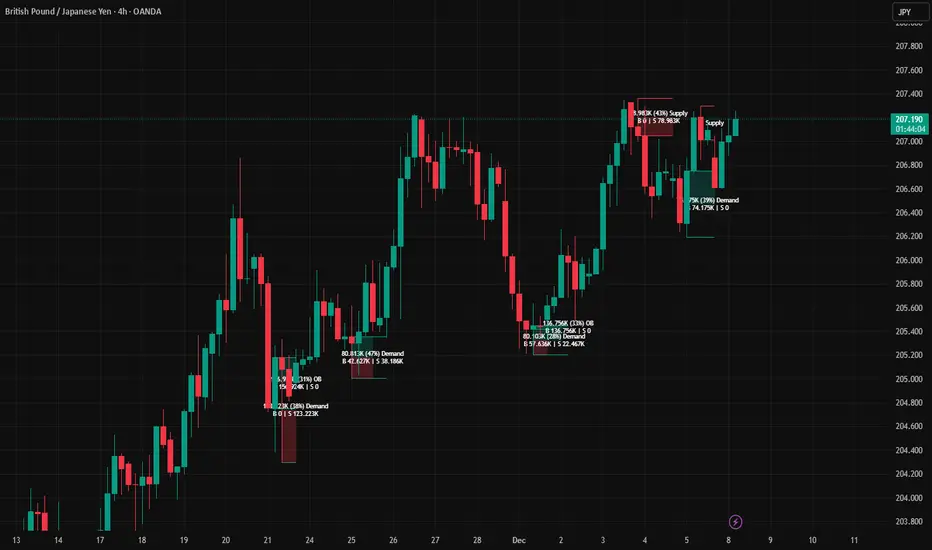
SBT LEVELS with CR Daily time frame levels PDH/ PDL/ PDC. I managed to code day count directly into the indicator complete with a table to show you the trigger day as well as current day. Im measuring higher and lower closes. that being said it is up to the trader to realize when a FRD/FGD is a A+/A++/A+++ setup. BO is the designation to show when breakout traders are triggered into the market. CIB (close in breakout). FB- FALSE BREAK- INSIDE - inside day.

CRAZY RAY RAY - Dashboard 1-5-15-1D + SMC + Clock + Candles PRO OANDA:XAUUSD This script is essentially your institutional "nuclear power plant" for scalping and swing trading: it combines the 1-5-15-1D dashboard, SMC, PRO candles, money flow times, institutional filters, Bull/Bear 12C, Liquidity HUD, Fibo Move, and Target Trend with SL + 3 TPs into a single indicator. 1. Dashboard 1–5–15–1D (Central HUD)
Calculates across 4 timeframes: 1m, 5m, 15m, and 1D:
Trend with EMAs 15/30/200.
RSI (strength >50 buy, <50 sell).
MACD (crossover in favor or against).
For each timeframe it shows:
TREND → BULLISH / BEARISH / NEUTRAL.
ACTION → BUY / SELL / WAIT.
If all 4 timeframes align:
MODE = BULLISH BUY
MODE = BEARISH SELL
Filters and displays on the HUD if buys or sells are blocked by SMC context (BLOCKED BUY / BLOCKED SELL).
Also draws 2 simple moving averages on the chart:
SMA 20 white (you can use it as a micro-trend).
SMA 200 red (macro trend and institutional reference).
2. Real-Time Clock + Trading Hours
Calculates the real time for:
New York / Miami
London
Tokyo
using current time and real time zone.
Also calculates GMT time to know which session is dominant.
Marks your trading hours:
LONDON 3:00–5:30 (London time) → goodLondon
NY OPEN 8:30–10:00 (NY time) → goodNYOpen
ASIA 20:00–23:00 (Tokyo) → goodAsiaScalp
Displays a message on the HUD:
LONDON 3:00–5:30 (1–2 TRADES)
NY OPEN 8:30–10:00 (1 TRADE)
ASIA 20–23 (SCALP)
NO TRADE ROLL / DEAD / LATE
ONLY A+ SETUPS (when not in strong trading hours).
3. Institutional Power (volume + ATR + session)
Filter that evaluates whether the moment is institutional or retail:
Checks:
If you are in a strong trading session (London / NY). If the volume is above the average × multiplier.
If the ATR is above the average × multiplier.
If it passes the filters → INST ON, otherwise → RETAIL ZONE.
Used internally to block buys/sells and for the HUD.
4. Micro-signal “NO RETRACEMENT” on 1m (BUY SR / SELL SR)
On the 1-minute timeframe, it detects a very aggressive entry:
Clean trend (15/30/200 EMAs aligned).
Price crosses the 200 EMA.
MACD turns in favor.
Marks on the candle:
BUY SR (buys without retracement below the EMA200).
SELL SR (sales without retracement above the EMA200).
This state is also reflected in the HUD as the “SR” row.
5. SMC Block: HH/HL/LH/LL + BMS + ChoCH + Fibo + Zones
This is the SMC brain of the script:
Detects swings with pivots:
Paints HH, HL, LH, LL (if you activate showHHLL).
Marks BOS (break of structure).
Marks BMS and ChoCH (with strong or weak filter using ATR, volume, MACD, gaps).
Draws:
Internal Fibo of the last range (38–50–61).
Fibo entry zone 38–78% as a green discount/premium box.
Institutional mitigation zones (simple OB type green/red boxes).
Current range with dotted yellow lines.
Calculates logic for:
antiStupidBuy: blocks purchases when the context is very bearish (LL–LL–LH, bearish ChoCH, premium, EQH, etc.).
antiStupidSell: symmetrical for sales.
From this comes:
allowBuyInst
allowSellInst
buyBlockerOn / sellBlockerOn
buyTrapDetected (BUY SR signal but context blocks it → BUY TRAP).
All this feeds the HUD and institutional alerts.
6. PRO Candles (candlestick + smart color)
Candlestick pattern system:
Detects:
Hammer, Inverted Hammer. Doji.
Strong bullish/bearish candle.
Bullish/bearish engulfing.
Uses a trend EMA to determine if the pattern is with or against the trend.
Colors the candles according to the pattern (if you enable useColorCandles).
Defines texts:
patternText (pattern name).
biasText (reversal, momentum, indecision).
Updates the HUD with the current pattern (“CANDLE: Engulf Bull”, etc.).
7. Institutional PRO Combo + Reversals
Connects everything:
fullBuySetup:
allowBuyInst TRUE (SMC + Fibo + mitigation OK).
Institutional candles in favor (engulfing, hammer, etc.).
MultiTF aligned (1m, 5m in favor, 15/1D not strongly against).
Strong session (London or NY).
No blockages.
fullSellSetup: the same for sales.
Marks on the chart:
BUY PRO, SELL PRO.
BUY REV LL → reversal from a LL, at Fibo discount, with an institutional candle and above EMA200.
SELL REV HH → reversal from HH, at Fibo premium, with an institutional candle and below EMA200.
And generates alerts for all of this.
8. Dynamic Main HUD
On barstate.islast, updates the HUD:
Changes “BUY / SELL” to:
BUY BLOCK / SELL BLOCK when the context blocks that direction.
Writes:
Current candle pattern.
Time message.
Global status:
BUY TRAP ❌, BUY REV LL ✅, SELL REV HH ✅, BUY PRO ✅, SELL PRO ✅,
BUY BLOCK, SELL BLOCK, BUY/SELL OK.
9. Bull/Bear 12C HUD (Small right HUD)
12-confirmation bull/bear engine:
Calculates:
Sweep, 5th leg, mitigation, HL/LH, strong BOS.
Volume pattern (high-low-high).
ATR rising.
MACD crossover.
Liquidity.
Fear & Greed (SMA50).
Gap/imbalance. Bull/Bear 180 weak.
Count how many are ON:
bullScore /12
bearScore /12
Define a regime:
INSTITUTIONAL → many confirmations + rvol + ATR.
NORMAL
RETAIL
Show on right HUD:
List 1 to 12 with green/red dots BULL / BEAR.
Summary: “Regime: INSTITUTIONAL / NORMAL / RETAIL”.
10. Liquidity HUD XAU SCALP
Calculates RVOL, normalized ATR, spread vs ATR, current range vs average range.
Generates score and classifies:
LOW / MED / HIGH / INS.
Only moves up one level if you are in London/NY session (depending on sessions)

(FVH) Helios Alpha v6.3.2 — Institutional Engine Helios Alpha v6.3.2 is an institutional-grade Smart Money Concepts indicator designed to reveal true market structure, trend direction, and liquidity behavior across all timeframes.
It automatically detects BOS/CHOCH, liquidity sweeps, valid orderblocks, mitigation points, premium/discount zones, and displacement—giving traders a complete structural map without chart clutter.
Version 6.3.2 introduces enhanced orderblock filtering, improved trend-engine accuracy, multi-timeframe confirmation logic, and cleaner structural visualization.
Whether analyzing Forex, Gold (XAUUSD), Indices, or Crypto, Helios Alpha delivers consistent, high-precision trend and structure insights for traders who want reliability and clarity in any market environment.
This tool does not generate signals or promises profits. It is designed to support analysis and improve decision-making through objective structural data.

VWAP Pullback + BOS + OBV v2 (Crypto Futures 15m)This strategy combines VWAP pullbacks, break-of-structure entries, and OBV confirmation to catch high-quality trend continuation moves on crypto futures. It waits for price to trend above or below the 200 EMA, then pulls back into the VWAP band, signaling a potential reload zone. A trade only triggers when price breaks recent structure in the direction of the trend and OBV shows supportive volume flow. An ATR volatility filter blocks entries during choppy, low-energy periods, and all trades use an ATR stop-loss with fixed reward-to-risk targeting. The result is a cleaner, more disciplined trend-following system designed for 15m–30m BTC/ETH scalping.

🟡 GOLD 4H HUD v12 — Time-Safe Nuclear Edition🟡 GOLD 4H HUD v12 — Time-Safe Nuclear Edition
A full–scale Smart Money Concepts (SMC) analytics engine designed exclusively for XAUUSD on the 4-Hour timeframe.
This script combines market structure, liquidity, displacement, order blocks, imbalance, volume profile, SMT divergence, and institutional behavior modeling into a single unified HUD.
Built with a time-safe architecture, all structural elements (OB/FVG/Sweep) are stored by timestamp to minimize repainting and preserve event integrity.
📌 Core Features (12 Modules + Full HUD)
1 — Market Structure Engine
Automatically detects:
HH / HL / LH / LL
BOS (Break of Structure)
MSS (Market Structure Shift)
CHOCH (Change of Character)
Real swing pivots & trend state
2 — Sweep Engine (Liquidity Grab Detection)
Identifies institutional liquidity grabs:
Break + reclaim of highs/lows
ATR-filtered invalidation
Displacement-backed sweeps
3 — Time-Safe FVG Engine
Detects Bullish/Bearish Fair Value Gaps
ATR-tolerant FVG logic
Automatic right-extension
Auto-delete when filled or invalid
4 — Time-Safe Order Block Engine
Demand & Supply OB detection
Strength classification (Weak vs Strong)
FVG-overlap confirmation
Timestamp-locked (non-repainting)
5 — Volume Profile Engine (HVN / LVN / POC)
Real-time micro-profile:
High Volume Node (HVN)
Low Volume Node (LVN)
Point of Control (POC)
6 — SMT Engine (Gold vs DXY Divergence)
Smart Money Divergence built-in:
Bullish SMT
Bearish SMT
Directional confirmation with zero lag
7 — Displacement Engine
Measures institutional impulse:
Body-based impulse detection
Multi-leg continuation signals
FVG continuation moves
Generates displacement score
8 — Premium / Discount Model
Auto-classifies price into:
Discount (Buy zone)
Premium (Sell zone)
9 — SMC Trend Engine (Score-Based)
Combines 10+ factors:
Structure
FVG
OB power
Displacement
POC positioning
SMT conditions
Outputs:
BULL / BEAR / RANGE
Full scoring system
10 — Institutional Imbalance Model (IMB Engine)
Combines:
PD zones
Sweep direction
Displacement
SMT
OB strength
CHOCH/MSS
A complete institutional bias filter.
11 — Entry Engine (Signal Fusion Model)
Entry conditions fuse:
Sweep
CHOCH
Displacement
OB strength
FVG alignment
SMT confirmation
Also outputs:
Suggested SL/TP
Entry score
12 — Trendline Engine
Auto-draws:
HL → HL bullish trendlines
LH → LH bearish trendlines
+ Full Nuclear HUD
Displays:
Market structure
Trend direction
SMT / CHOCH / MSS
FVG / OB zones
HVN / LVN / POC
Liquidity strength
Entry model
Liquidity Magnet direction
SL/TP map
A complete institutional dashboard in one place.
⚠ Usage Requirement
This script is designed ONLY for the 4H timeframe.
✨ Summary
GOLD 4H HUD v12 — Time-Safe Nuclear Edition
is not just an indicator.
It is a full institutional-grade SMC analysis system, built specifically for Gold.
If you trade XAUUSD on the 4H timeframe —
this is your complete market intelligence HUD

Aurora Reversal Suite: Liquidity & Inversion ModelConcept & Methodology The Aurora Reversal Suite is not a general-purpose indicator; it is a hard-coded algorithmic implementation of a specific institutional reversal model often referred to as the "2022 Mentorship Model" or "Sweep-to-Inversion" setup.
While many scripts display Liquidity Sweeps or Fair Value Gaps individually, this script solves the problem of "confluence fatigue" by algorithmically enforcing a strict order of operations. It does not alert on every sweep; it alerts only when a specific sequence of price action events occurs in a verified order.
The Algorithmic Logic (How it Works) The core value of this script lies in its conditional filtering logic, which automates the following manual verification process:
Event A: Liquidity Sweep
The script first monitors key institutional levels: Previous Day High/Low, Session High/Low (Asia/London/NY), and dynamic Swing Points.
It detects a "Sweep" event when price breaches a level but fails to close beyond it (or closes back inside within a defined lookback period).
Event B: Displacement & Inversion
Unlike standard FVG indicators, this script searches specifically for Inversion FVGs (iFVG) that form immediately following the sweep event.
The script logic requires that the iFVG be created by the displacement leg that reverses the sweep. This binds the "Entry Signal" directly to the "Liquidity Event."
Event C: Algorithmic Filtering (The "Strict" Mode)
To filter out false positives common in choppy markets, the script applies a multi-layer filter before printing a signal:
Volume Qualification: The signal bar's volume must exceed a user-defined multiple of the N-period average volume (default 1.5x) to confirm institutional participation.
SMT Divergence Filter: The script cross-references a correlated asset (e.g., NQ vs. ES or EU vs. DXY). If enabled, a signal is only valid if the correlated asset failed to make a matching high/low at the moment of the sweep (SMT Divergence).
Bias Alignment: The script calculates directional bias using a waterfall logic (Daily > 4H > 1H). Signals counter to this calculated bias are suppressed in "Strict" mode.
Included Features & Components
Automated Market Structure: Real-time labeling of BOS (Break of Structure) and MSS (Market Structure Shift) based on swing point logic.
Session Killzones: Visual boxes for Asia, London, and NY sessions with auto-extending high/low lines to track session liquidity.
Multi-Timeframe Dashboard: A calculated table displaying the trend state of the Daily, 4H, and 1H timeframes to assist with top-down analysis.
Power of 3 (PO3) Overlay: Visualization of higher-timeframe candle geometry on lower-timeframe charts to identify accumulation/distribution phases.
Why This Mashup is Necessary Attempting to trade this specific reversal model using separate indicators results in chart clutter and conflicting signals. By combining the Sweep detection, iFVG creation, and SMT filtering into a single codebase, we can programmatically eliminate "naked" sweeps that have no displacement, providing a cleaner and more objective view of the market structure.
Settings & Customization
Signal Mode: Choose between "Simple" (Price Action only) or "Strict" (Trend + Volume filtered).
SMT Input: Manually define the correlated asset ticker for divergence checks.
Visuals: Fully customizable colors for Bullish/Bearish scenarios to fit light or dark themes.
Disclaimer This script is a tool for market analysis and does not guarantee future results. It is intended to assist traders in identifying high-probability setups based on historical price action concepts.

ICT Base Candle with Volume Filter📘 ICT BASE CANDLE WITH VOLUME FILTER
Institutional Base Candle Detection System
Smart Money Concepts (SMC/ICT)
🔍 What This Indicator Does
ICT Base Candle with Volume Filter automatically detects institutional Base Candles—also known as pause candles, decision candles, compression candles, or repricing pauses.
These candles often appear at key algorithmic points:
After a displacement
After a liquidity sweep
Before a fair value gap reaction
Inside an Order Block (OB)
At premium/discount zones
Before large expansions
This tool highlights these candles using:
✔ Body-percentage filtering
✔ Optional volume-based filtering
✔ Bullish/Bearish color coding
✔ Optional labels (+ / –)
✔ Accurate fixed historical plotting
✔ Customizable settings
This makes it extremely useful for SMC, ICT, and algorithmic orderflow traders.
🎯 Why Base Candles Matter (SMC/ICT Context)
The market moves in an algorithmic sequence:
Liquidity Sweep (grab stops above/below)
Displacement (strong impulse candle)
Base Candle (pause candle before continuation)
Expansion / Reversal
Base candles indicate:
Loss of momentum
Repricing
Order absorption (buy/sell programs)
Potential mitigation zones
Possible entry (continuation)
Possible reversal (if sweep + base + displacement)
They act as footprints of algorithmic activity, confirming where smart money is momentarily active.
🎨 Indicator Features
✔ Customizable Base Candle Colors
Choose unique colors for bullish and bearish base candles.
Option to use the same color for both.
✔ Volume Filter
Enable/disable volume filtering
Adjust lookback and threshold values.
✔ Label Toggles
Display “+” above bullish base candles
Display “–” below bearish base candles
✔ Fixed Historical Markers
All detected base candles remain consistent as bars update.
✔ Tooltip-Enhanced Inputs
Includes advanced trading notes inside input tooltips.
📈 How to Use (Practical Guide)
1️⃣ Identify the Impulse
Look for strong displacement or impulsive candles.
2️⃣ Locate the Base Candle
A small-body candle directly following a displacement.
3️⃣ Validate With Volume (Optional)
Low volume confirms a pause in the algorithm's movement.
4️⃣ Use It With SMC Tools
Base candles work best when aligned with:
FVGs
Order Blocks
BOS / CHoCH
Liquidity sweeps
Premium/discount equilibrium
5️⃣ Entry Model (Example)
Continuation Model:
Displacement
Base Candle forms (small body)
Enter on break of base candle
SL beyond candle wick
TP at liquidity / FVG end
📌 Example Explanation
A bullish impulse appears → price pauses → forms a bullish base candle → FVG below → price mitigates → resumes trend.
This indicator marks the base candle and helps you visualize where the algorithm slowed down before continuing the move.
🚫 Limitations & Notes
This is not a buy/sell signal indicator
It highlights context, not trades
Must be combined with structure & liquidity analysis
Volume filter is optional and should be tested per asset
🔒 Invite-Only Access (If Applicable)
If published as Invite-Only, include this:
Access is manually approved
Redistribution is not allowed
Do not share access publicly
Contact the author to request access
Unauthorized reselling is strictly prohibited
🏁 Final Notes
This indicator is designed for traders who understand:
Smart Money Concepts
Institutional orderflow
Liquidity models
Algorithmic ranges
Candle behavior within displacement
Use it as part of a full trading framework—not as a standalone signal.
📜 Credits
Created by: Manish Kumar Gupta / ask2maniish
Inspired by ICT / SMC price delivery concepts

FVG Supply and DemandThis indicator combines powerful tools into one:
• Supply & Demand Zones built from swing highs/lows with ATR-based zone width, POI markers, and Break-of-Structure (BOS) detection.
• Volumized Fair Value Gaps (FVGs) showing bullish/bearish gaps, total volume inside the gap, volume distribution, optional zone-combining, and auto-cleanup.
• Swing TSL Line and manage bar color.
It helps visualize key imbalance areas, institutional zones, and price reaction points.
Credits to the Author.
⚠️ Disclaimer
This indicator is provided for educational and analytical purposes only.
It does not provide trading advice.
Past results do not guarantee future outcomes.
Use responsibly and in conjunction with your market analysis.

Market Structure with Inducements & SweepsChange of Characters (CHoCH) are based on swing points detection, while Break of Structures (BOS) are based on trailing maximum & minimums from the detected Change of Characters. We do this for a more dynamic & timely display of market structure.
Traders that consider inducements as a part of their analysis of Change of Characters & Break of Structures can more easily avoid fakeouts.
