Mirpapa_Lib_StructLibrary "Mirpapa_Lib_Struct"
ICT 구조 변화 감지 라이브러리 (BOS, CHoCH, MSS, Sweep)
initStructState()
StructState 초기화
checkBOS(_trend, _currentClose, _lastHHPrice, _lastLLPrice)
BOS 체크 (추세 지속) - 종가 기준
Parameters:
_trend (string) : 현재 추세
_currentClose (float) : 현재 종가
_lastHHPrice (float) : 마지막 HH 가격
_lastLLPrice (float) : 마지막 LL 가격
Returns:
checkCHoCH(_trend, _currentClose, _lastHHPrice, _lastLLPrice)
CHoCH 체크 (추세 전환) - 종가 기준
Parameters:
_trend (string) : 현재 추세
_currentClose (float) : 현재 종가
_lastHHPrice (float) : 마지막 HH 가격
_lastLLPrice (float) : 마지막 LL 가격
Returns:
checkSweep(_currentHigh, _currentLow, _currentClose, _lastHHPrice, _lastLLPrice)
Sweep 체크 (유동성 수집) 설명
Parameters:
_currentHigh (float) : 현재 고가
_currentLow (float) : 현재 저가
_currentClose (float) : 현재 종가
_lastHHPrice (float) : 마지막 HH 가격
_lastLLPrice (float) : 마지막 LL 가격
Returns:
checkMSS(_hadCHoCH, _chochDir, _currentHigh, _currentLow, _chochPrice)
MSS 체크 (CHoCH + 리테스트 확인)
Parameters:
_hadCHoCH (bool) : CHoCH 발생 여부
_chochDir (string) : CHoCH 방향
_currentHigh (float) : 현재 고가
_currentLow (float) : 현재 저가
_chochPrice (float) : CHoCH 발생 가격
Returns:
drawStructLabel(_price, _time, _type, _dir, _lblColor)
구조 변화 라벨 그리기
Parameters:
_price (float) : 가격
_time (int) : 시간
_type (string) : 구조 타입
_dir (string) : 방향
_lblColor (color) : 라벨 색상
drawStructLine(_price, _startTime, _endTime, _lineColor, _lineWidth)
구조 변화 라인 그리기
Parameters:
_price (float) : 가격
_startTime (int) : 시작 시간
_endTime (int) : 끝 시간
_lineColor (color) : 라인 색상
_lineWidth (int) : 라인 두께
StructType
구조 타입 상수
Fields:
BOS (series string)
CHOCH (series string)
MSS (series string)
SWEEP (series string)
TrendDir
추세 방향 상수
Fields:
UP (series string)
DOWN (series string)
NONE (series string)
StructState
구조 변화 상태
Fields:
_trend (series string) : 현재 추세 방향
_lastHHPrice (series float) : 마지막 HH 가격
_lastHHTime (series int) : 마지막 HH 시간
_lastLLPrice (series float) : 마지막 LL 가격
_lastLLTime (series int) : 마지막 LL 시간
_peakHHPrice (series float) : 최고 HH 가격 (BOS 레벨용)
_peakHHTime (series int) : 최고 HH 시간
_peakLLPrice (series float) : 최저 LL 가격 (BOS 레벨용)
_peakLLTime (series int) : 최저 LL 시간
_bosLevelHH (series float) : BOS 체크용 HH 레벨 (확정된 최고 HH)
_bosLevelHHTime (series int) : BOS 체크용 HH 시간
_bosLevelLL (series float) : BOS 체크용 LL 레벨 (확정된 최저 LL)
_bosLevelLLTime (series int) : BOS 체크용 LL 시간
ابحث في النصوص البرمجية عن "BOS"

Scalping Market Strctures[SumitQuants]🇮🇳🔥 **Scalping Market Structures
**
Built for Scalper and Market Structure Breakout Trader
A clean, lightning-fast market structure engine designed for Indian scalpers who need precise Swing Points, BOS/CHoCH, and True Breakout Signals — without clutter, lag, or noise.
Perfect for 1-min, 3-min, 5-min scalping on indices & stocks.
🧠 Why This Indicator Stands Out
Most structure tools repaint or clutter your chart.
This one is simple, sharp, and brutally effective.
It reveals:
➡ True swing highs & lows
➡ Where structure flips (BOS/CHoCH)
➡ Counter-trend reversals
➡ Buy/Sell pressure points
➡ 0.5 retracement zones for sniper entries
It reads the chart the way scalpers need:
Fast. Clean. Accurate.
🔥 What’s Inside (Complete Feature Stack)
🎯 1. Automatic Swing High/Low Detection (Scalper-Optimized)
Instant swing labeling that adapts to your timeframe:
✔ HH (Higher High)
✔ LH (Lower High)
✔ HL (Higher Low)
✔ LL (Lower Low)
Buy / Sell swing labels appear automatically:
🟥 “Sell ↓” on bearish swing highs
🟩 “Buy ↑” on bullish swing lows
Perfect for reading trend direction in seconds.
⚡ 2. Real BOS & CHoCH Detection
Clean breakout logic that respects your choice:
✔ BOS via Candle Close
✔ BOS via Wick Break
Plus:
✨ CHoCH mode (first counter-trend BOS automatically renamed to CHoCH)
✨ Breakout lines drawn with your color & style
✨ Mid-point BOS labels for perfect visibility
Spot reversals & trend flips with zero confusion.
📏 3. The 0.5 Retracement Tool (Smart Entry Zone)
Beautiful mid-retracement lines drawn ONLY when trend conditions match:
🔹 Appears between recent swing high → low
🔹 Shows ideal 50% pullback zone
🔹 Perfect for sniper re-entries during expansions
Enable/disable anytime. Fully customizable.
🔍 4. Trend Context in One Glance
The script tracks:
✔ Last swing direction
✔ Whether the market is making HH/LH or HL/LL
✔ Bias shift moments
✔ When highs or lows get invalidated
This gives you real structure awareness — the foundation of SMC scalping.
🔔 5. Clean Breakout Visualization
Whenever a swing high or swing low gets taken out:
🔥 A BOS line is drawn
🔥 A BOS/CHoCH label appears
🔥 The previous swing is deactivated
🔥 Trend context is updated instantly
No repaint. No lag. No ambiguity.
🧽 6. Ultra-Clean UI
✔ Minimalist labels
✔ Light/dark-mode friendly
✔ Zero clutter
✔ Focus on price, not drawings
A scalper’s dream: fast, clean, actionable.
🧪 Who Is This Built For?
✔ NIFTY/BANKNIFTY Scalpers
✔ Price Action Traders
✔ SMC Traders
✔ Smart Money Reversal Traders
✔ Anyone who trades 1m–15m charts
✔ Traders who want a simple but powerful structure tool
⚡ Why Indian Traders Love It
🔸 Calls out structure shifts instantly
🔸 Helps spot reversals BEFORE the move starts
🔸 Makes scalping simple & visual
🔸 Eliminates noisy indicators
🔸 Gives pure price-action clarity
🔸 Works on every timeframe & instrument
This is not just a structure tool —
It’s your scalping radar.
🛒 Get Full Access
This indicator is available inside the Courses Section on the official website.
👉 Purchase & Access:
www.ironmindtrader.com
Inside the course:
🔧 Installation Steps
📘 How to Use the Structure System
🎯 Scalping Entry Logic
🔄 Updates Included

Smart Money Flow Index (SMFI) - Advanced SMC [PhenLabs]📊Smart Money Flow Index (SMFI)
Version: PineScript™v6
📌Description
The Smart Money Flow Index (SMFI) is an advanced Smart Money Concepts implementation that tracks institutional trading behavior through multi-dimensional analysis. This comprehensive indicator combines volume-validated Order Block detection, Fair Value Gap identification with auto-mitigation tracking, dynamic Liquidity Zone mapping, and Break of Structure/Change of Character detection into a unified system.
Unlike basic SMC indicators, SMFI employs a proprietary scoring algorithm that weighs five critical factors: Order Block strength (validated by volume), Fair Value Gap size and recency, proximity to Liquidity Zones, market structure alignment (BOS/CHoCH), and multi-timeframe confluence. This produces a Smart Money Score (0-100) where readings above 70 represent optimal institutional setup conditions.
🚀Points of Innovation
Volume-Validated Order Block Detection – Only displays Order Blocks when formation candle exceeds customizable volume multiplier (default 1.5x average), filtering weak zones and highlighting true institutional accumulation/distribution
Auto-Mitigation Tracking System – Fair Value Gaps and Order Blocks automatically update status when price mitigates them, with visual distinction between active and filled zones preventing trades on dead levels
Proprietary Smart Money Score Algorithm – Combines weighted factors (OB strength 25%, FVG proximity 20%, Liquidity 20%, Structure 20%, MTF 15%) into single 0-100 confidence rating updating in real-time
ATR-Based Adaptive Calculations – All distance measurements use 14-period Average True Range ensuring consistent function across any instrument, timeframe, or volatility regime without manual recalibration
Dynamic Age Filtering – Automatically removes liquidity levels and FVGs older than configurable thresholds preventing chart clutter while maintaining relevant levels
Multi-Timeframe Confluence Integration – Analyzes higher timeframe bias with customizable multipliers (2-10x) and incorporates HTF trend direction into Smart Money Score for institutional alignment
🔧Core Components
Order Block Engine – Detects institutional supply/demand zones using characteristic patterns (down-move-then-strong-up for bullish, up-move-then-strong-down for bearish) with minimum volume threshold validation, tracks mitigation when price closes through zones
Fair Value Gap Scanner – Identifies price imbalances where current candle's low/high leaves gap with two-candle-prior high/low, filters by minimum size percentage, monitors 50% fill for mitigation status
Liquidity Zone Mapper – Uses pivot high/low detection with configurable lookback to mark swing points where stop losses cluster, extends horizontal lines to visualize sweep targets, manages lifecycle through age-based removal
Market Structure Analyzer – Tracks pivot progression to identify trend through higher-highs/higher-lows (bullish) or lower-highs/lower-lows (bearish), detects Break of Structure and Change of Character for trend/reversal confirmation
Scoring Calculation Engine – Evaluates proximity to nearest Order Blocks using ATR-normalized distance, assesses FVG recency and distance, calculates liquidity proximity with age weighting, combines structure bias and MTF trend into smoothed final score
🔥Key Features
Customizable Display Limits – Control maximum Order Blocks (1-10), Liquidity Zones (1-10), and FVG age (10-200 bars) to maintain clean charts focused on most relevant institutional levels
Gradient Strength Visualization – All zones render with transparency-adjustable coloring where stronger/newer zones appear more solid and weaker/older zones fade progressively providing instant visual hierarchy
Educational Label System – Optional labels identify each zone type (Bullish OB, Bearish OB, Bullish FVG, Bearish FVG, BOS) with color-coded text helping traders learn SMC concepts through practical application
Real-Time Smart Money Score Dashboard – Top-right table displays current score (0-100) with color coding (green >70, yellow 30-70, red <30) plus trend arrow for at-a-glance confidence assessment
Comprehensive Alert Suite – Configurable notifications for Order Block formation, Fair Value Gap detection, Break of Structure events, Change of Character signals, and high Smart Money Score readings (>70)
Buy/Sell Signal Integration – Automatically plots triangle markers when Smart Money Score exceeds 70 with aligned market structure and fresh Order Block detection providing clear entry signals
🎨Visualization
Order Block Boxes – Shaded rectangles extend from formation bar spanning high-to-low of institutional candle, bullish zones in green, bearish in red, with customizable transparency (80-98%)
Fair Value Gap Zones – Rectangular areas marking imbalances, active FVGs display in bright colors with adjustable transparency, mitigated FVGs switch to gray preventing trades on filled zones
Liquidity Level Lines – Dashed horizontal lines extend from pivot creation points, swing highs in bearish color (short targets above), swing lows in bullish color (long targets below), opacity decreases with age
Structure Labels – "BOS" labels appear above/below price when Break of Structure confirmed, colored by direction (green bullish, red bearish), positioned at 1% beyond highs/lows for visibility
Educational Info Panel – Bottom-right table explains key terminology (OB, FVG, BOS, CHoCH) and score interpretation (>70 high probability) with semi-transparent background for readability
📖Usage Guidelines
General Settings
Show Order Blocks – Default: On, toggles visibility of institutional supply/demand zones, disable when focusing solely on FVGs or Liquidity
Show Fair Value Gaps – Default: On, controls FVG zone display including active and mitigated imbalances
Show Liquidity Zones – Default: On, manages liquidity line visibility, disable on lower timeframes to reduce clutter
Show Market Structure – Default: On, toggles BOS/CHoCH label display
Show Smart Money Score – Default: On, controls score dashboard visibility
Order Block Settings
OB Lookback Period – Default: 20, Range: 5-100, controls bars scanned for Order Block patterns, lower values detect recent activity, higher values find older blocks
Min Volume Multiplier – Default: 1.5, Range: 1.0-5.0, sets minimum volume threshold as multiple of 20-period average, higher values (2.0+) filter for strongest institutional candles
Max Order Blocks to Display – Default: 3, Range: 1-10, limits simultaneous Order Blocks shown, lower settings (1-3) maintain focus on most recent zones
Fair Value Gap Settings
Min FVG Size (%) – Default: 0.3, Range: 0.1-2.0, defines minimum gap size as percentage of close price, lower values detect micro-imbalances, higher values focus on significant gaps
Max FVG Age (bars) – Default: 50, Range: 10-200, removes FVGs older than specified bars, lower settings (10-30) for scalping, higher (100-200) for swing trading
Show FVG Mitigation – Default: On, displays filled FVGs in gray providing visual history, disable to show only active untouched imbalances
Liquidity Zone Settings
Liquidity Lookback – Default: 50, Range: 20-200, sets pivot detection period for swing highs/lows, lower values (20-50) mark shorter-term liquidity, higher (100-200) identify major swings
Max Liquidity Age (bars) – Default: 100, Range: 20-500, removes liquidity lines older than specified bars, adjust based on timeframe
Liquidity Sensitivity – Default: 0.5, Range: 0.1-1.0, controls pivot detection sensitivity, lower values mark only major swings, higher values identify minor swings
Max Liquidity Zones to Display – Default: 3, Range: 1-10, limits total liquidity levels shown maintaining chart clarity
Market Structure Settings
Pivot Length – Default: 5, Range: 3-15, defines bars to left/right for pivot validation, lower values (3-5) create sensitive structure breaks, higher (10-15) filter for major shifts
Min Structure Move (%) – Default: 1.0, Range: 0.1-5.0, sets minimum percentage move required between pivots to confirm structure change
Multi-Timeframe Settings
Enable MTF Analysis – Default: On, activates higher timeframe trend analysis incorporation into Smart Money Score
Higher Timeframe Multiplier – Default: 4, Range: 2-10, multiplies current timeframe to determine analysis timeframe (4x on 15min = 1hour)
Visual Settings
Bullish Color – Default: Green (#089981), sets color for bullish Order Blocks, FVGs, and structure elements
Bearish Color – Default: Red (#f23645), defines color for bearish elements
Neutral Color – Default: Gray (#787b86), controls color of mitigated zones and neutral elements
Show Educational Labels – Default: On, displays text labels on zones identifying type (OB, FVG, BOS), disable once familiar with patterns
Order Block Transparency – Default: 92, Range: 80-98, controls Order Block box transparency
FVG Transparency – Default: 92, Range: 80-98, sets Fair Value Gap zone transparency independently from Order Blocks
Alert Settings
Alert on Order Block Formation – Default: On, triggers notification when new volume-validated Order Block detected
Alert on FVG Formation – Default: On, sends alert when Fair Value Gap appears enabling quick response to imbalances
Alert on Break of Structure – Default: On, notifies when BOS or CHoCH confirmed
Alert on High Smart Money Score – Default: On, alerts when Smart Money Score crosses above 70 threshold indicating high-probability setup
✅Best Use Cases
Order Block Retest Entries – After Break of Structure, wait for price retrace into fresh bullish Order Block with Smart Money Score >70, enter long on zone reaction targeting next liquidity level
Fair Value Gap Retracement Trading – When price creates FVG during strong move then retraces, enter as price approaches unfilled gap expecting institutional orders to continue trend
Liquidity Sweep Reversals – Monitor price approaching swing high/low liquidity zones against prevailing Smart Money Score trend, after stop hunt sweep watch for rejection into premium Order Block/FVG
Multi-Timeframe Confluence Setups – Identify alignment when current timeframe Order Block coincides with higher timeframe FVG plus MTF analysis showing matching trend bias
Break of Structure Continuations – After BOS confirms trend direction, trade pullbacks to nearest Order Block or FVG in direction of structure break using Smart Money Score >70 as entry filter
Change of Character Reversal Plays – When CHoCH detected indicating potential reversal, look for Smart Money Score pivot with opposing Order Block formation then enter on structure confirmation
⚠️Limitations
Lagging Pivot Calculations – Pivot-based features (Liquidity Zones, Market Structure) require bars to right of pivot for confirmation, meaning these elements identify levels retrospectively with delay equal to lookback period
Whipsaw in Ranging Markets – During choppy conditions, Order Blocks fail frequently and structure breaks produce false signals as Smart Money Score fluctuates without clear institutional bias, best used in trending markets
Volume Data Dependency – Order Block volume validation requires accurate volume data which may be incomplete on Forex pairs or limited in crypto exchange feeds
Subjectivity in Scoring Weights – Proprietary 25-20-20-20-15 weighting reflects general institutional behavior but may not optimize for specific instruments or market regimes, user cannot adjust factor weights
Visual Complexity on Lower Timeframes – Sub-hour timeframes generate excessive zones creating cluttered charts, requires aggressive display limit reduction and higher minimum thresholds
No Fundamental Integration – Indicator analyzes purely technical price action and volume without incorporating economic events, news catalysts, or fundamental shifts that override technical levels
💡What Makes This Unique
Unified SMC Ecosystem – Unlike indicators displaying Order Blocks OR FVGs OR Liquidity separately, SMFI combines all three institutional concepts plus market structure into single cohesive system
Proprietary Confidence Scoring – Rather than manual setup assessment, automated Smart Money Score quantifies probability by weighting five institutional dimensions into actionable 0-100 rating
Volume-Filtered Quality – Eliminates weak Order Blocks forming without institutional volume confirmation, ensuring displayed zones represent genuine accumulation/distribution
Adaptive Lifecycle Management – Automatically updates mitigation status and removes aged zones preventing trades on dead levels through continuous validity and age monitoring
Educational Integration – Built-in tooltips, labeled zones, and reference panel make indicator functional for both learning Smart Money Concepts and executing strategies
🔬How It Works
Order Block Detection – Scans for patterns where strong directional move follows counter-move creating last down-candle before rally (bullish OB) or last up-candle before sell-off (bearish OB), validates formations only when candle exhibits volume exceeding configurable multiple (default 1.5x) of 20-bar average volume
Fair Value Gap Identification – Compares current candle’s high/low against two-candles-prior low/high to detect price imbalances, calculates gap size as percentage of close and filters micro-gaps below minimum threshold (default 0.3%), monitors whether subsequent price fills 50% triggering mitigation status
Liquidity Zone Mapping – Employs pivot detection using configurable lookback (default 50 bars) to identify swing highs/lows where retail stops cluster, extends horizontal reference lines from pivot creation and applies age-based filtering to remove stale zones
Market Structure Analysis – Tracks pivot progression using structure-specific lookback (default 5 bars) to determine trend, confirms uptrend when new pivot high exceeds previous by minimum move percentage, detects Break of Structure when price breaks recent pivot level, flags Change of Character for potential reversals
Multi-Timeframe Confluence – When enabled, requests security data from higher timeframe (current TF × HTF multiplier, default 4x), compares HTF close against HTF 20-period MA to determine bias, contributes ±50 points to score ensuring alignment with institutional positioning on superior timeframe
Smart Money Score Calculation – Evaluates Order Block component via ATR-normalized distance producing max 100-point contribution weighted at 25%, assesses FVG factor through age penalty and distance at 20% weight, calculates Liquidity proximity at 20%, incorporates structure bias (±50-100 points) at 20%, adds MTF component at 15%, applies 3-period smoothing to reduce volatility
Visual Rendering and Lifecycle – Draws Order Block boxes, Fair Value Gap rectangles with color coding (green/red active, gray mitigated), extends liquidity dashed lines with fade-by-age opacity, plots BOS labels, displays Smart Money Score dashboard, continuously updates checking mitigation conditions and removing elements exceeding age/display limits
💡Note:
The Smart Money Flow Index combines multiple Smart Money Concepts into unified institutional order flow analysis. For optimal results, use the Smart Money Score as confluence filter rather than standalone entry signal – scores above 70 indicate high-probability setups but should be combined with risk management, higher timeframe bias, and market regime understanding.

SMC pro trend
The PSK FX Structure Indicator (also known as SMC pro trend) is a complete Smart Money Concepts (SMC) toolkit designed for professional structure traders.
It detects and visualizes key price structure elements such as BoS (Break of Structure), CHoCH (Change of Character), HH/HL/LH/LL, IDM zones, SCOB, sweeps, inside bars, and EMA confluence — all with precise non-repainting logic.
This indicator helps traders read price action like an institution — identifying liquidity shifts, order flow direction, and possible reversal or continuation zones.
⸻
⚙️ Core Features
🧭 Structure Detection
• Automatic detection of major structure points:
• HH – Higher High
• HL – Higher Low
• LH – Lower High
• LL – Lower Low
• Confirms BoS (Break of Structure) and CHoCH (Change of Character) events in both bullish and bearish markets.
• Marks each structure change with labels and connecting lines for clarity.
🔁 BoS / CHoCH Logic
• Solid line = BoS
• Dashed line = CHoCH
• Colored by direction:
• 🟩 Bullish = Green
• 🟥 Bearish = Red
• Option to show live BoS/CHoCH lines extending forward for real-time updates.
🧱 IDM (Internal Displacement Model) Zones
• Detects previous and live IDM zones (premium/discount zones).
• Highlights IDM candles that cause structural displacement.
• Labels each detected IDM level automatically.
⚡ Sweeps (Liquidity Grab Detection)
• Detects when price sweeps previous highs/lows.
• Marks these zones with dotted lines and optional “X” markers.
🧩 SCOB Pattern (Smart Candle Order Block)
• Detects and colors special SMC candle structures:
• Bullish SCOB → Aqua
• Bearish SCOB → Fuchsia
• Option to color all bars by trend direction or only highlight SCOB bars.
🧭 Internal Structure & Pivots
• Marks minor highs/lows (internal structure) for better IDM leg visualization.
• Helps identify early momentum shifts before major structure breaks.
🎯 1.618 Target Projection
• Projects 1.618 Fibonacci targets dynamically after BoS or CHoCH confirmation.
• Displays target price level with text label:
• Bullish → Green Target Line
• Bearish → Red Target Line
🧱 Inside Bar Zones
• Highlights inside bar formations (compression zones).
• Draws colored boxes between high/low of inside bar clusters.
• Marks the first and consecutive inside bars with custom bar colors.
📊 EMA Filter
• Includes a toggleable Exponential Moving Average (EMA) for confluence with trend direction.
• Customizable EMA length (default: 50).
🎨 Monochrome Mode
• Toggle between normal color mode and a clean monochrome theme for minimalistic charting setups.
⸻
🧠 How to Use
1. Identify Market Context:
Wait for a confirmed CHoCH to spot potential reversals or structure shifts.
2. Follow Order Flow:
Confirm trend direction via BoS lines and IDM zones.
3. Entry Planning:
Combine sweep detection, inside bar zones, and IDM levels for sniper entries.
4. Take Profit Zones:
Use the 1.618 target projection line to set high-probability TP levels.
5. Trend Filtering:
Use EMA direction to confirm whether to follow continuation or counter-trend setups.
⸻
🧩 Inputs & Settings
Category
Key Settings
Structure
Equal H/L toggle, HH/LL labeling, internal structure
BoS/CHoCH
Enable/disable labels, custom label size, bull/bear colors
IDM
Show previous/live IDM, label size, color options
Sweeps
Show sweep lines, X-markers, sweep line color
Bar Coloring / SCOB
Toggle bar coloring and SCOB pattern
Inside Bars
Highlight and box compression zones
1.618 Targets
Enable Fibonacci target projection
EMA
Toggle EMA and adjust length
Monochrome Mode
Apply single-color chart theme
⚠️ Notes
• This indicator is built for non-repainting structure confirmation.
• Use it on higher timeframes for swing structure or lower timeframes for IDM entry precision.
• Works best with clean price action charts (no cluttered oscillators or extra visuals).
⸻
💡 Recommended Use Cases
✅ SMC traders
✅ ICT/Order Block strategy users
✅ Liquidity and market structure traders
✅ Scalpers and swing traders using BoS/CHoCH logic
⸻
✍️ Author
Developed by PURNA SAMPATH KALUARACHCHI (PSK FX)
Smart Money Concepts researcher and price structure developer.
⸻

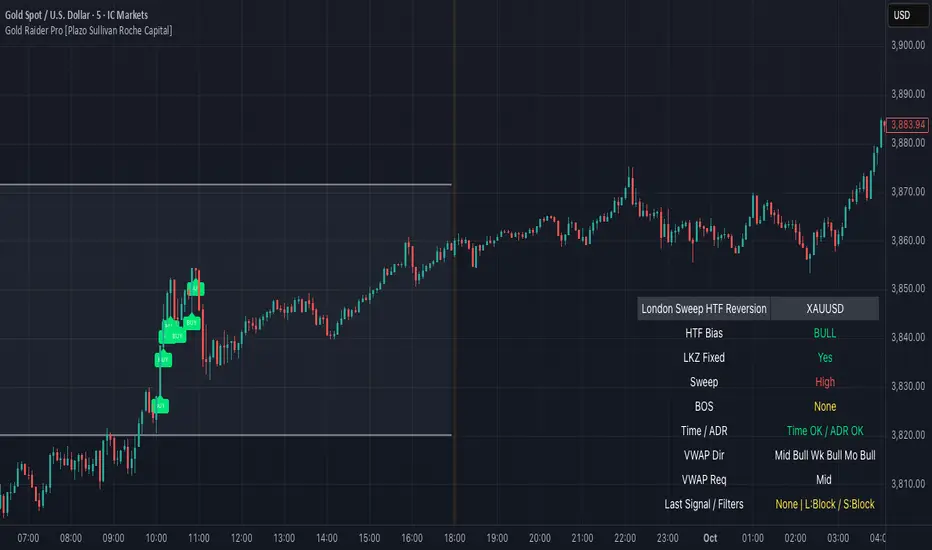
Gold Raider Pro [Plazo Sullivan Roche Capital]Core logic
During the London kill-zone, the script locks in the session high/low (LKZ).
After London ends, it looks for a liquidity sweep (price pokes beyond LKZ high/low) then a BOS (break of the first opposing swing) to confirm reversal.
Trades are only valid with higher-timeframe bias (D1 & H4 above/below EMA-50 in agreement).
Optional filters block weak signals: time gate (NY cutoff), ADR (skip if the day’s move is already stretched), and VWAP alignment (Midnight/Weekly/Monthly).
Output is a unified signal: BUY after low sweep + BOS in bull HTF, SELL after high sweep + BOS in bear HTF; labels + dashboard summarize state and reasons.
Best setup & usage
Chart & broker: XAUUSD on a high-liquidity feed (ICMarkets/FXPro/OANDA). Use 2m–5m for executions; confirm with 15m market structure.
Session: Set timezone to America/New_York. Default London kill-zone 02:30–04:30 NY; stop taking new signals after 11:00 NY (toggle in inputs).
HTF bias: Keep EMA length = 50 on D & H4 (default). Only toggle off bias if you’re deliberately testing counter-trend sweeps (not recommended live).
Structure/BOS: Use Swing Length = 3. Leave “Require BOS after the sweep” = ON for the cleanest signals; turn “Require close back inside LKZ” ON only if you want ultra-conservative entries.
VWAP filters: Keep Midnight VWAP = ON; add Weekly/Monthly only on trend days to avoid over-filtering range sessions.
ADR guardrail: Enable ADR filter once you go live; start with ADR Threshold = 0.9 and Lookback 14. This blocks chasing extended moves.
Execution playbook:
BUY: Wait for low sweep of LKZ → BOS up → dashboard shows BULL bias, Time/ADR OK, VWAP pass. Enter on the next pullback or at close; SL below BOS invalidation (or fixed 0.5–0.8× ADR14 of XAU).
SELL: Mirror logic after a high sweep in BEAR bias; SL above BOS invalidation.
TP: Scale at 1R, leave runner to 2–3R or to Midnight/Weekly VWAP touch; hard exit by NY lunchtime or on bias flip.
Risk: 0.25–0.5% per trade (XAU is spiky). One trade per direction per session; if ADR block triggers post-entry, manage to BE or flatten if structure weakens.
Alerts & dashboard: Turn on runtime alerts once parameters are set. Read the Last Signal / Filters row; only act when it shows your direction and “L:OK / S:OK” for your side.
Validation & tuning: Forward-test 3–4 weeks. If over-filtered, relax VWAP Weekly/Monthly first; if too chatty, enforce close-back-inside and keep NY cutoff tight.
Don’ts: Don’t trade during major news spikes, don’t counter the D1/H4 agreement, and don’t enter before BOS—sweeps without structure confirmation are bait.
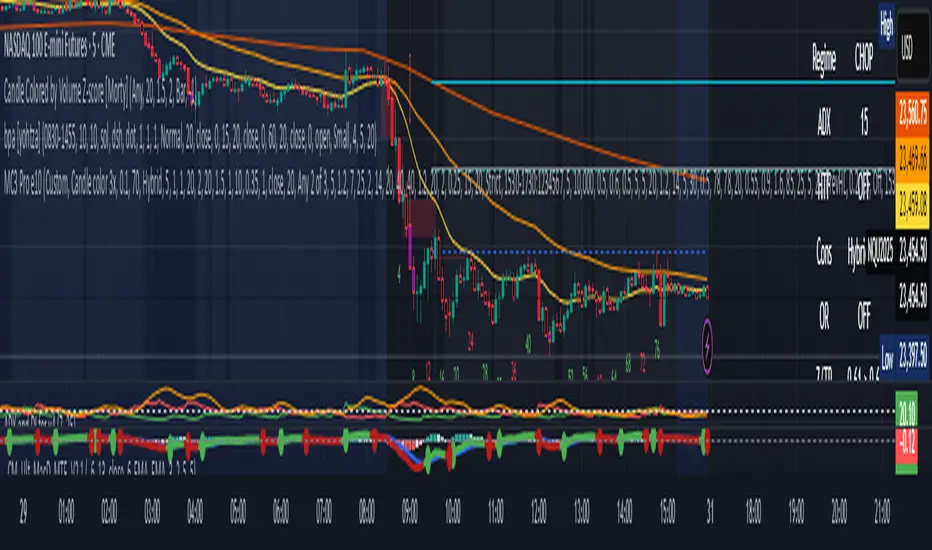
MC3 Pro Ultra e10Al-Brooks style MC3/Thrust signals with smart gating: EMA, Wilder ADX/DI, Consolidation, BO+FT, Z-score, Volume, RSI div, HTF EMA, Structure, OR/Blackout, Smart Cooldown. Non-repainting.
Full Description (for the main page)
MC3 Pro Ultra — Invite-Only (Al Brooks–inspired)
A high-discipline entry tool for 3-bar micro-channels (MC3) and optional 1-bar thrusts (MC1). Signals are filtered by a layered “gate” system: EMA side/slope/distance, Wilder ADX/DI, Consolidation (Box, BB<KC, Efficiency Ratio), Breakout+Follow-Through (BO+FT), TR Z-score expansion, Volume (mild/strict), true RSI divergence, HTF EMA (side/slope/strict), Market Structure (HH/HL vs LH/LL with optional BOS), Liquidity sweep guard, Open Range gate, Blackout windows (news) and Smart Cooldown v2.
Everything is non-repainting (evaluated on bar close or using closed higher-TF values).
What it does
MC3 (3-bar micro-channel) & Thrust (MC1) entries in both directions.
Auto regime: dynamically tightens thresholds in chop and relaxes them in trend.
BO+FT confirm: bar-3 must close beyond prior H/L by X points and near the extreme; optional follow-through (no immediate pullback).
Z-Score (TR): requires statistical range expansion (any bar inside the MC3).
EMA filter: side rule (All 3 / Any 2 / Last), slope, and max ATR distance.
Wilder ADX/DI: strength/rend bias; optional DI dominance.
Consolidation filter: Box+ATR (with break confirmation), Squeeze (BB<KC), or ER (Efficiency Ratio).
Volume gate: mild (above SMA×mult) or strict (3-bar rising).
True RSI divergence: pivot-based; blocks when divergence contradicts direction.
HTF EMA (non-repainting): side/slope/strict from a higher timeframe using closed bars.
Market Structure: longs only in HH/HL, shorts only in LH/LL; optional fresh BOS.
Liquidity Sweep guard: block-against or require-with sweep.
Open Range gate: require OR breakout before entries (optional).
Blackout windows: disable signals during macro/news windows.
Smart Cooldown v2: EMA-stretch + clustering penalty to avoid over-trading.
Retest mode (visual): after a signal, watch for a pullback to prev H/L or an EMA±ATR band.
Panel & Debug: status panel (regime, ADX, HTF, CONS, Z/TR, score, gates) + debug reasons for blocked signals.
R overlay: draws entry/stop/targets and an approximate position size.
Non-repainting: uses barstate.isconfirmed and closed HTF values. Signals print on bar close.
Presets
NQ A+ (2m/5m) – fast trend bias. BO+FT & Z-score on, Volume mild, DI dominance on, HTF strict.
NQ Pullback-safe (5m) – more conservative, higher min score & BO/Z thresholds.
ES 5m – balanced default.
(You can also use Custom and tweak only 2–3 knobs at a time.)
Suggested markets/timeframes: CME index futures (NQ/ES), 2m/5m/15m. Works on FX/indices/crypto with sensible retuning.
How to read signals
Green/Red arrows mark confirmed MC3 or Thrust entries (printed after bar closes).
Label shows S=Score and THR if the thrust override triggered.
Panel (top-right) shows: Regime (TREND/CHOP), ADX (prev closed bar optional), HTF (side/slope), Consolidation mode, OR status, current Z/TR vs threshold, Score≥, and quick Gates (✓/✗) for long/short.
Debug (optional, last bar): concatenated reasons why a signal did not pass (e.g., ).
Retest mode places “RT” markers when price pulls back to the chosen retest source.
Key inputs (high-level)
Definition: MC3 (color / close-to-close / micro-channel HL / combo), optional Thrust override.
EMA: side rule, slope, max ATR distance (with soft scoring).
ADX/DI: Wilder ADX len/threshold, optional DI dominance.
Consolidation: Box+ATR (with min breaks & confirm), Squeeze (BB<KC), ER.
BO+FT: min points beyond prior H/L, close% near extreme, “no-pullback” option.
Z-Score: TR Z-score length & min threshold.
Volume: mild (SMA×mult) or strict (3-bar rising).
RSI divergence: pivot L/R, max lookback age.
HTF: timeframe/length, rule (Side only / Slope only / Strict).
Structure gate: pivot L/R, optional BOS with max age.
Sweep guard: Off / BlockAgainst / RequireWith.
Open Range: session window + “require breakout” toggle.
Blackout: one or two session windows (e.g., FOMC/CPI).
Smart Cooldown v2: base cooldown, EMA-stretch bonus, cluster penalty.
Alerts
Comes with alertconditions for Bull/Bear signals.
Optional JSON payload (direction, score, preset, regime, price, est. R, symbol, timeframe) for webhook-based managers (auto-filtering or auto-sizing).
How to set: Add alert on this indicator → choose condition “Bull MC3/Thrust” or “Bear MC3/Thrust” → Once-per-bar-close → webhook (optional).
Best practices
In trend: keep Auto regime ON; you can slightly lower min score / Z / BO.
In chop: raise min score (+1~2), use Volume strict + DI dominance, increase Z and close% thresholds, optionally require OR breakout.
Retest entries: enable “Retest mode” to get better fills (prev H/L or EMA band).
HTF Strict + Structure gate will materially improve selectivity (fewer trades, higher quality).
Avoid trading during Blackout windows (macro releases, roll).
Respect Smart Cooldown to prevent clustering and revenge trades.
Disclaimers
This is not financial advice. Backtest/forward-test before risking capital.
No indicator guarantees win rate or profits; use stops and position sizing.
Invite-Only access at the author’s discretion. Redistribution is prohibited.
Credits
Inspired by Al Brooks methodology (micro-channels, breakouts, trend vs chop context) and classic Wilder ADX/DI.
DTFX Algo Zones [SamuraiJack Mod]CME_MINI:NQ1!
Credits
This indicator is a modified version of an open-source tool originally developed by Lux Algo. I literally modded their indicator to create the DTFX Algo Zones version, incorporating additional features and refinements. Special thanks to Lux Algo for their original work and for providing the open-source code that made this development possible.
Introduction
DTFX Algo Zones is a technical analysis indicator designed to automatically identify key supply and demand zones on your chart using market structure and Fibonacci retracements. It helps traders spot high-probability reversal areas and important support/resistance levels at a glance. By detecting shifts in market structure (such as Break of Structure and Change of Character) and highlighting bullish or bearish zones dynamically, this tool provides an intuitive framework for planning trades. The goal is to save traders time and improve decision-making by focusing attention on the most critical price zones where market bias may confirm or reverse.
Logic & Features
• Market Structure Shift Detection (BOS & CHoCH): The indicator continuously monitors price swings and marks significant structure shifts. A Break of Structure (BOS) occurs when price breaks above a previous swing high or below a swing low, indicating a continuation of the current trend. A Change of Character (ChoCH) is detected when price breaks in the opposite direction of the prior trend, often signaling an early trend reversal. These moments are visually marked on the chart, serving as anchor points for new zones. By identifying BOS and ChoCH in real-time, the DTFX Algo Zones indicator ensures you’re aware of key trend changes as they happen.
• Auto-Drawn Fibonacci Supply/Demand Zones: Upon a valid structure shift, the indicator plots a Fibonacci-based zone between the breakout point and the preceding swing high/low (the source of the move). This creates a shaded area or band of Fibonacci retracement levels (for example 38.2%, 50%, 61.8%, etc.) representing a potential support zone in an uptrend or resistance zone in a downtrend. These supply/demand zones are derived from the natural retracement of the breakout move, highlighting where price is likely to pull back. Each zone is essentially an auto-generated Fibonacci retracement region tied to a market structure event, which traders can use to anticipate where the next pullback or bounce might occur.
• Dynamic Bullish and Bearish Zones: The DTFX Algo Zones indicator distinguishes bullish vs. bearish zones and updates them dynamically as new price action unfolds. Bullish zones (formed after bullish BOS/ChoCH) are typically highlighted in one color (e.g. green or blue) to indicate areas of demand/support where price may bounce upward. Bearish zones (formed after bearish BOS/ChoCH) are shown in another color (e.g. red/orange) to mark supply/resistance where price may stall or reverse downward. This color-coding and real-time updating allow traders to instantly recognize the market bias: for instance, a series of bullish zones implies an uptrend with multiple support levels on pullbacks, while consecutive bearish zones indicate a downtrend with resistance overhead. As old zones get invalidated or new ones appear, the chart remains current with the latest key levels, eliminating clutter from outdated levels.
• Flexible Customization: The indicator comes with several options to tailor the zones to your trading style. You can filter which zones to display – for example, show only the most recent N zones or limit to only bullish or only bearish zones – helping declutter the chart and focus on recent, relevant levels. There are settings to control zone extension (how far into the future the zones are drawn) and to automatically invalidate zones once they’re no longer relevant (for instance, if price fully breaks through a zone or a new structure shift occurs that supersedes it). Additionally, the Fibonacci retracement levels within each zone are customizable: you can choose which retracement percentages to plot, adjust their colors or line styles, and decide whether to fill the zone area for visibility. This flexibility ensures the DTFX Algo Zones can be tuned for different markets and strategies, whether you want a clean minimalist look or detailed zones with multiple internal levels.
Best Use Cases
DTFX Algo Zones is a versatile indicator that can enhance various trading strategies. Some of its best use cases include:
• Identifying High-Probability Reversal Zones: Each zone marks an area where price has a higher likelihood of stalling or reversing because it reflects a significant prior swing and Fibonacci retracement. Traders can watch these zones for entry opportunities when the market approaches them, as they often coincide with order block or strong supply/demand areas. This is especially useful for catching trend reversals or pullbacks at points where risk is lower and potential reward is higher.
• Spotting Key Support and Resistance: The automatically drawn zones act as dynamic support (below price) and resistance (above price) levels. Instead of manually drawing Fibonacci retracements or support/resistance lines, you get an instant map of the key levels derived from recent price action. This helps in quickly identifying where the next bounce (support) or rejection (resistance) might occur. Swing traders and intraday traders alike can use these zones to set alerts or anticipate reaction areas as the market moves.
• Trend-Following Entries: In a trending market, the indicator’s zones provide ideal areas to join the trend on pullbacks. For example, in an uptrend, when a new bullish zone is drawn after a BOS, it indicates a fresh demand zone – buying near the lower end of that zone on a pullback can offer a low-risk entry to ride the next leg up. Similarly, in a downtrend, selling rallies into the highlighted supply zones can position you in the direction of the prevailing trend. The zones effectively serve as a roadmap of the trend’s structure, allowing trend traders to buy dips and sell rallies with greater confidence.
• Mean-Reversion and Range Trading: Even in choppy or range-bound markets, DTFX Algo Zones can help find mean-reversion trades. If price is oscillating sideways, the zones at extremes of the range might mark where momentum is shifting (ChoCH) and price could swing back toward the mean. A trader might fade an extended move when it reaches a strong zone, anticipating a reversion. Additionally, if multiple zones cluster in an area across time (creating a zone overlap), it often signifies a particularly robust support/resistance level ideal for range trading strategies.
In all these use cases, the indicator’s ability to filter out noise and highlight structurally important levels means traders can focus on higher-probability setups and make more informed trading decisions.
Strategy – Pullback Trading with DTFX Algo Zones
One of the most effective ways to use the DTFX Algo Zones indicator is trading pullbacks in the direction of the trend. Below is a step-by-step strategy to capitalize on pullbacks using the zones, combining the indicator’s signals with sound price action analysis and risk management:
1. Identify a Market Structure Shift and Trend Bias: First, observe the chart for a recent BOS or ChoCH signal from the indicator. This will tell you the current trend bias. For instance, a bullish BOS/ChoCH means the market momentum has shifted upward (bullish bias), and a new demand zone will be drawn. A bearish structure break indicates downward momentum and creates a supply zone. Make sure the broader context supports the bias (e.g., if multiple higher timeframe zones are bullish, focus on long trades).
2. Wait for the Pullback into the Zone: Once a new zone appears, don’t chase the price immediately. Instead, wait for price to retrace back into that highlighted zone. Patience is key – let the market come to you. For a bullish setup, allow price to dip into the Fibonacci retracement zone (demand area); for a bearish setup, watch for a rally into the supply zone. Often, the middle of the zone (around the 50% retracement level) can be an optimal area where price might slow down and pivot, but it’s wise to observe price behavior across the entire zone.
3. Confirm the Entry with Price Action & Confluence: As price tests the zone, look for confirmation signals before entering the trade. This can include bullish reversal candlestick patterns (for longs) or bearish patterns (for shorts) such as engulfing candles, hammers/shooting stars, or doji indicating indecision turning to reversal. Additionally, incorporate confluence factors to strengthen the setup: for example, check if the zone overlaps with a key moving average, a round number price level, or an old support/resistance line from a higher timeframe. You might also use an oscillator (like RSI or Stochastic) to see if the pullback has reached oversold conditions in a bullish zone (or overbought in a bearish zone), suggesting a bounce is likely. The more factors aligning at the zone, the more confidence you can have in the trade. Only proceed with an entry once you see clear evidence of buyers defending a demand zone or sellers defending a supply zone.
4. Enter the Trade and Manage Risk: When you’re satisfied with the confirmation (e.g., price starts to react positively off a demand zone or shows rejection wicks in a supply zone), execute your entry in the direction of the original trend. Immediately set a stop-loss order to control risk: for a long trade, a common placement is just below the demand zone (a few ticks/pips under the swing low that formed the zone); for a short trade, place the stop just above the supply zone’s high. This way, if the zone fails and price continues beyond it, your loss is limited. Position size the trade so that this stop-loss distance corresponds to a risk you are comfortable with (for example, 1-2% of your trading capital).
5. Take Profit Strategically: Plan your take-profit targets in advance. A conservative approach is to target the origin of the move – for instance, in a long trade, you might take profit as price moves back up to the swing high (the 0% Fibonacci level of the zone) or the next significant zone or resistance level above. This often yields at least a 1:1 reward-to-risk ratio if you entered around mid-zone. More aggressive trend-following traders may leave a portion of the position running beyond the initial target, aiming for a larger move in line with the trend (for example, new higher highs in an uptrend). You can also trail your stop-loss upward behind new higher lows (for longs) or lower highs (for shorts) as the trend progresses, locking in profit while allowing for further gains.
6. Monitor Zone Invalidation: Even after entering, keep an eye on the behavior around the zone and any new zones that may form. If price fails to bounce and instead breaks decisively through the entire zone, respect that as an invalidation – the market may be signaling a deeper reversal or that the signal was false. In such a case, it’s better to exit early or stick to your stop-loss than to hold onto a losing position. The indicator will often mark or no longer highlight zones that have been invalidated by price, guiding you to shift focus to the next opportunity.
Risk Management Tips:
• Always use a stop-loss and don’t move it farther out in hope. Placing the stop just beyond the zone’s far end (the swing point) helps protect you if the pullback turns into a larger reversal.
• Aim for a favorable risk-to-reward ratio. With pullback entries near the middle or far end of a zone, you can often achieve a reward that equals or exceeds your risk. For example, risking 20 pips to make 20+ pips (1:1 or better) is a prudent starting point. Adjust targets based on market structure – if the next resistance is 50 pips away, consider that upside against your risk.
• Use confluence and context: Don’t take every zone signal in isolation. The highest probability trades come when the DTFX Algo Zone aligns with other analysis (trend direction, chart patterns, higher timeframe support/resistance, etc.). This filtered approach will reduce trades taken in weak zones or counter-trend traps.
• Embrace patience and selectivity: Not all zones are equal. It can be wise to skip very narrow or insignificant zones and wait for those that form after a strong BOS/ChoCH (indicating a powerful move). Larger zones or zones formed during high-volume times tend to produce more reliable pullback opportunities.
• Review and adapt: After each trade, note how price behaved around the zone. If you notice certain Fib levels (like 50% or 61.8%) within the zone consistently provide the best entries, you can refine your approach to focus on those. Similarly, adjust the indicator’s settings if needed – for example, if too many minor zones are cluttering your screen, limit to the last few or increase the structure length parameter to capture only more significant swings.
⸻
By combining the DTFX Algo Zones indicator with disciplined confirmation and risk management, traders can improve their timing on pullback entries and avoid chasing moves. This indicator shines in helping you trade what you see, not what you feel – the clearly marked zones and structure shifts keep you grounded in price action reality. Whether you’re a trend trader looking to buy the dip/sell the rally, or a reversal trader hunting for exhaustion points, DTFX Algo Zones provides a robust visual aid to elevate your trading decisions. Use it as a complementary tool in your analysis to stay on the right side of the market’s structure and enhance your trading performance.

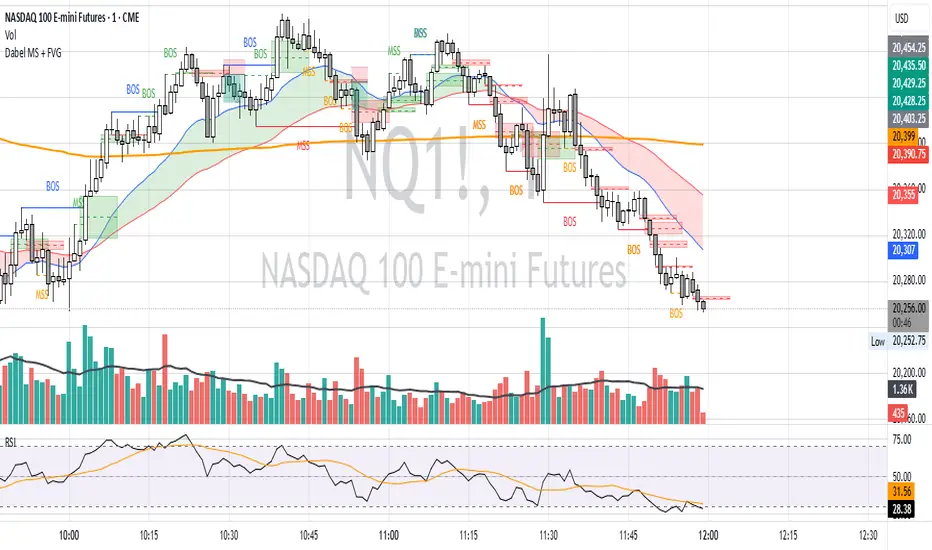
Dabel MS + FVGThis script is designed to assist traders by identifying market structures, imbalances, and potential trade opportunities using Break of Structure (BOS) and Market Structure Shifts (MSS). It visually highlights imbalances in price action, key pivots, and market structure changes, providing actionable information for making trading decisions.
Key features:
Imbalances Detection: Highlights bullish and bearish price gaps (Fair Value Gaps) using colored boxes. Users can choose the line style (solid, dashed, or dotted) for imbalance midlines.
Market Structure Analysis: Tracks pivot highs and lows to identify BOS and MSS in two separate market structures with adjustable pivot strengths.
Customizable Visualization: Allows users to choose line styles, colors, and display options for both imbalances and market structures.
Alerts: Alerts traders when BOS or MSS occur, helping to monitor the market effectively.
Trading Strategy
Imbalance Trading:
Imbalances (gaps) represent areas where supply or demand was left unfilled. These gaps often act as magnet zones where the price revisits to fill.
Bullish Imbalance: Look for buying opportunities when price enters a green imbalance zone.
Bearish Imbalance: Look for selling opportunities when price enters a red imbalance zone.
Use the midline of the imbalance box as a key reference point for potential reversals.
Break of Structure (BOS) and Market Structure Shift (MSS):
BOS: Indicates a continuation of the existing trend. For example:
Bullish BOS: Look for continuation in the uptrend after a high is broken.
Bearish BOS: Look for continuation in the downtrend after a low is broken.
MSS: Suggests a potential reversal in market structure. For example:
Bullish MSS: Indicates a possible shift from a bearish to bullish market.
Bearish MSS: Indicates a potential shift from a bullish to bearish market.
Multiple Market Structures:
This script provide two sets of market structures, allowing traders to compare short-term and long-term trends.
Adjust the pivot strength to suit your trading style (lower for intraday trading, higher for swing or positional trading).
Entry and Exit:
Entry: Look for entries near imbalances or after confirmed BOS/MSS in line with the overall trend.
Exit: Place stop-loss below/above recent pivots and take profit at nearby support/resistance or imbalance zones.
For New Traders
Focus on Basics: Understand what BOS and MSS mean and how they signal trend direction or reversals.
Use Alerts: Rely on the script's alert system to catch important moments without staring at charts all day.
Start Small: Test this strategy on a demo account before using it live. You can understand it more with practice.
Market Structure Trailing Stop [BigBeluga]The Market Structure Trailing Stop indicator is an advanced tool for identifying market structure shifts, liquidity sweeps, and potential trend reversals using comprehensive volume analysis. This indicator combines the analysis of market structure pivots (CHoCH - Change of Character) with a sophisticated volume-based trailing stop logic. By evaluating delta volume at key structural points, it allows traders to identify high-probability trend continuations or reversals and manage their trades more effectively.
🔵 KEY FEATURES
● Market Structure Analysis
Pivot-Based Market Structure : The indicator identifies high and lows using user-defined periods, allowing traders to spot key market structure shifts.
Change of Character (CHoCH) : The first significant break of a market structure is marked as a CHoCH, indicating a potential trend reversal.
Break of Structure (BoS) : The indicator highlights subsequent breaks of structure after CHoCH, providing traders with crucial insights into trend strength.
● Advanced Volume Analysis
Delta Volume Evaluation : The indicator calculates delta volume (difference between up and down volume) at each ChoCh or BoS market structure point to assess the strength of the move. Identify Delta Volume from break point back to Pivot
● Trailing Stop Logic
Volume-Validated Trailing Stop : The indicator automatically plots a trailing stop if the delta volume at the UP CHoCH is positive and above the defined threshold and vice versa for Down CHoCH , allowing traders to protect their profits while riding the trend.
Trend Weakness Detection : If a subsequent BoS occurs with negative delta volume or lower volume than the input threshold, the trailing stop disappears, indicating potential trend exhaustion or reversal.
Dynamic Stop Placement : The trailing stop is dynamically adjusted based on market structure and volume, providing traders with a more adaptive stop-loss strategy.
Up Trend Trailing Stop:
Down Trend Trailing Stop:
● Liquidity Sweep Detection
Liquidity Sweep (X) Labels : The indicator identifies liquidity sweeps—points where the price temporarily reverses to sweep liquidity above or below a key level—marked with an “X” label.
Potential Reversal Zones : These liquidity sweeps are potential reversal zones, especially when accompanied by significant delta volume changes, providing traders with early warnings of potential trend reversals.
🔵 HOW TO USE
● Identifying Market Structure Shifts
Change of Character (CHoCH) : When a CHoCH occurs, the indicator calculates the total volume from the high point to the break point. If the delta volume is positive and exceeds the input threshold, a trailing stop is plotted, signaling potential trend continuation.
Break of Structure (BoS) : If BoS is enabled, subsequent breaks of structure are highlighted. If these BoS points show weaker volume or negative delta volume, the trailing stop will disappear, indicating that the trend may be losing strength.
● Using the Trailing Stop Feature
Protecting Profits : Once a CHoCH occurs and the delta volume validates the trend, the trailing stop will be plotted below (or above) the price to protect profits while allowing the trend to run.
Trend Reversal Signals : If the trailing stop disappears due to weak volume at subsequent BoS points, it may signal that the trend is losing momentum, and traders may consider closing their positions or tightening their stops manually.
● Liquidity Sweep Interpretation
Spotting Reversal Zones : Liquidity sweeps, marked with an “X” label, indicate zones where the price has swept liquidity. These areas can serve as potential reversal zones, especially when significant delta volume is observed at these points.
Early Reversal Warnings : Traders can use these liquidity sweep labels as early warnings for potential trend reversals, particularly in conjunction with other technical analysis methods.
🔵 CUSTOMIZATION
Highs and Lows Calculation : Customize the number of bars to the left and right for identifying pivots and market structure shifts.
Volume Threshold : Define the volume threshold to filter out weaker moves and focus on significant market structure shifts.
BoS and Liquidity Sweep Labels : Toggle on or off the BoS and Liquidity Sweep labels to tailor the indicator to your trading style.
Trend Color : Enable or disable trend coloring for candles to visually highlight uptrends and downtrends on the chart.
🔵 CONCLUSION
The Market Structure Trailing Stop indicator combines advanced volume analysis with market structure detection to provide traders with a powerful tool for identifying and managing trends. By leveraging delta volume at key structure points, it helps traders validate trend strength and manage their positions with a dynamic trailing stop strategy. The addition of liquidity sweep detection further enhances its utility, offering early warnings of potential trend reversals. This indicator is ideal for traders who want to gain a deeper understanding of market structure while incorporating volume-based insights into their trading strategies.

Smart Money Concepts [XoRonX]# Smart Money Concepts (SMC) - Advanced Trading Indicator
## 📊 Deskripsi
**Smart Money Concepts ** adalah indicator trading komprehensif yang menggabungkan konsep Smart Money Trading dengan berbagai alat teknikal analisis modern. Indicator ini dirancang untuk membantu trader mengidentifikasi pergerakan institusional (smart money), struktur pasar, zona supply/demand, dan berbagai sinyal trading penting.
Indicator ini mengintegrasikan multiple timeframe analysis, order blocks detection, fair value gaps, fibonacci retracement, volume profile, RSI multi-timeframe, dan moving averages dalam satu platform yang powerful dan mudah digunakan.
---
## 🎯 Fitur Utama
### 1. **Smart Money Structure**
- **Internal Structure** - Struktur pasar jangka pendek untuk entry presisi
- **Swing Structure** - Struktur pasar jangka panjang untuk trend analysis
- **BOS (Break of Structure)** - Konfirmasi kelanjutan trend
- **CHoCH (Change of Character)** - Deteksi potensi reversal
### 2. **Order Blocks**
- **Internal Order Blocks** - Zona demand/supply jangka pendek
- **Swing Order Blocks** - Zona demand/supply jangka panjang
- Filter otomatis berdasarkan volatilitas (ATR/Range)
- Mitigation tracking (High/Low atau Close)
- Customizable display (jumlah order blocks yang ditampilkan)
### 3. **Equal Highs & Equal Lows (EQH/EQL)**
- Deteksi otomatis equal highs/lows
- Indikasi liquidity zones
- Threshold adjustment untuk sensitivitas
- Visual lines dan labels
### 4. **Fair Value Gaps (FVG)**
- Multi-timeframe FVG detection
- Auto threshold filtering
- Bullish & Bearish FVG boxes
- Extension control
- Color customization
### 5. **Premium & Discount Zones**
- Premium Zone (75-100% dari range)
- Equilibrium Zone (47.5-52.5% dari range)
- Discount Zone (0-25% dari range)
- Auto-update berdasarkan swing high/low
### 6. **Fibonacci Retracement**
- **Equilibrium to Discount** - Fib dari EQ ke discount zone
- **Equilibrium to Premium** - Fib dari EQ ke premium zone
- **Discount to Premium** - Fib full range
- Reverse option
- Show/hide lines
- Custom colors
### 7. **Volume Profile (VRVP)**
- Visible Range Volume Profile
- Point of Control (POC)
- Value Area (70% volume)
- Auto-adjust rows
- Placement options (Left/Right)
- Width customization
### 8. **RSI Multi-Timeframe**
- Monitor 3 timeframes sekaligus
- Overbought/Oversold signals
- Visual table display
- Color-coded signals (Red OB, Green OS)
- Customizable position & size
### 9. **Moving Averages**
- 3 Moving Average lines
- Pilihan tipe: EMA, SMA, WMA
- Automatic/Manual period mode
- Individual color & width settings
- Cross alerts (MA vs MA, Price vs MA)
### 10. **Multi-Timeframe Levels**
- Support up to 5 different timeframes
- Previous high/low levels
- Custom line styles
- Color customization
### 11. **Candle Color**
- Color candles berdasarkan trend
- Bullish = Green, Bearish = Red
- Optional toggle
---
## 🛠️ Cara Penggunaan
### **A. Setup Awal**
1. **Tambahkan Indicator ke Chart**
- Buka TradingView
- Klik "Indicators" → "My Scripts" atau paste code
- Pilih "Smart Money Concepts "
2. **Pilih Mode Display**
- **Historical**: Tampilkan semua struktur (untuk backtesting)
- **Present**: Hanya tampilkan struktur terbaru (clean chart)
3. **Pilih Style**
- **Colored**: Warna berbeda untuk bullish/bearish
- **Monochrome**: Tema warna abu-abu
---
### **B. Penggunaan Fitur**
#### **1. Smart Money Structure**
**Internal Structure (Real-time):**
- ✅ Aktifkan "Show Internal Structure"
- Pilih tampilan: All, BOS only, atau CHoCH only
- Gunakan untuk entry timing presisi
- Filter confluence untuk mengurangi noise
**Swing Structure:**
- ✅ Aktifkan "Show Swing Structure"
- Pilih tampilan struktur bullish/bearish
- Adjust "Swings Length" (default: 50)
- Gunakan untuk konfirmasi trend utama
**Tips:**
- BOS = Konfirmasi trend continuation
- CHoCH = Warning untuk possible reversal
- Tunggu price retest ke order block setelah BOS
---
#### **2. Order Blocks**
**Setup:**
- ✅ Aktifkan Internal/Swing Order Blocks
- Set jumlah blocks yang ditampil (1-20)
- Pilih filter: ATR atau Cumulative Mean Range
- Pilih mitigation: Close atau High/Low
**Cara Trading:**
1. Tunggu BOS/CHoCH terbentuk
2. Identifikasi order block terdekat
3. Wait for price pullback ke order block
4. Entry saat price respek order block (rejection)
5. Stop loss di bawah/atas order block
6. Target: swing high/low berikutnya
**Color Code:**
- 🔵 Light Blue = Internal Bullish OB
- 🔴 Light Red = Internal Bearish OB
- 🔵 Dark Blue = Swing Bullish OB
- 🔴 Dark Red = Swing Bearish OB
---
#### **3. Equal Highs/Lows (EQH/EQL)**
**Setup:**
- ✅ Aktifkan "Equal High/Low"
- Set "Bars Confirmation" (default: 3)
- Adjust threshold (0-0.5, default: 0.1)
**Interpretasi:**
- EQH = Liquidity di atas, kemungkinan sweep lalu dump
- EQL = Liquidity di bawah, kemungkinan sweep lalu pump
- Biasanya smart money akan grab liquidity sebelum move besar
**Trading Strategy:**
- Wait for EQH/EQL formation
- Anticipate liquidity grab
- Entry setelah sweep dengan konfirmasi (order block, FVG, CHoCH)
---
#### **4. Fair Value Gaps (FVG)**
**Setup:**
- ✅ Aktifkan "Fair Value Gaps"
- Pilih timeframe (default: chart timeframe)
- Enable/disable auto threshold
- Set extension bars
**Cara Trading:**
1. Bullish FVG = Support zone untuk buy
2. Bearish FVG = Resistance zone untuk sell
3. Price tends to fill FVG (retest)
4. Entry saat price kembali ke FVG
5. Partial fill = valid, full fill = invalidated
**Tips:**
- FVG + Order Block = High probability setup
- Multi-timeframe FVG lebih kuat
- Unfilled FVG = strong momentum
---
#### **5. Premium & Discount Zones**
**Setup:**
- ✅ Aktifkan "Premium/Discount Zones"
- Zones akan auto-update berdasarkan swing high/low
**Interpretasi:**
- 🟢 **Discount Zone** = Area BUY (price murah)
- ⚪ **Equilibrium** = Neutral (50%)
- 🔴 **Premium Zone** = Area SELL (price mahal)
**Trading Strategy:**
- BUY dari discount zone
- SELL dari premium zone
- Avoid trading di equilibrium
- Combine dengan structure confirmation
---
#### **6. Fibonacci Retracement**
**Setup:**
- Pilih Fib yang ingin ditampilkan:
- Equilibrium to Discount
- Equilibrium to Premium
- Discount to Premium
- Toggle show lines
- Enable reverse jika perlu
- Custom colors
**Key Levels:**
- 0.236 = Shallow retracement
- 0.382 = Common retracement
- 0.5 = 50% golden level
- 0.618 = Golden ratio (penting!)
- 0.786 = Deep retracement
**Cara Pakai:**
- 0.618-0.786 = Ideal entry zone dalam trend
- Combine dengan order blocks
- Wait for confirmation candle
---
#### **7. Volume Profile (VRVP)**
**Setup:**
- ✅ Aktifkan "Show Volume Profile"
- Set jumlah rows (10-100)
- Adjust width (5-50%)
- Pilih placement (Left/Right)
- Enable POC dan Value Area
**Interpretasi:**
- **POC (Point of Control)** = Harga dengan volume tertinggi = magnet
- **Value Area** = 70% volume = fair price range
- **Low Volume Nodes** = Weak support/resistance
- **High Volume Nodes** = Strong support/resistance
**Trading:**
- POC acts as support/resistance
- Price tends to return to POC
- Breakout dari Value Area = momentum
---
#### **8. RSI Multi-Timeframe**
**Setup:**
- ✅ Aktifkan "Show RSI Table"
- Set 3 timeframes (default: chart, 5m, 15m)
- Set RSI period (default: 14)
- Set Overbought level (default: 70)
- Set Oversold level (default: 30)
- Pilih posisi & ukuran table
**Interpretasi:**
- 🟢 **OS (Oversold)** = RSI ≤ 30 = Kondisi jenuh jual
- 🔴 **OB (Overbought)** = RSI ≥ 70 = Kondisi jenuh beli
- **-** = Neutral zone
**Trading Strategy:**
1. Multi-timeframe alignment = strong signal
2. OS + Bullish structure = BUY signal
3. OB + Bearish structure = SELL signal
4. Divergence RSI vs Price = reversal warning
**Contoh:**
- TF1: OS, TF2: OS, TF3: OS + Price di discount zone = STRONG BUY
---
#### **9. Moving Averages**
**Setup:**
- Pilih MA Type: EMA, SMA, atau WMA (berlaku untuk ketiga MA)
- Pilih Period Mode: Automatic atau Manual
- Set period untuk MA 1, 2, 3 (default: 20, 50, 100)
- Custom color & width per MA
- ✅ Enable Cross Alerts
**Interpretasi:**
- **Golden Cross** = MA fast cross above MA slow = Bullish
- **Death Cross** = MA fast cross below MA slow = Bearish
- Price above all MAs = Strong uptrend
- Price below all MAs = Strong downtrend
**Trading Strategy:**
1. MA1 (20) = Short-term trend
2. MA2 (50) = Medium-term trend
3. MA3 (100) = Long-term trend
**Entry Signals:**
- Price bounce dari MA dalam trend = continuation
- MA cross dengan konfirmasi structure = entry
- Multiple MA confluence = strong support/resistance
**Alerts Available:**
- MA1 cross MA2/MA3
- MA2 cross MA3
- Price cross any MA
---
#### **10. Multi-Timeframe Levels**
**Setup:**
- Enable HTF Level 1-5
- Set timeframes (contoh: 5m, 1H, 4H, D, W)
- Pilih line style (solid/dashed/dotted)
- Custom colors
**Cara Pakai:**
- Previous high/low dari HTF = strong S/R
- Breakout HTF level = significant move
- Multiple HTF levels confluence = major zone
---
### **C. Trading Setup Combination**
#### **Setup 1: High Probability Buy (Bullish)**
1. ✅ Swing structure: Bullish BOS
2. ✅ Price di Discount Zone
3. ✅ Pullback ke Bullish Order Block
4. ✅ Bullish FVG di bawah
5. ✅ RSI Multi-TF: Oversold
6. ✅ Price bounce dari MA
7. ✅ POC/Value Area support
8. ✅ Fibonacci 0.618-0.786 retracement
**Entry:** Saat price reject dari order block dengan confirmation candle
**Stop Loss:** Below order block
**Target:** Swing high atau premium zone
---
#### **Setup 2: High Probability Sell (Bearish)**
1. ✅ Swing structure: Bearish BOS
2. ✅ Price di Premium Zone
3. ✅ Pullback ke Bearish Order Block
4. ✅ Bearish FVG di atas
5. ✅ RSI Multi-TF: Overbought
6. ✅ Price reject dari MA
7. ✅ POC/Value Area resistance
8. ✅ Fibonacci 0.618-0.786 retracement
**Entry:** Saat price reject dari order block dengan confirmation candle
**Stop Loss:** Above order block
**Target:** Swing low atau discount zone
---
#### **Setup 3: Liquidity Grab (EQH/EQL)**
1. ✅ Identifikasi EQH atau EQL
2. ✅ Wait for liquidity sweep
3. ✅ Konfirmasi dengan CHoCH
4. ✅ Order block terbentuk setelah sweep
5. ✅ Entry saat retest order block
---
### **D. Tips & Best Practices**
**Risk Management:**
- Selalu gunakan stop loss
- Risk 1-2% per trade
- Risk:Reward minimum 1:2
- Jangan over-leverage
**Confluence adalah Kunci:**
- Minimal 3-4 konfirmasi sebelum entry
- Lebih banyak konfirmasi = higher probability
- Quality over quantity
**Timeframe Analysis:**
- HTF (Higher Timeframe) = Trend direction
- LTF (Lower Timeframe) = Entry timing
- Align dengan HTF trend
**Backtesting:**
- Gunakan mode "Historical"
- Test strategy di berbagai market condition
- Record dan analyze hasil
**Market Condition:**
- Trending market = Follow BOS, use order blocks
- Ranging market = Use premium/discount zones, EQH/EQL
- High volatility = Wider stops, wait for clear structure
**Avoid:**
- Trading di equilibrium zone
- Entry tanpa konfirmasi
- Fighting the trend
- Overleveraging
- Emotional trading
---
## 📈 Recommended Settings
### **For Scalping (1m - 5m):**
- Internal Structure: ON
- Swing Structure: OFF
- Order Blocks: Internal only
- RSI Timeframes: 1m, 5m, 15m
- MA Periods: 9, 21, 50
### **For Day Trading (15m - 1H):**
- Internal Structure: ON
- Swing Structure: ON
- Order Blocks: Both
- RSI Timeframes: 15m, 1H, 4H
- MA Periods: 20, 50, 100
### **For Swing Trading (4H - D):**
- Internal Structure: OFF
- Swing Structure: ON
- Order Blocks: Swing only
- RSI Timeframes: 4H, D, W
- MA Periods: 20, 50, 200
---
## ⚠️ Disclaimer
Indicator ini adalah alat bantu analisis teknikal. Tidak ada indicator yang 100% akurat. Selalu:
- Lakukan analisa fundamental
- Gunakan proper risk management
- Praktik di demo account terlebih dahulu
- Trading memiliki resiko, trade at your own risk
---
## 📝 Version Info
**Version:** 5.0
**Platform:** TradingView Pine Script v5
**Author:** XoRonX
**Max Labels:** 500
**Max Lines:** 500
**Max Boxes:** 500
---
## 🔄 Updates & Support
Untuk update, bug reports, atau pertanyaan:
- Check documentation regularly
- Test new features in replay mode
- Backup your settings before updates
---
## 🎓 Learning Resources
**Recommended Study:**
1. Smart Money Concepts (SMC) basics
2. Order blocks theory
3. Liquidity concepts
4. ICT (Inner Circle Trader) concepts
5. Volume profile analysis
6. Multi-timeframe analysis
**Practice:**
- Start with higher timeframes
- Master one concept at a time
- Keep a trading journal
- Review your trades weekly
---
**Happy Trading! 🚀📊**
_Remember: The best indicator is your own analysis and discipline._

Liquidity & inducementsHi all!
This indicator will show liquidity and inducements.
I will continue to try to add different types of liquidity and inducements, at this moment it contains 6 kinds of liquidity/inducement, they are:
• Grabs
• Big grabs
• Sweeps
• Turtle soups
• Equal highs/lows (liquidity and inducement)
• BSL & SSL
And 1 type of inducement:
• Retracement
This description will contain indicator examples of each individual liquidity and inducement. They will all be with the default settings.
Settings
First you will find settings for the market structure (BOS/CHoCH/CHoCH+). Select left and right pivot lengths and if the pivots should have a label or not.
This is the base foundation of this indicator and is possible with my library 'PriceAction' ().
You will see solid lines for break of structures (BOS), change of characters (CHoCH) and change of character plus (CHoCH+).
The pivots found will be the core of this indicator and will show you when the closing price breaks it. When that happens a break of structure (BOS) or a change of character (CHoCH or CHoCH+) will be created. The latest 5 pivots found within the current trend will be kept to take action on.
A break of structure is removed if an earlier pivot within the same trend is broken and the pivot's high price for a bullish trend or low price for a bearish trend is more extreme than the BOS pivot's price.
You are able to show the pivots that are used. "HH" (higher high), "HL" (higher low), "LH" (lower high), "LL" (lower low) and "H"/"L" (for pivots (high/low) when the trend has changed) are the labels used.
In the next section ('Liquidity ($$$)') you can select which types of liquidity you want to see. Note that 'Equal highs/lows' can also show inducement (more on that later).
In the section afterwards ('Inducement (IDM)') you can select if you want retracement inducements to be visible or not. More information on what they are later on.
The section for each individual liquidity and/or inducement can first contain a line named 'Pivot', where you can set the pivot lengths (first left, then right). Then you can set the 'Lookback', which means that the 'Lookback' number of past pivots is to take action on. After that you set the 'Timeframe' for the pivots used. That means that all available liquidity/inducements will be from your desired timeframe. Lastly you set the color of the liquidity/inducement (either a single color or bullish followed by bearish colors).
Lastly in the settings you can select the font sizes for the market structure and liquidity/inducements and what style liquidity/inducements lines will have. The sizes defaults to 7 and has a dotted line look.
Grabs
Liquidity grabs and liquidity sweeps are very similar. It all depends on if the current bar closed above/below the liquidity pivot and on if its a continuation or reversal. In a liquidity grab the bar that's above or below the liquidity pivot was not closed above or below it. Like this:
Or
The visual feedback will be a dotted line between the liquidity pivot and liquidity grab bar and a linefill between the high of the liquidity grab bar and the liquidity pivot.
Indicator example:
Big grabs
This is another 'grabs' option. You can show an additional grab if you want to. I suggest having this grab from a higher timeframe or with larger pivot lengths than the other grab.
The default is with the chart timeframe and 10/10 as pivot lengths.
Indicator example:
Sweeps
A liquidity sweep is like a liquidity grab but with the difference that price closes above/below and has a continuation instead of a reversal. If the liquidity pivot was at the same bar as a BOS/CHoCH/CHoCH+ it will not be a liquidity grab but a structural break instead.
They can look like this:
Indicator example;
Turtle soups
If only one candle is beyond the pivot it could be a liquidity grab. It's a grab if price didn't close beyond the liquidity pivot, if so it's invaliditet. Turtle soups are basically false breakouts that takes liquidity (is a false breakout from a pivot with the lengths and timeframe from the settings).
The turtle soup can have a confirmation in the terms of a change of character (CHoCH). You can enable this in the settings section for 'Turtle soups' through the 'Confirmation' checkbox (enabled by default). The turtle soup strategy usually comes with some sort of confirmation, in this case a CHoCH, but it can also be a market structure shift (MSS) or a change in state of delivery (CISD).
The addition of turtle soups is possible through my script 'Turtle soup' ().
The drawing will be a dotted line between the liquidity pivot and the last bar of the false breakout and a box from the start of the false breakout to the end of it.
Indicator example:
Equal highs/lows
Equal highs/lows will always show liquidity, but might also show inducement. Inducement will be shown on equal lows if the trend is bullish and on equal highs if it's bearish, like this:
Or
Equal highs can only be created if the second pivot is lower than the first one. Equal lows can only be created if the second pivot is higher than the first one. If that is not the case it could be a liquidity grab.
When equal highs or equal lows are find that produces inducement (equal lows in a bullish trend and equal highs in a bearish trend), the indicator will first display inducement and will show liquidity once traders are induced to enter the security. Stop loss placement, for liquidity, is 0.1 * the average true range (ATR, of length 14). They will look like this:
Only inducement:
Inducement and liquidity:
Indicator example:
Equal highs/lows inducements can not be triggered after a BOS/CHoCH/CHoCH+. They are cleared upon a structural break.
BSL & SSL
Buyside liquidity (BSL) and sellside liquidity (SSL) will be shown. A pivot that's been mitigated (touched by price) can never be BSL or SSL. The BSL/SSL available will be dynamic while price moves (work in Replay and lower timeframes that moves fast) and pick the latest pivot/s (with left and right lengths from the 'Market structure' section). You can define how many BSL/SSL you want to see with a default value of 1, meaning only 1 BSL and 1 SSL can be shown. If there is no unmitigated high (BSL) or low (SSL), no BSL/SSL will be available to show. If there are BSL/SSL available they're very useful to use as targets for entering a trade.
The will look like this when available;
And without BSL available:
Or
And without SSL available:
Note that the examples without BSL/SSL available could have liquidity available from previous price legs.
This can be an example of a BSL/SSL sequence:
First both buyside and sellside liquidity is available:
Then a new low appears and new sellside liquidity is available:
Then buyside liquidity is mitigated, so only sellside liquidity is available:
A new high pivot appears and buyside liquidity is available again:
Lastly a bearish CHoCH happens and sellside liquidity is mitigated, only buyside liquidity is available:
Retracement
The first retracement after a BOS/CHoCH/CHoCH+ is considered an inducement with the mission to get traders into a trade prematurely to get stopped out. This level is shown and look like this:
Or
A retracement inducement is removed when a new BOS/CHoCH/CHoCH+ appears and it's not triggered.
---------------------------
As of now there aren't any alerts available. You cannot use the Pine Screener from Tradingview either to see new liquidity/inducement events. I have this planned for future updates though.
I hope that this long description makes sense, let me know otherwise! Also let me know if you experience any bugs or have a feature request or just want to share good settings to use.
Best of trading luck!

Dynamic Market Structure (MTF) - Dow TheoryDynamic Market Structure (MTF)
OVERVIEW
This advanced indicator provides a comprehensive and fully customizable solution for analyzing market structure based on classic Dow Theory principles. It automates the identification of key structural points, including Higher Highs (HH), Higher Lows (HL), Lower Lows (LL), and Lower Highs (LH).
Going beyond simple pivot detection, this tool visualizes the flow of the trend by plotting dynamic Breaks of Structure (BOS) and potential reversals with Changes of Character (CHoCH). It is designed to be a flexible and powerful tool for traders who use price action and trend analysis as a core part of their strategy.
CORE CONCEPTS
The indicator is built on the foundational principles of Dow Theory:
Uptrend: A series of Higher Highs and Higher Lows.
Downtrend: A series of Lower Lows and Lower Highs.
Break of Structure (BOS): Occurs when price action continues the current trend by creating a new HH in an uptrend or a new LL in a downtrend.
Change of Character (CHoCH): Occurs when the established trend sequence is broken, signaling a potential reversal. For example, when a Lower Low forms after a series of Higher Highs.
CALCULATION METHODOLOGY
This section explains the indicator's underlying logic:
Pivot Detection: The indicator's core logic is based on TradingView's built-in ta.pivothigh() and ta.pivotlow() functions. The sensitivity of this detection is fully controlled by the user via the Pivot Lookback Left and Pivot Lookback Right settings.
Structure Calculation (BOS/CHoCH): The script identifies market structure by analyzing the sequence of these confirmed pivots.
A bullish BOS is plotted when a new ta.pivothigh is confirmed at a price higher than the previous confirmed ta.pivothigh.
A bearish CHoCH is plotted when a new ta.pivotlow is confirmed at a price lower than the previous confirmed ta.pivotlow , breaking the established sequence of higher lows.
The logic is mirrored for bearish BOS and bullish CHoCH.
Invalidation Levels: This feature identifies the last confirmed pivot before a structure break (e.g., the last ta.pivotlow before a bullish BOS) and plots a dotted line from it to the breakout bar. This level is considered the structural invalidation point for that move.
MTF Confirmation: This unique feature provides confluence by analyzing a second, lower timeframe. When a pivot (e.g., a Higher Low) is confirmed on the main chart, the script requests pivot data from the user-selected lower timeframe. If a corresponding trend reversal is detected on that lower timeframe (e.g., a break of its own minor downtrend), the pivot is labeled "Firm" (FHL); otherwise, it is labeled "Soft" (SHL).
KEY FEATURES
This indicator is packed with advanced features designed to provide a deeper level of market insight:
Dynamic Structure Lines: BOS and CHoCH levels are plotted with clean, dashed lines that dynamically start at the old pivot and terminate precisely at the breakout bar, keeping the chart clean and precise.
Invalidation Levels: For every structure break, the indicator can plot a dotted "Invalidation" line (INV). This marks the critical support or resistance pivot that, if broken, would negate the previous move, providing a clear reference for risk management.
Multi-Timeframe (MTF) Confirmation: Add a layer of confluence to your analysis by confirming pivots on a lower timeframe. The indicator can label Higher Lows and Lower Highs as either "Firm" (FHL/FLH) if confirmed by a reversal on a lower timeframe, or "Soft" (SHL/SLH) if not.
Flexible Pivot Detection: Fully adjustable Pivot Lookback settings for the left and right sides allow you to tune the indicator's sensitivity to match any timeframe or trading style, from long-term investing to short-term scalping.
Full Customization: Take complete control of the indicator's appearance. A dedicated style menu allows you to customize the colors for all bullish, bearish, and reversal elements, including the transparency of the trend-based candle coloring.
HOW TO USE
Trend Identification: Use the sequence of HH/HL and LL/LH, along with the trend-colored candles, to quickly assess the current market direction on any timeframe.
Entry Signals: A confirmed BOS can signal a potential entry in the direction of the trend. A CHoCH can signal a potential reversal, offering an opportunity to enter a new trend early.
Risk Management: Use the automatically plotted "Invalidation" (INV) lines as a logical reference point for placing stop losses. A break of this level indicates that the structure you were trading has failed.
Confluence: Use the "Firm" pivot signals from the MTF analysis to identify high-probability swing points that are supported by price action on multiple timeframes.
SETTINGS BREAKDOWN
Pivot Lookback Left/Right: Controls the sensitivity of pivot detection. Higher numbers find more significant (but fewer) pivots.
MTF Confirmation: Enable/disable the "Firm" vs. "Soft" pivot analysis and select your preferred lower timeframe for confirmation.
Style Settings: Customize all colors and the transparency of the candle coloring to match your chart's theme.
Show Invalidation Levels: Toggle the visibility of the dotted invalidation lines.
This indicator is a powerful tool for visualizing and trading with the trend. Experiment with the settings to find a configuration that best fits your personal trading strategy.

Iani SMC Sniper XAU v2.2 (Long+Short + News Countdown, v6)Iani SMC Sniper v2.6 — Anytime • Auto Pip • FVG 50% • OB • News Panel
Smart-Money Concepts made simple for intraday XAU/USD (works on any symbol).
Finds BOS, 50% FVG “sniper” entries, optional Order Blocks, London H/L, news countdown, and a mini info panel.
What it does
BOS (Break of Structure): detects bullish/bearish BOS after London sweep logic.
FVG 50% entries: plots precise long/short entry dots at the midpoint of the gap.
Auto TP/SL: TP = RR × risk, SL below/above recent swing with a small buffer.
Order Blocks (optional): marks the last opposite candle after BOS and alerts on OB revisit.
London High/Low: tracks session range; session filter is optional.
News countdown: shows next event time and minutes left (user-selectable timezone).
Mini Panel: top-left table with Trend (last BOS), Next news, R:R, Pip size.
Inputs (key)
Auto pip size: uses syminfo.mintick. Manual override available.
Risk:Reward (RR): default 2.0.
Pivot length: swing sensitivity.
Sessions: enable if you want signals only 12:00–20:00 (symbol timezone). Off = anytime.
News timezone: pick your own (e.g., Europe/Brussels, America/New_York).
Absolute & daily times: add your events (strings like 2025-09-17 20:00 or 14:30,16:00…).
Show labels/levels/OBs: toggle on/off.
Alerts included
BOS Bullish / BOS Bearish
BUY Entry / SELL Entry (return to 50% FVG)
Bullish OB revisit / Bearish OB revisit
TP Long/Short reached, SL Long/Short hit
NEWS WARNING (warning window only; does not block signals)
To use: Add Alert → Condition: this indicator → choose any of the alertconditions.
Best use
Bias: H1 for structure.
Execution: M15 (standard) or M5 (aggressive).
Works great on XAUUSD, but is symbol-agnostic (auto pip adapts).
Notes
News times display in the timezone you pick in settings.
OBs are a simple implementation meant for quick visual guidance.
Labels: BUY/SELL near entries, TP/SL on set and when hit, BOS up/down.
Risk disclaimer
This tool is for education only. Not financial advice. Backtest and manage risk.

BIASBias — MTF Market Structure
What it does
Bias determines bullish/bearish bias from a higher timeframe (HTF) market structure and shows BOS/CHOCH events in a minimal, uncluttered way. When a BOS/CHOCH is confirmed, the script draws a single horizontal line at the broken swing that extends to the right and stops automatically once price invalidates it. Background shading reflects the current bias.
Why it’s different (Minimal Clean)
No boxes or noisy fills — just clean horizontal continuation lines and small optional labels.
Pivot-based structure on your chosen HTF; lines update only when swings are confirmed.
Built-in anti-clutter controls (limit number of active lines).
Optional conservative confirmation (wait for HTF close).
How Bias is determined (BOS/CHOCH logic)
On the selected HTF, the script detects swing highs/lows using Pivot Left / Right.
New swings are filtered by Min Swing Distance (%) so tiny wiggles are ignored.
A breakUp occurs when price crosses the latest HTF swing high; a breakDown when it crosses the latest swing low (by Close or Wick, per your setting).
Event classification:
BOS (Break of Structure): break in the same direction as the current bias (trend continuation).
CHOCH (Change of Character): break in the opposite direction (trend change).
After a break, bias flips/updates (Bullish after breakUp, Bearish after breakDown). A thin horizontal line is drawn from that level, extending until price invalidates it in the opposite direction.
Inputs & Settings (what to tweak)
Basis Timeframe (HTF) – the timeframe used to build structure (e.g., 1H, 4H, 1D).
Pivot Left / Right – swing sensitivity (higher = cleaner, slower).
Confirm Break by Close – if ON, require close beyond the level; if OFF, wick is enough.
Wait for HTF Close – confirms only after the HTF candle closes (safer, later).
Min Swing Distance (%) – minimum percent distance vs. previous swing to accept a new swing.
Show Bias Background – soft background shading of current bias.
Show BOS/CHOCH Labels – small tags on the break candle (optional).
Max Active Level Lines – caps how many horizontal lines are kept on the chart (default 8).
Line Width – thickness of the horizontal lines.
Colors
Bull continuation lines/labels use a teal theme; Bear uses orange. You can adjust in code if desired.
How to use (quick start)
Add to any chart and keep your trading timeframe as you like (e.g., 5m, 15m, 1H).
Set HTF to the structure frame you trust (e.g., 1H for intraday, 4H/D for swing).
For a cleaner map, raise Pivot Left/Right (e.g., 4–6) and Min Swing Distance (e.g., 0.5–1%).
Choose break confirmation:
Want early signals? leave Confirm by Close ON and Wait for HTF Close OFF.
Want stronger signals? turn Wait for HTF Close ON.
Read the chart:
Background = current Bias (Bullish or Bearish).
Each BOS/CHOCH prints a short label and a horizontal line that extends to the right until price invalidates it.
Use the lines as clean reference for structure and for where bias last changed/continued.
Reduce clutter by lowering Max Active Level Lines (e.g., 5–8) or turning labels off.
Multi-HTF tip: Add two instances — e.g., HTF=4H for strategic bias and HTF=1H for tactical entries. Keep labels ON only on the tactical one for simplicity.
Alerts
The script provides ready-made alert conditions (constant strings per Pine v6 rules):
BOS Bullish
BOS Bearish
CHOCH Bullish
CHOCH Bearish
Bias Flip → Bullish
Bias Flip → Bearish
Create an alert on the indicator and choose the condition you want.
Notes & Limitations
Swings use pivots; a pivot only finalizes after pR bars, so signals don’t repaint forward once the HTF pivot is confirmed.
If Wait for HTF Close is OFF, intrabar spikes can trigger earlier (faster but less strict).
As with any tool, this is not financial advice and should be combined with your own risk management.
Recommended presets
Intraday: HTF = 1H, pL/pR = 4/4, Min Swing % = 0.6–1.0, Confirm by Close = ON, Wait HTF Close = OFF, Max Lines = 6–8.
Swing: HTF = 4H or 1D, pL/pR = 5–6, Min Swing % = 1.0–2.0, Confirm by Close = ON, Wait HTF Close = ON, Max Lines = 5.

MarketStructureLibMarketStructure Library
This library extends the "MarketStructure" library by mickes () under the Mozilla Public License 2.0, credited to mickes. It provides functions for detecting and visualizing market structure, including Break of Structure (BOS), Change of Character (CHoCH), Equal High/Low (EQH/EQL), and liquidity zones, with enhancements for improved accuracy and customization.
Functionality
Market Structure Detection: Identifies internal (orderflow) and swing market structures using pivot points, with support for BOS, CHoCH, and EQH/EQL.
Volatility Filter: Only confirms pivots when the ATR exceeds a user-defined threshold, reducing false signals in low-volatility markets.
Trend Strength Metric: Calculates a trend strength score based on pivot frequency and volatility, stored in the Structure type for use in scripts.
Customizable Visualizations: Allows users to configure line styles and colors for BOS and CHoCH, and label sizes for pivots, BOS, CHoCH, and liquidity.
Liquidity Zones: Visualizes liquidity levels with confirmation bars and lookback periods.
Methodology
Pivot Detection: Uses ta.pivothigh and ta.pivotlow with a volatility filter (ATR multiplier) to confirm significant pivots.
Trend Strength: Computes a score as pivotCount / LeftLength * (currentATR / ATR), reflecting trend reliability based on pivot frequency and market volatility.
BOS/CHoCH Logic: Detects BOS when price breaks a pivot in the trend direction, and CHoCH when price reverses against the trend, with labels for "MSF" or "MSF+" based on pivot patterns.
EQH/EQL Zones: Creates boxes around equal highs/lows within an ATR-based threshold, with optional extension.
Visualization: Draws lines and labels for BOS, CHoCH, and liquidity, with user-defined styles, colors, and sizes.
Usage
Integration: Import into Pine Script indicators (e.g., import Fenomentn/MarketStructure/1) to analyze market structure.
Configuration: Set pivot lengths, volatility threshold, label sizes, and visualization styles via script inputs.
Alerts: Enable alerts for BOS, CHoCH, and EQH/EQL events, triggered on bar close to avoid repainting.
Best Practices: Use on forex or crypto charts (1m to 12h timeframes) for optimal results. Adjust the volatility threshold for different market conditions.
Originality
This library builds on mickes’ framework by adding:
A volatility-based pivot filter to enhance signal accuracy.
A trend strength metric for assessing trend reliability.
Dynamic label sizing and customizable visualization styles for better usability. No additional open-source code was reused beyond mickes’ library, credited under MPL 2.0.
Developed by Fenomentn. Published under Mozilla Public License 2.0.

Fair Value Gap Suite Adrian V1.0.0Brief description
The “FVG Suite” identifies fair value gaps across multiple time units, evaluates them with a displacement score, optionally filters them according to market structure events (BOS/CHOCH), and provides context-based alerts for first touch, partial and full fills, and invalidation. The aim is to show only high-quality imbalances and trade them based on rules.
What makes the script unique (originality/added value)
Displacement score: Strength of the impulse movement as a combination of (body/ATR, range/ATR, volume Z-score).
MTF aggregator: FVGs from higher timeframes are collected, ranked, and displayed as zones on the active chart (including overlap clustering).
Structure context: Optionally, only FVGs after confirmed BOS/CHOCH in the trend direction, including premium/discount evaluation relative to the HTF range.
Adaptive invalidation: FVG expires after candles, opposing BOS or defined time (e.g., end of session).
Session/instrument filter: Time window (e.g., NY/LDN), minimum tick size, ATR-based minimum gap.
Smart fill logic: Distinguishes between first touch, partial fill (≥ %), full fill (100%); alarms per event.
Statistics overlay (optional): Hit rate/expectancy per TF & session for fine-tuning the filters.
How it works (conceptually)
FVG definition (3-candle pattern): Bullish if High < Low (bearish analog). Size = gap span in points.
Quality score:Score = w1*(|Body|/ATR) + w2*(Range/ATR) + w3*(Volume-Z), normalized to 0–100.
MTF scan: List of higher TFs: (customizable). Findings are merged, ranked, and displayed as zones with priority (color/opacity).
Context filter: Only FVGs that emerge after BOS/CHOCH in the direction of the current trend; optional exclusion in premium/discount areas.
Invalidation & alerts: A zone is considered active until the invalidation rule takes effect. Alerts are triggered upon: initial contact, partial/full filling, invalidation.
Important inputs
Min. FVG size: × ATRor ticks/points
Min. displacement score: (0–100)
MTF list:
BOS/CHOCH filter: On/Off (Lookback candles)
Session filter: NY/LDN/Asia (local time, weekend toggle)
Invalidation: maxBars = , Opposite BOS = On/Off, Session End = On/Off
Fill definitions: Partial fill ≥ % of the gap; Full fill = 100%
Overlay options: Zone color/transparency, HTF label, statistics overlay On/Off
Alerts (names & triggers)
FVG Suite – First Touch: Price touches an active FVG zone for the first time.
FVG Suite – Partial Fill: Partial fill ≥ configured threshold.
FVG Suite – Full Fill: Gap completely filled.
FVG Suite – Invalidated: Zone invalidated by rules. (Alert message contains: symbol, TF of the zone, direction, score, size, trigger rule.)
Use (best practices)
Trade in the trend direction with BOS/CHOCH filter; target counter-imbalances/liquidity pools.
Use session filters to avoid news spikes/illiquid periods.
Calibrate parameters for each market/TF (ATR/volume profiles differ).
Limitations
Structure labels can be reevaluated for new highs/lows (repainting of labels, not of FVG finds).
Spreads/news can generate “pseudo fills.”
Backtests/statistics are sample-dependent; no guarantee of results.
Changelog
v1.0 – First release (score model, MTF aggregator, BOS/CHOCH filter, fill alerts).
Credits
FVG concept: public ICT/SMC literature (general idea). Implementation/scoring, MTF ranking, smart fill logic: own development.
Note/disclaimer
No financial advice. For educational purposes only. Trading involves high risk; use stop losses and a fixed risk budget.
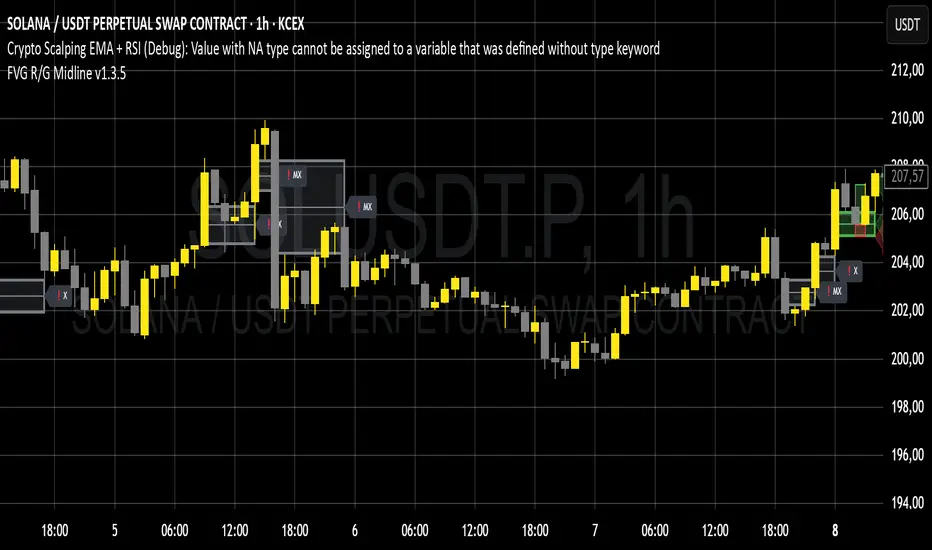
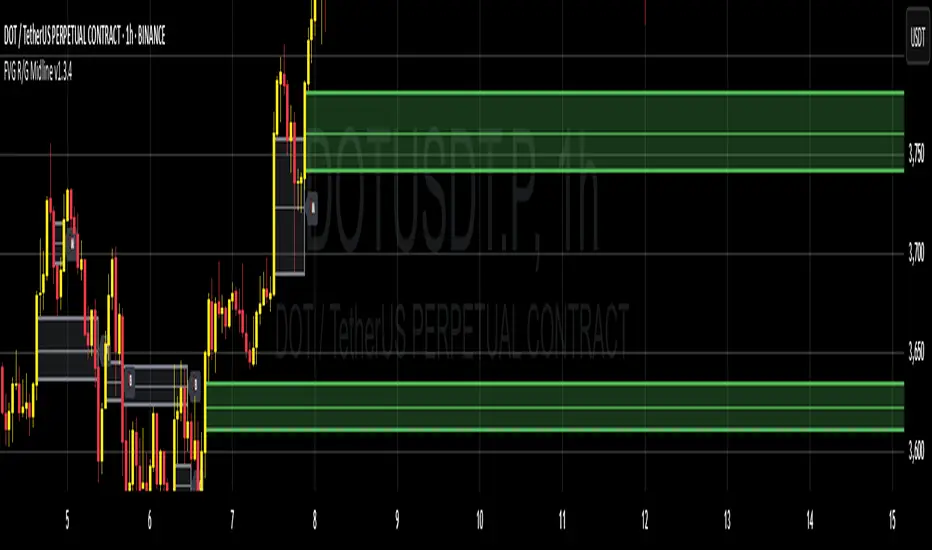
FibPivot FluidTrades ProEducational Purpose only.
Trading Plan
⏰ Timeframe
Best suited for 15-minute for direction and signal or 5/1-minute for Ep chart intraday.
For swing trades, consider 4H or 1H.
✅ Trade Setup Conditions
1. Market Structure Confirmation (MS, BOS, MSS)
Use BOS (Break of Structure) or MSS (Market Structure Shift) labels:
✅ Bullish Bias: Look for MSS/BOS up (price breaks previous swing high).
✅ Bearish Bias: Look for MSS/BOS down (price breaks previous swing low).
2. Supply & Demand Zones
Look for:
Demand box = long bias.
Supply box = short bias.
Avoid entering inside zones—wait for a retest/rejection or BOS out of zone.
3. Entry Signal
Buy Entry:
Green "Buy" shape appears. 50% of Candle
Price is above ATR trailing stop.
Signal appears near a demand zone, above MA200, and preferably above pivot level.
Sell Entry:
Red "Sell" shape appears. 50% of Candle
Price is below ATR trailing stop.
Signal appears near a supply zone, below MA200, and preferably below pivot level.
🧭 Confluences for Entry
Use 3+ of the following:
ATR trailing signal ✅
BOS/MSS ✅
Demand/Supply zone (fresh) ✅
Price above/below MA200 ✅
Close above/below pivot or Fib levels ✅
Candle breaks 50% of signal candle ✅
🎯 Entry, Stop Loss, Take Profit
Component Setting
Entry Midpoint of signal candle (auto drawn line)
Stop Loss Fixed 7 ticks (adjustable via settings)
Take Profit Fixed 14 ticks (default R:R = 2:1)
Trail Option ATR trailing stop (optional exit)
📉 Exit Strategy
Exit fully at TP line.
Or:
Partial at 1:1 (7 ticks).
Remainder at 2:1 (14 ticks).
Or trail with x ATRTrailingStop.
🚫 Avoid Trades When:
Price is inside supply/demand zones (indecision).
No BOS/MSS or weak structure.
Trading against MA200 slope/direction.
Entering near strong Fib pivot levels acting as support/resistance.
🔔 Alerts Available
Buy Signal (UT Long)
Sell Signal (UT Short)
BOS/MSS alerts (bull/bear)
🛠️ Risk Management
Risk only 1–2% of your capital per trade.
Follow the table display for low risk
Entry and Stop loss
TP
Risk-Reward Ratio (R:R)
Stick to predefined ticks for consistency.
📝 Example Trade Flow (Long):
MSS label (Bull) appears.
A Demand zone is drawn and respected.
Buy Signal appears above ATR trailing stop.
Price is above MA200.
Entry at midpoint of signal candle.
SL = -7 ticks, TP = +14 ticks.
P/S "I just wanted to say a big thank you to masterpiece FluidTrades SMC Lite script, clean, smart, and very useful. It helped me spot better entries and structure my trades properly.
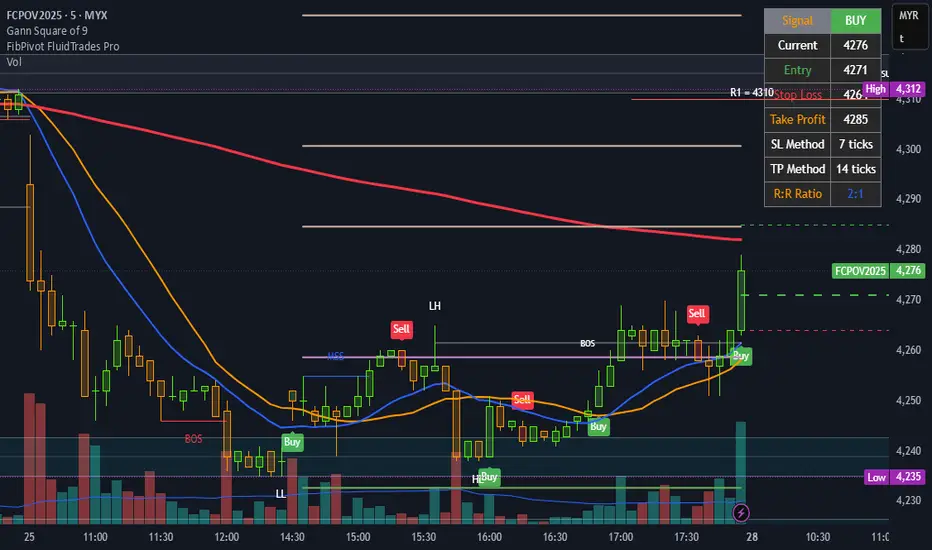
Smart Money Template📈 Smart Money Concepts – BOS / CHoCH / Order Blocks / OTE / FVG
Version: 1.0
Framework: Pine Script v5
Category: Smart Money / Price Action / Institutional Concepts
🧠 Indicator Overview
This indicator is a complete Smart Money Concepts (SMC) toolkit, built to help traders identify institutional activity and market structure shifts using key SMC principles:
• BOS (Break of Structure)
• CHoCH (Change of Character)
• Order Blocks (OB)
• OTE Zones (Optimal Trade Entry)
• FVGs (Fair Value Gaps / Imbalances)
This tool provides visual clarity and high-probability trade zones by automating what professional traders do manually.
⸻
🔍 Core Features
✅ BOS & CHoCH Detection
Automatically detects market structure breaks using HH/LL logic. BOS is highlighted when price breaks significant swing highs/lows.
✅ Order Block Zones
Draws boxes around the last bullish/bearish candle before a displacement (impulse move), showing potential institutional OB zones.
✅ OTE Zone Mapping
Calculates the Optimal Trade Entry zone between 0.705–0.79 of a price leg using Fibonacci logic. A powerful confluence area when combined with OBs.
✅ Fair Value Gap (FVG)
Detects imbalances between candles that often act as magnets for price. Visualizes price inefficiencies for future retests.
✅ Custom Inputs
You can toggle any feature on/off for cleaner analysis: BOS/CHoCH, OBs, OTE, and FVGs.
⸻
⚙️ How It Works
1. Structure Recognition:
• The script checks for Higher Highs / Lower Lows to determine trend context.
• A BOS/CHoCH label appears when structure shifts.
2. Order Blocks:
• A bullish OB is detected when the previous candle is bearish and the current one closes above its high.
• A bearish OB is vice versa.
3. OTE Levels:
• Based on daily range from high to low.
• Highlights 0.705–0.79 as a potential retracement entry zone (optimal sniper entry).
4. FVG Detection:
• If there is a gap between candle 3 and candle 1 (current candle), it is marked as an imbalance zone.
🎯 Best Use Cases
• Entry confirmations using CHoCH + OB + OTE confluence
• Liquidity grabs + FVG retest setups
• Institutional trend reversals (AMD cycles)
• Smart retracement entries using OTE zones
⸻
💡 Tips for Traders
• Works best on 15m, 1H, 4H, or Daily charts
• Combine with liquidity sweep logic, volume profile, or your own strategy for sniper precision
• Backtest using BOS + OB + FVG + OTE for high-RR setups
⸻
🛠️ Upcoming Features (Optional)
• Risk:Reward Ratio Tool
• Stop Hunt Detection (SSL/BSL)
• Volume + Sponsored Candle Filter
• Alerts for BOS / OB reaction
• SFP Pattern recognition
⸻
Disclaimer:
This tool is for educational purposes only and should be used in conjunction with your own risk management and strategy. Not financial advice.
⸻
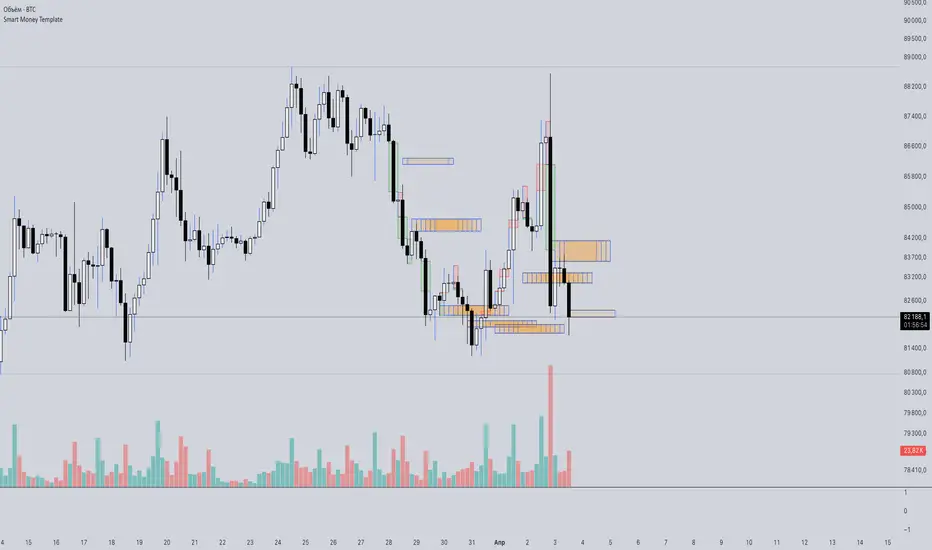
Demand and Supply MTF with SMC By StockFusion - 3.0Demand and Supply MTF with SMC By StockFusion - 3.0 - Indicator Description
Concepts
What is Supply & Demand?
Supply and Demand are foundational forces driving market dynamics. Demand reflects the presence of buyers willing to purchase a security, while Supply indicates sellers offering it for sale. These forces create zones on the chart where price tends to react—either reversing or continuing—based on the balance between buying and selling pressure. This indicator identifies these zones using price action patterns, focusing on impulsive moves (strong directional momentum) and retracement phases (consolidation or pullbacks).
What is SMC (Smart Money Concepts)?
Smart Money Concepts (SMC) revolve around tracking the behavior of institutional traders, often called "smart money." By analyzing price action, market structure shifts, and liquidity, SMC helps retail traders align with the moves of larger players. Key SMC signals like Change of Character (CHoCH), Break of Structure (BOS), liquidity sweeps, and swing points provide insights into potential trend changes or continuations.
Overview
Demand and Supply MTF with SMC By StockFusion - 3.0 is a sophisticated, price action-based indicator designed to plot real-time Supply and Demand zones across multiple timeframes (MTF) directly on your chart. It goes beyond simple zone plotting by integrating Smart Money Concepts (SMC) and Inside Candle detection, offering traders a powerful tool for spotting high-probability reversal or continuation areas. The indicator highlights zones with customizable boxes, labels them for clarity, and provides additional SMC-driven insights such as CHoCH, BOS, liquidity sweeps, and swing high/low levels. This combination of multi-timeframe analysis, SMC, and consolidation detection creates a unique and highly practical tool for traders seeking an edge in the markets.
How It Works
The indicator operates by analyzing price action across two user-defined timeframes (Higher TF and Lower TF) to detect Supply and Demand zones. It identifies these zones based on specific price patterns:
Rally Base Rally (RBR): A bullish impulsive move, followed by consolidation, then another bullish move—indicating a Demand zone.
Drop Base Drop (DBD): A bearish impulsive move, consolidation, then another bearish move—indicating a Supply zone.
Drop Base Rally (DBR): A bearish move, consolidation, then a bullish reversal—indicating a Demand zone.
Rally Base Drop (RBD): A bullish move, consolidation, then a bearish reversal—indicating a Supply zone.
These patterns are detected using criteria like explosive candle movements (based on range-to-body ratios and ATR multipliers), volume thresholds, and base candle counts (configurable from 1 to 5 candles). Zones are plotted as horizontal bands, with Higher TF zones taking precedence to avoid overlap with Lower TF zones, ensuring clarity on the chart.
Smart Money Integration:
The indicator enhances zone analysis with SMC features:
CHoCH (Change of Character): Detects shifts in market sentiment by comparing price action against recent swing highs/lows over a customizable period.
BOS (Break of Structure): Identifies when price breaks key structural levels, signaling a potential trend shift.
Liquidity Sweeps: Marks areas where price briefly exceeds swing points before reversing, often targeting stop-loss orders.
Swings: Highlights significant swing highs and lows to track momentum and structure.
Inside Candle Detection:
Inside Candles—smaller candles contained within the range of a prior candle—are plotted to indicate consolidation or indecision, often preceding breakouts. Optional lines can be drawn around these candles for better visibility.
Key Features & How to Use
Real-Time Zone Plotting:
Automatically identifies and marks Supply and Demand zones as they form, using the RBR, RBD, DBR, and DBD patterns. Zones are color-coded (e.g., green for Demand, red for Supply) and can extend rightward for visibility.
Multi-Timeframe Analysis:
Operates on all timeframes, with separate settings for Higher TF (e.g., weekly) and Lower TF (e.g., daily) zones. This allows traders to see both macro and micro levels of market structure.
Automatic Detection:
No manual input is required—zones are plotted based on price action, volume, and SMA trends. Live candle volume is displayed for context.
Tested Zone Management:
Optionally removes zones after they’re tested (price revisits and reverses) or after a second leg-out move, keeping the chart uncluttered.
Customizable Display:
Choose which patterns to detect (RBR, RBD, etc.).
Adjust base candle counts (1-5), explosive candle parameters (Range-Body Ratio, Multiplier), and quality filters (SMA length, Volume Multiplier).
Customize colors for zones, borders, labels, and candles (boring, bullish explosive, bearish explosive).
Enable/disable labels and pattern names on boxes.
Alerts:
Set notifications for zone formation, CHoCH, BOS, and liquidity sweeps on your chosen timeframe.
Inside Candle Visualization:
Highlights consolidation phases with color-coded candles and optional lines, aiding breakout anticipation.
SMC Insights:
Visualizes CHoCH, BOS, liquidity sweeps, and swings with distinct lines and labels, helping traders follow institutional moves.
How to Use It:
Approaching Zones: When price nears a Supply or Demand zone, watch for reversal patterns (e.g., pin bars, engulfing candles) or SMC signals (e.g., BOS, liquidity sweeps) to confirm entries. Combine with your tested strategy—don’t trade zones blindly.
SMC Signals: Use CHoCH for early trend reversal clues, BOS for trend continuation, and liquidity sweeps to gauge manipulation.
Inside Candles: Monitor for breakouts after consolidation periods marked by Inside Candles.
Why It’s Unique & Valuable
This indicator stands out by blending multi-timeframe Supply and Demand analysis with Smart Money Concepts and Inside Candle detection into a single, cohesive tool. While it uses classic elements like price action and volume, its proprietary logic—combining specific pattern detection (RBR, RBD, DBR, DBD), SMC signals (CHoCH, BOS, etc.), and consolidation tracking—offers a fresh approach. Unlike generic trend-following or scalping tools, it provides actionable insights into market structure and institutional behavior, making it worth considering for traders willing to invest in a premium tool. The flexibility of customization and MTF functionality further enhances its utility across trading styles, from scalping to swing trading.

Market Structure Break Targets [UAlgo]The "Market Structure Break Targets " indicator is designed to identify and visualize key market structure points such as Market Structure Breaks (MSBs) and Break of Structures (BoS). These points are crucial for understanding market trends and potential reversal zones. By plotting these structures on the chart, traders can easily spot significant support and resistance levels, as well as potential entry and exit points.
This indicator uses a combination of swing highs and lows to determine market structures and calculates targets based on user-defined percentages or Average True Range (ATR) multipliers. It provides visual cues in the form of lines, labels, and boxes to help traders quickly interpret market conditions.
🔶 Key Features
Customizable Swing Length: Users can set the swing length to identify the pivot highs and lows, which are crucial for determining market structure.
Target Duration Bars: Defines the maximum duration (in bars) for which the targets will be considered valid.
Target Calculation Methods: The target levels are crucial for setting potential price objectives. The calculation can be based on a percentage move from the identified pivot or using the ATR to factor in market volatility. These targets help in setting realistic profit-taking levels or identifying stop-loss placements.
Bullish and Bearish Market Structure Break (MSB): Detects and highlights bullish and bearish market structure breaks with customizable colors and target percentages.
Bullish MSB
When the price closes above a significant pivot high, a bullish MSB is identified. The indicator will draw a line at this level and calculate a target based on the chosen method (percentage or ATR). The target is visualized with a dotted line, and a label "MSB" is displayed. Additionally, an order block is created at the level of the bullish MSB. This order block is highlighted with a semi-transparent box, representing a potential area where price might find support in the future.
Bearish MSB
Conversely, when the price closes below a significant pivot low, a bearish MSB is marked. Similar to bullish MSBs, targets are calculated and displayed on the chart. An order block is also generated at the level of the bearish MSB, visualized with a semi-transparent box. This box highlights a potential resistance area where price might face selling pressure.
Bullish and Bearish Break of Structure (BoS): Identifies break of structures for both bullish and bearish scenarios, providing additional target levels.
Bullish BoS
If the price continues to rise and breaks another significant level, a bullish BoS is detected. This break is also marked with lines and labels, providing additional target levels for traders. An order block is created at the BoS level, serving as a potential support zone.
Bearish BoS
If the price falls further after a bearish MSB, a bearish BoS is identified and visualized similarly. The indicator creates an order block at the BoS level, which acts as a potential resistance zone.
🔶 Disclaimer:
Use with Caution: This indicator is provided for educational and informational purposes only and should not be considered as financial advice. Users should exercise caution and perform their own analysis before making trading decisions based on the indicator's signals.
Not Financial Advice: The information provided by this indicator does not constitute financial advice, and the creator (UAlgo) shall not be held responsible for any trading losses incurred as a result of using this indicator.
Backtesting Recommended: Traders are encouraged to backtest the indicator thoroughly on historical data before using it in live trading to assess its performance and suitability for their trading strategies.
Risk Management: Trading involves inherent risks, and users should implement proper risk management strategies, including but not limited to stop-loss orders and position sizing, to mitigate potential losses.
No Guarantees: The accuracy and reliability of the indicator's signals cannot be guaranteed, as they are based on historical price data and past performance may not be indicative of future results.

Stock Bee's 4%Stock Bee's 4%
First Things First
- This indicator is a replica of Pradeep Bonde aka Stock Bee’s 4% indicator which he uses in the TC2000 platform for trading momentum burst and EP 9 million setup.
- Disclaimer: This indicator will not give any buy or sell signal. This is just a supporting tool to improve efficiency in my trading.
- Apply Indicators and then open indicator settings and read the following simultaneously to understand better.
- Default color settings are best suited for light themes. Which is also my personal preference.
- Users can change most of the default options in settings according to their personal preference in settings.
- When we open settings we can see 3 tabs that are {Inputs tab} {Style tab} {Visibility tab} each tab have its own options, Understand and use it accordingly.
- Background Color grading that is “Green” background means parameter favorable, “Red” not favorable for my trading.
- Indicator will be only visible in the Daily time frame as its primary TF is daily. In the lower time frame nothing is plotted.
- An indicator is plotted on a different plane and does not overlay in the existing plane.
Contents
+4% BO
-4% BO
Volume
+4% BO
- If the %change is more than 4% and today's volume > yesterday's volume and volume > 100000 then the green line is plotted from 0 to 1.
- This helps in trading momentum burst setup and to spot 4% BO easily.
{Style Tab}
- “Check Mark” Users can Show/Hide the line.
- “+4% BO” Default “Green color”. Users have the option to change.
- “Line Type” Default settings, Users have the option to change.
-4% BO
If the %change is less than -4% and today's volume > yesterday's volume and volume > 100000 then the green line is plotted from 0 to 1.
This helps in trading momentum burst setup and to spot -4% BO easily.
{Style Tab}
- “Check Mark” Users can Show/Hide the line.
- “-4% BO” Default “Red color”. Users have the option to change.
- “Line Type” Default settings, Users have the option to change.
Volume
- If Today’s Volume is greater than Default settings that is 9 Million then Blue color line is plotted similar to +/-4% B) however if u want to plot like Pradeep Bonde aka Stock Bee style then user have to change settings from “line” type to “histogram” type in style tab of settings.
- This is used for spotting EP 9 Million setup.
{Input Tab}
- “Volume” Default is (9). Users have the option to change as per their preference. And the number should be in millions.
{Style Tab}
- “Check Mark” Users can Show/Hide the line.
- “Volume” Default ”Blue color”. Users have the option to change.
- “Line Type” Default settings, Users have the option to change.
To use it similar to Stock Bee, change “Line” to “Histogram”.
Highly Recommended Setting to change immediately
{Style Tab} Outputs Section
“Check Mark” Labels on price scale. “Uncheck it”.
“Check Mark” Values in Status Line. “Uncheck it”.
*****
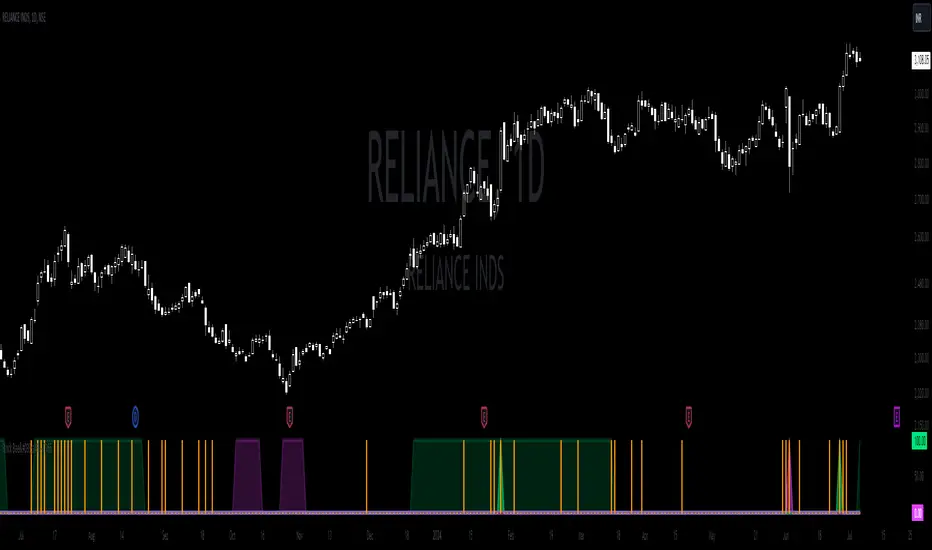
Zendog V2 backtest DCA bot 3commasHi everyone,
After a few iterations and additional implemented features this version of the Backtester is now open source.
The Strategy is a Backtester for 3commas DCA bots. The main usage scenario is to plugin your external indicator, and backtest it using different DCA settings.
Before using this script please make sure you read these explanations and make sure you understand how it works.
Features:
- Because of Tradingview limitations on how orders are grouped into Trades, this Strategy statistics are calculated by the script, so please ignore the Strategy Tester statistics completely
Statistics Table explained:
- Status: either all deals are closed or there is a deal still running, in which case additional info
is provided below, as when the deal started, current PnL, current SO
- Finished deals: Total number of closed deals both Winning and Losing.
A deal is comprised as the Base Order (BO) + all Safety Orders (SO) related to that deal, so this number
will be different than the Strategy Tester List of Trades
- Winning Deals: Deal ended in profit
- Losing deals: Deals ended with loss due to Stop Loss. In the future I might add a Deal Stop condition to
the script, so that will count towards this number as well.
- Total days ( Max / Avg days in Deal ):
Total Days in the Backtest given by either Tradingview limitation on the number of candles or by the
config of the script regarding "Limit Date Range".
Max Days spent in a deal + which period this happened.
Avg days spent in a deal.
- Required capital: This is the total capital required to run the Backtester and it is automatically calculated by
the script taking into consideration BO size, SO size, SO volume scale. This should be the same as 3commas.
This number overwrites strategy.initial_capital and is used to calculate Profit and other stats, so you don't need
to update strategy.initial_capital every time you change BO/SO settings
- Profit after commission
- Buy and Hold return: The PnL that could have been obtained by buying at the close of the first candle of the
backtester and selling at the last.
- Covered deviation: The % of price move from initial BO order covered by SO settings
- Max Deviation: Biggest market % price move vs BO price, in the other direction (for long
is down, for short it is up)
- Max Drawdown: Biggest market % price move vs Avg price of the whole Trade (BO + any SO), in the other
direction (for long price goes down, for short it goes up)
This is calculated for the whole Trade so it is different than List of Trades
- Max / Avg bars in deal
- Total volume / Commission calculated by the strategy. For correct commission please set Commission in the
Inputs Tab and you may ignore Properties Tab
- Close stats for deals: This is a list of how many Trades were closed at each step, including Stop Loss (if
configured), together with covered deviation for that step, the number of deals, and the percentage of this
number from all the deals
TODO: Might add deal avg value for each step
- Settings Table that can be enabled / disabled just to have an overview of your configs on the chart, this is a
drawn on bottom left
- Steps Table similar to 3commas, this is also drawn on bottom left, so please disable Settings table if you want
to see this one
TODO: Might add extra stats here
- Deal start condition: built in RSI-7 or plugin any external indicator and compare with any value the indicator plots
(main purpose of this strategy is to connect your own studies, so using external indicator is recommended)
- Base order and safety orders configs similar to 3commas (order size, percent deviation, safety orders,
percent scale and volume scale)
- Long and Short
- Stop Loss
- Support for Take profit from base order or from Total volume of the deal
- Configs help (besides self explanatory):
- Chart theme: Adjust according to the theme you run on. There is no way to detect theme at the moment.
This adjust different colors
- Deal Start Type: Either a builtin RSI7 or "External indicator"
- Indicator Source an value: If using External Indicator then select source, comparison and value.
For example you could start a deal when Volume is greater than xxxx, or code a custom indicator that plots
different values based on your conditions and test those values
- Visuals / Decimals for display: Adjust according to your symbol
- BO Entry Price for steps table: This is the BO start deal price used to calculate the steps in the table
