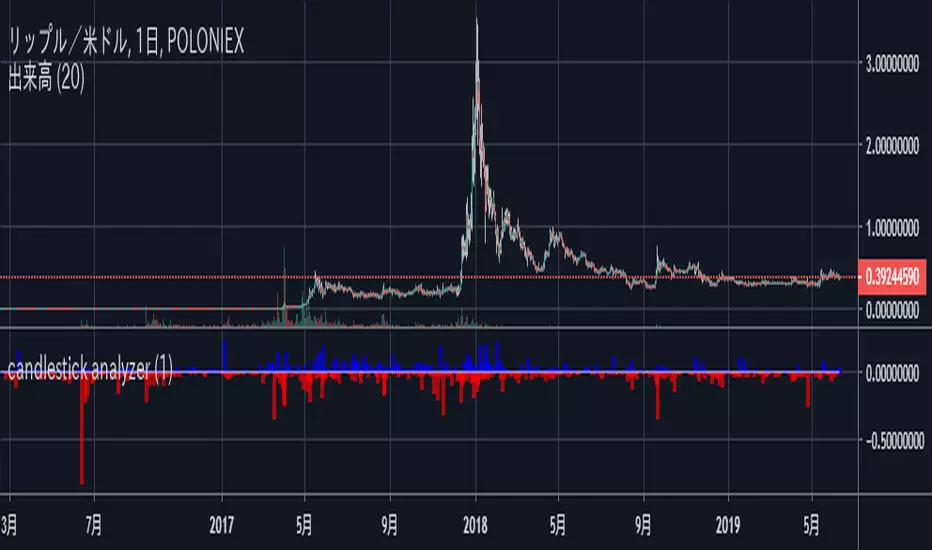
.BXBT IndexThe current .BXBT index weighted as close as possible to BitMEX's with updates as BitMEX refreshes their index.
Difference between this and the script titled '2020 March 27 .BXBT Index': this one will receive updates because it doesn't have a date in its title.
Methodology
www.bitmex.com
"BitMEX Index Weights, assuming no constituent exchanges have been excluded due to Index Protection Rules, last updated 27 December 2019 at 12:00:05 UTC."
Binance: -
Bitstamp: 10.61%
Bittrex: 2.53%
Coinbase: 52.30%
Gemini: 6.89%
Huobi: -
Itbit: 4.21%
Kraken: 23.46%
Poloniex: -
ItBit's weight is combined with Gemini's due to ItBit not being on TradingView as of now. BITTREX:BTCUSD substituted with BITTREX:BTCUSDT*POLONIEX:USDTUSD to backfill because Bittrex only recently (late 2018) started to offer a fiat BTC/USD pair. Not that it matters since the index used in 2018 didn't include Bittrex if I remember correctly.
What is actually used for 27/12/2019 to 27/03/2020:
Binance: -
Bitstamp: 10.61%
Bittrex: 2.53%
Coinbase: 52.30%
Gemini: 11.10%
Huobi: -
Itbit: -
Kraken: 23.46%
Poloniex: -
Options:
Toggle candlesticks or close line
Change price source to be used for indicators
To be added: Change quarter to show indexes for different times, with labels that apply to the appropriate index used
Reasons to use this vs. the index itself: (not many)
It is helpful as a reference for other indicators or creation of an index.
ابحث في النصوص البرمجية عن "Candlestick"


candlestick analyzerThis indicator measures lengths of shadows of candlesticks, which is defined as "(close - open+high - max(open,close))/(close - open+low - min(open,close))*(high-low) "
BEARISH Dark Cloud Cover/BULLISH PiercingThe script highlights the 2 candlesticks pattern: BEARISH Dark Cloud Cover/BULLISH Piercing on the main chart screen, and has a preset alert condition. Please use an oscillator that shows oversold and overbought conditions with this script (i.e. StochRSI oscillator).
EngulfingThe script highlights a Bullish/Bearish Engulfing 2 candlesticks pattern on the main chart screen, and has a preset alert condition. Please use an oscillator that shows oversold and overbought conditions with this script (i.e. StochRSI oscillator).

Bullish Harami Backtest This is a bullish reversal pattern formed by two candlesticks in which a small
real body is contained within the prior session's unusually large real body.
Usually the second real body is the opposite color of the first real body.
The Harami pattern is the reverse of the Engulfing pattern.
WARNING:
- For purpose educate only
- This script to change bars colors.

Bullish Harami Strategy This is a bullish reversal pattern formed by two candlesticks in which a small
real body is contained within the prior session's unusually large real body.
Usually the second real body is the opposite color of the first real body.
The Harami pattern is the reverse of the Engulfing pattern.
WARNING:
- This script to change bars colors.
Bearish Harami Backtest This is a bearish reversal pattern formed by two candlesticks in which a short
real body is contained within the prior session's long real body. Usually the
second real body is the opposite color of the first real body. The Harami pattern
is the reverse of the Engulfing pattern.
WARNING:
- For purpose educate only
- This script to change bars colors.

MA CandlesOHLC calculated with a moving average.
You can replace sma with anything. EMA, Hull, sma(sma(sma(sma(close, etc.
You could also make it look clean like Heikin Ashi candlesticks if you include min/max for low/high wicks on candles.

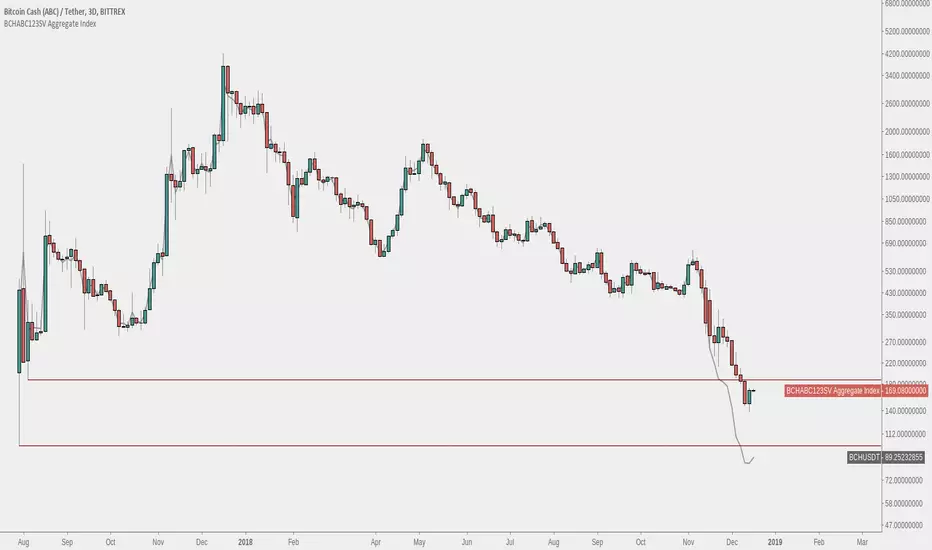
Bitcoin Cash - BCHABCSV Aggregate IndexAn index of both Bitcoin Cash ABC pre-fork and Bitcoin Cash ABC + Bitcoin Cash SV post-fork.
The pre-fork BCH used is from Bittrex, and Binance is used for ABC and SV afterwards.
Option to choose USDT or BTC pairing.
Instructions:
1. Load up a BCH chart from Bittrex, ex. 'BITTREX:BCHABCUSDT' or 'BITTREX:BCHSVBTC' for full chart history
2. Hide original candlesticks
3. Right click the price scale and untick 'Scale Price Chart Only'
Bithumb Ticker USD/BTC PairConverts Bithumb tickers into USD or bitcoin pairings from KRW.
This currently uses the FX pair to convert. There is an option to toggle between candlesticks and line.


Bullish Harami automatic finding script Hi
Let me introduce my Bullish Harami automatic finding script.
This is a bullish reversal pattern formed by two candlesticks in which a small
real body is contained within the prior session's unusually large real body.
Usually the second real body is the opposite color of the first real body.
The Harami pattern is the reverse of the Engulfing pattern.
This pattern marked as yellow.
LockedEye Trading Navigator**LockedEye Trading Navigator — Summary**
This script is a real-time market decision dashboard designed to prevent impulsive trades by forcing structure, context, and confirmation checks into a single glance. It does not generate blind buy/sell signals. It evaluates market conditions, trend alignment, and risk context before allowing a trade bias.
**Core Purpose**
Acts as a pre-trade checklist, not a signal spammer.
Helps traders wait, filter, and align with structure.
Designed for scalping to intraday trading.
Optimized to reduce FOMO entries and late trades.
**Key Features**
**1. Market State Detection**
Classifies the market into TREND ↑, TREND ↓, or COOKING (ranging/compression).
Uses volatility compression and linear regression slope to prevent trading during low-quality conditions.
**2. Multi-Timeframe Moving Average Alignment**
Tracks trend alignment using EMA 6 & 21 (momentum bias), EMA 50 (mid-trend filter), EMA 200 (macro bias), and EMA 70 & 99 on M15 (higher-timeframe confirmation).
Each MA condition is displayed with directional arrows and color-coded backgrounds.
**3. Break of Structure (BOS)**
Detects bullish or bearish structure breaks based on recent range.
Flags BULL, BEAR, or NO.
Used as structural confirmation, not as a standalone signal.
**4. MACD Momentum Bias**
Evaluates MACD line versus signal line.
Outputs BULL, BEAR, or NONE.
Acts as momentum confirmation for trend continuation or exhaustion.
**5. RSI Divergence Detection**
Detects basic bullish and bearish divergence.
Highlights momentum disagreement with price.
Used as a boost factor, not a trigger.
**6. Candlestick Context**
Identifies bullish engulfing, bearish engulfing, and doji candles.
Used to validate entry timing rather than direction alone.
**7. Volume Behavior**
Compares current volume to a 20-period SMA.
Flags INCREASING or DECREASING to confirm whether price movement is supported by participation.
**8. ICT Candle Logic (Correctly Color-Coded)**
Evaluates the current close relative to the previous candle.
INSIDE: Close remains within the previous high/low, indicating consolidation.
OUTSIDE (Green): Close above previous high, indicating bullish expansion.
OUTSIDE (Red): Close below previous low, indicating bearish expansion.
Helps avoid misreading fake breakouts and inside bars.
**9. Price Location Awareness**
Determines whether price is at SUPPORT, at RESISTANCE, or in MID range.
Ensures trades are only considered where risk is logical.
**10. Final Trade Summary Engine**
Outputs one of four states: LONG OK, SHORT OK, WAIT, or NO TRADE.
Requires trend alignment, MACD agreement, structure and location validation, and at least one supporting confirmation.
**Design Philosophy**
No repainting by default.
No emotional signals.
No hindsight bias.
Forces discipline and patience.
Designed as a decision filter, not a prediction tool.
**Best Use Case**
Scalping and intraday trading.
Traders who struggle with overtrading.
Traders who want structure before execution.
Works best when combined with manual price action reading.

optionboss1. Dual-Directional Scalping Intelligence
This optionboss is built to identify high-probability Call (CE) and Put (PE) opportunities in real-time. It eliminates guesswork by providing clear "BUY CE" and "BUY PE" labels directly on the candles when the trend is ready to reverse or extend.
2. Proprietary "Dual Space" Logic
The script uses a specialized "Distance-from-Mean" calculation. It only triggers signals when the price is overextended (far from the baseline), ensuring you aren't trading in the "choppy" middle zone. This significantly reduces false signals compared to standard indicators.
3. Automatic T1 Target Projection
Stop wondering where to take profits. The optionboss automatically draws a T1 Target Line the moment a signal appears.
4. Candlestick "Elimination" Verification
The signal logic is based on institutional price action. A "BUY CE" only triggers when a green candle successfully "takes out" the high of a previous red candle at an extreme level, confirming that buyers have seized control.
5. Clean & Stealth Interface
Designed for professional traders who want a clean chart. The core moving averages are hidden behind generic "Sensitivity" settings to protect the strategy’s secrets. You get clear, non-repainting labels that stay fixed once the candle closes.
6. Fully Customizable for All Markets
While optimized for 5-minute scalping, the "Primary" and "Secondary" sensitivity inputs allow you to tune the engine for Nifty, Bank Nifty, Forex, or Crypto.
How to get access:
"This is a private, Invite-Only script. To maintain the quality of the signals and protect the strategy, access is restricted to authorized users. Please message me directly for subscription details and to have your TradingView username added to the access list."

Nifty_2MIN_Rangereversal_Short_StrategySummary
This strategy is an intraday trend-following system designed for the Nifty index on a 2-minute timeframe, focusing exclusively on short (sell) entries. It is engineered to identify failed bounces within established bearish trends.
Concept & Core Logic
The strategy uses a multi-layered approach to confirm downward momentum before triggering an entry:
Trend Confirmation: The script analyzes the slope and positioning of the 20-period and 200-period Exponential Moving Averages (EMA). Short signals are only valid when the EMA configuration confirms a prevailing bearish trend.
Retracement Zone Filtering: To optimize entry pricing, the strategy monitors the daily price range. It looks for the market to be within the 35% to 75% range of the day's movement, specifically identifying a temporary upward "relief rally" or bounce after a significant fall.
Candlestick Trigger: The execution occurs when a specific bearish reversal pattern appears during the relief rally:
Two consecutive bullish candles (representing the temporary bounce).
Followed by a strong, high-momentum bearish candle (signaling the resumption of the primary downtrend).
Risk Management
The strategy utilizes fixed exit parameters based on the underlying Nifty price points:
Take Profit: 28 points.
Stop Loss: 30 points.
Intended Use
This tool is intended for traders who study mechanical, rule-based systems. It demonstrates how moving average trends can be combined with range analysis and price action sequences to time entries during market retracements.
Disclaimer: This script is for educational and informational purposes only. It is not financial advice. All trading involves risk, and past performance is not indicative of future results. Please conduct your own research and backtesting before making any trading decisions.

Market Structure [BOS/ChoCh Line & Bar-Chart]Overview
A comprehensive market structure indicator that identifies Break of Structure (BOS) and Change of Character (CHoCH) patterns - essential concepts in Smart Money trading methodology.
━━━━━━━━━━━━━━━━━━━━━━━━━━━━━━━━━━━━━━━━
🔹 KEY FEATURES
Two detection modes: Swing-based (High/Low) and Line Chart-based (Close)
Automatic HH/LL/LH/HL labeling with price and percentage change
BOS (Break of Structure) for trend continuation
CHoCH (Change of Character) for trend reversals
Market Structure Candle Coloring (MSC)
Optional Line Chart overlay
Fully customizable colors and display options
Built-in alerts for BOS and CHoCH events
━━━━━━━━━━━━━━━━━━━━━━━━━━━━━━━━━━━━━━━━
🔹 DETECTION MODES
Swings Mode
Uses candlestick highs and lows to identify swing points. This is the traditional approach and works well for most trading styles.
Line Chart Mode
Uses closing prices only to identify peaks and troughs - similar to how a line chart displays price action. This mode filters out wicks and can provide cleaner structure identification.
━━━━━━━━━━━━━━━━━━━━━━━━━━━━━━━━━━━━━━━━
🔹 STRUCTURE LABELS
HH (Higher High) - Price made a new high above the previous high → Bullish
HL (Higher Low) - Price made a higher low → Bullish
LH (Lower High) - Price failed to make a new high → Bearish
LL (Lower Low) - Price made a new low below the previous low → Bearish
━━━━━━━━━━━━━━━━━━━━━━━━━━━━━━━━━━━━━━━━
🔹 BOS vs CHoCH
BOS (Break of Structure)
A continuation signal. Occurs when price breaks a key level in the direction of the current trend.
Bullish BOS: Price closes above the last swing high during an uptrend
Bearish BOS: Price closes below the last swing low during a downtrend
CHoCH (Change of Character)
A reversal signal. Occurs when price breaks the key level that would invalidate the current trend.
Bullish CHoCH: During a downtrend, price closes above the high that produced the last Lower Low
Bearish CHoCH: During an uptrend, price closes below the low that produced the last Higher High
━━━━━━━━━━━━━━━━━━━━━━━━━━━━━━━━━━━━━━━━
🔹 CANDLE COLORING (MSC)
When enabled, candles are colored based on the current market structure trend:
Bullish trend: Candles colored in the bullish color
Bearish trend: Candles colored in the bearish color
Trend-conforming candles appear solid, counter-trend candles appear faded
Note: For best results, go to Chart Settings → Symbol and set Body/Border/Wick colors to transparent.
━━━━━━━━━━━━━━━━━━━━━━━━━━━━━━━━━━━━━━━━
🔹 SETTINGS
Market Structure Settings
Detection Mode - Choose between Swings or Line Chart
Swing Length - Sensitivity of pivot detection (higher = less sensitive)
Show BOS / Show CHoCH - Toggle display of each pattern type
Line Chart Display
Show Line Chart - Display the close-based line overlay
Line Chart Color / Width - Customize appearance
Labels & Extra Data
Show HH/LL/LH/HL Labels - Toggle swing point labels
Show Price at Pivots - Display price values
Show % Change - Display percentage change between swings
━━━━━━━━━━━━━━━━━━━━━━━━━━━━━━━━━━━━━━━━
🔹 ALERTS
The indicator includes alerts for:
Bullish/Bearish BOS
Bullish/Bearish CHoCH
━━━━━━━━━━━━━━━━━━━━━━━━━━━━━━━━━━━━━━━━
🔹 USAGE TIPS
Use higher Swing Length values on higher timeframes to filter noise
CHoCH signals potential trend reversals - consider waiting for confirmation
BOS signals trend continuation - can be used for entries in the trend direction
Combine with other confluence factors like support/resistance, order blocks, or volume analysis
The Line Chart mode can help identify structure on volatile instruments where wicks create noise
For best display of bar coloring set Visual Order -> Bring to Front

Wavelet Candlestick Slope Follower-Master Edition Here is a short description of this script:
This is a **Trend Following strategy** that utilizes advanced mathematics—the **Wavelet Transform**—to filter out market noise.
**Key Features:**
1. **Synthetic Candles:** The script does not analyze raw prices. Instead, it constructs "Wavelet Candles"—smoothed candles created through mathematical convolution of prices with a specific wavelet "kernel" (e.g., Mexican Hat, Morlet, Haar).
2. **Auto-Correction (Normalization):** This is the most critical technical feature of this code. The script automatically normalizes the weights. This ensures that even when using complex mathematical shapes (like the Mexican Hat), the output price remains accurate to the real chart scale and is not distorted.
3. **Strategy Logic:** The logic is very straightforward—the system enters a **Long** position when the smoothed closing price (`w_close`) is rising, and closes the position when it starts to fall.
4. **Visualization:** It draws new, cleaner candles (green/red) on the chart, revealing the "true" trend structure after filtering out temporary fluctuations.
This is a example of use idea of wavelet candle

ETIQUETAS DE ANCLAJE.INTERVALO 9:00 AM/4.15PMThis indicator displays labels on the candlestick that range from 9:00 am to 4:15 pm, with 5-minute intervals, indicating the 5M periods on the chart.


Reversal Buy and Sell SignalsThis indicator is fast and minimalistic reversal-detection indicator designed to capture high-probability turning points in the market. It combines engulfing candlestick patterns, a strong candle body filter, and RSI momentum analysis to generate precise BUY and SELL signals with minimal noise.

CVD Candle Divergence IndicatorThis indicator identifies potential reversal points by comparing the direction of price candles with the direction of cumulative volume delta (CVD) candles, while applying additional filters based on RSI behavior, volume strength, and candlestick wick structure.
It aims to highlight situations where price movement and volume delta disagree, which can signal fading momentum or absorption.
Core Concept
The script combines several independent conditions that must occur simultaneously before a signal is displayed on the chart. A signal appears only when all filters agree, reducing the number of low-quality or noise-based setups.
1. CVD Candle Direction
The indicator uses TradingView’s built-in function for volume delta candles. These candles summarize buying and selling aggression derived from lower-timeframe volume.
A CVD green candle indicates more buyer-initiated volume.
A CVD red candle indicates more seller-initiated volume.
The script looks for instances where price and CVD candles disagree:
Bullish signal: price candle is green while CVD candle is red
Bearish signal: price candle is red while CVD candle is green
This creates a form of divergence using volume delta instead of price highs and lows.
2. RSI Context Filter
Momentum is evaluated through RSI. Instead of relying only on standard overbought/oversold levels, the script also includes a recency filter based on the RSI midline (50 level).
RSI Threshold
Users can specify the RSI value required for bullish and bearish conditions.
Recency Filter
The indicator only allows signals if RSI has crossed the 50 level within a user-defined number of bars. This prevents signals during extended one-directional trends where divergence is less meaningful.
3. Volume Strength Filter
Signals are filtered through a volume-based requirement:
Current volume must exceed a moving average of volume multiplied by a user-defined factor.
This ensures that signals appear only during periods with sufficient participation and reduces noise during low-volume consolidation.
4. Wick-to-Body Ratio Filter
To incorporate price-action characteristics, the script evaluates the wick structure of each candle:
Bullish signals require a sufficiently large lower wick relative to the total candle range.
Bearish signals require a sufficiently large upper wick relative to the total candle range.
The wick percentage is fully configurable.
This adds a rejection or absorption component to the logic and prevents signals on weak or indecisive candles.
Signal Conditions
A bullish signal appears when all of the following are true:
Price candle is green
RSI is below the bullish threshold
CVD candle is red
Volume is above its threshold (if enabled)
RSI has interacted with the 50 level recently
Lower wick meets the wick-percentage requirement
A bearish signal requires the opposite conditions:
Price candle is red
RSI is above the bearish threshold
CVD candle is green
Volume is above its threshold (if enabled)
RSI recently interacted with the 50 level
Upper wick meets the wick-percentage requirement
Signals appear as arrows directly on the chart.
Use Cases
This indicator is intended for traders who work with:
Momentum shifts
Volume delta analysis
Candle structure-based confirmation
Reversal or exhaustion setups
Divergence concepts beyond price highs/lows
It does not predict market direction. Instead, it highlights areas where multiple conditions suggest a potential imbalance between price movement and volume delta.
I would strongly suggest to use this indicator only on timeframes 2-15m.
Here are a few examples:

aPraJaiThis indicator Overlays Heikin Ashi Candles over the normal Candlestick pattern for you to be able to view both candle types simultaneously.
