HTF Entry Model+ [#] by @shulktradesHTF Entry Model+ by @shulktrades
Overview
The HTF Entry Model+ is a multi-timeframe trading indicator that identifies algorithmic signatures in price action and automatically displays complete entry setups with risk-to-reward projections. When specific order flow patterns are detected on a higher timeframe, the indicator calculates and displays entry zones, stop loss placement, and multiple profit targets - giving traders a complete trade plan before price reaches the entry level.
What This Indicator Does
Identifies Algorithmic Price Patterns
The indicator monitors a higher timeframe to detect specific signatures in price action that signal potential reversals or continuations. These patterns represent moments when institutional order flow creates measurable shifts in market dynamics.
Key Points:
- Analyzes higher timeframe price structure continuously
- Detects order flow signatures that precede directional moves
- Confirms patterns only when specific conditions are met
- Filters out low-quality signals automatically
Projects Complete Entry Models
When a valid pattern is detected, the indicator immediately calculates and displays a full trade setup with all necessary levels clearly marked on your chart.
What Gets Displayed:
- Entry zone (optimal price area to enter the trade)
- Stop loss level (where to exit if wrong)
- Multiple profit targets (1:1, 1:2, 1:3, 1:4, 1:5, 1:6, 1:7)
- OTE levels (Optimal Trade Entry zone & OTE + take profit model)
- Risk-reward ratios for each target
Adapts to Your Timeframe
The indicator intelligently selects an appropriate higher timeframe based on your current chart, or you can manually choose which timeframe to analyze.
Timeframe Relationships:
- 1-5 minute charts → analyzes 15-60 minute structure
- 15-30 minute charts → analyzes 4-hour structure
- 1 hour charts → analyzes daily structure
- 4 hour charts → analyzes weekly structure
- Daily charts → analyzes monthly structure
How Traders Use This Indicator
Step 1: Wait for Setup Detection
The indicator runs in the background, continuously scanning the higher timeframe for algorithmic signatures. When detected, a horizontal marker appears at the pattern formation level.
Step 2: Review the Entry Model
Once confirmed, the complete risk-reward projection displays instantly:
- All entry and exit levels are clearly labeled
- Stop loss shows exactly where the setup invalidates
- Multiple targets allow for systematic profit-taking
- Color coding shows bullish (green) or bearish (red) direction
Step 3: Plan Your Trade
Before price retraces to the entry zone, you have complete information:
- Know your exact entry price levels
- Know your exact stop loss placement
- Know multiple profit target levels
- Calculate position size based on the risk shown
Step 4: Execute When Price Returns
Wait for price to retrace back into the entry zone (OTE levels), then execute your trade with predefined parameters.
Step 5: Manage According to the Model
Use the displayed targets to manage your position:
- Scale out partial profits at each target level
- Move stops to breakeven after first or second target
- Let remaining position run toward extended targets
Key Features
Smart Pattern Recognition
- Detects specific algorithmic signatures that precede high-probability moves
- Validates patterns using proprietary order flow analysis
- Filters signals based on market structure quality
- Reduces false signals in choppy or ranging conditions
Complete Risk-Reward Framework
- Entry zones marked with "OTE" labels at optimal prices
- Stop loss clearly labeled at pattern invalidation point
- Seven profit targets (1:1 through 1:7 risk-reward)
- Additional reference levels for advanced trade management
Liquidity-Based Validation
- Monitors higher timeframe liquidity dynamics
- Identifies when stops are likely being hunted
- Confirms setups that follow liquidity sweeps
- Distinguishes high-quality from lower-quality signals
Session Time Filtering
- Optional time-based filtering for entry model display
- Set specific trading hours when setups should appear
- Useful for focusing on active market sessions
- Can be disabled for swing trading or higher timeframes
Clean Visual Presentation
- Color-coded setups (green for bullish, red for bearish)
- Clearly labeled levels (Entry, Stop Loss, OTE, 1:1, 1:2, etc.)
- Minimal chart clutter - only active setups display
- All historical setups remain visible for backtesting
Configuration Options
Higher Timeframe Settings
- Auto Mode: Automatically selects optimal higher timeframe for your chart
- Fixed Mode: Manually choose any specific timeframe to analyze
- Provides flexibility for different trading strategies and preferences
Visual Customization
- Bullish Color: Choose color for long setups (default: green)
- Bearish Color: Choose color for short setups (default: red)
- Display Length: Adjust how far forward the levels project
- Clean, professional appearance on any chart theme
Time Filter Options
- Enable/Disable Toggle: Turn session filtering on or off
- Entry Timeframe: Specify exact trading hours for setup display
- Recommended Usage: Enable for day trading, disable for swing trading
- Timezone adjustable to match your market hours
Who This Indicator Is For
Day Traders & Scalpers
- Get precise entry timing on intraday timeframes
- Clear stop placement for tight risk management
- Multiple targets for scaling out positions
- Session filtering helps focus on active market hours
Seconds Timeframe
5m Timeframe
Swing Traders
- Higher timeframe analysis for multi-day positions
- Structured entry and exit planning
- Extended targets for longer-term moves
- Can disable time filtering for 24-hour analysis
Multi-Timeframe Traders
- Aligns entries across different timeframes
- Provides higher timeframe context automatically
- Helps identify confluence between timeframes
- Works on any liquid market (stocks, futures, forex, crypto)
Systematic Traders
- Pre-defined entry and exit levels before execution
- Consistent risk-reward framework on every setup
- Historical setups remain visible for backtesting
- Removes emotional decision-making from entries
Market Compatibility
Best Performance On:
- Futures contracts (ES, NQ, YM, CL, GC, etc.)
- Major forex pairs (EUR/USD, GBP/USD, USD/JPY, etc.)
- Liquid stocks and ETFs
- Major cryptocurrency pairs
Optimal Timeframes:
- 1-minute to 1-hour: Intraday trading and scalping
- 4-hour to Daily: Swing trading and position entries
- Works on higher timeframes but signals become less frequent
Market Conditions:
- Most effective in trending or impulsive markets
- Automatically filters lower-quality ranging setups
- Adapts to different volatility environments
- Functions across all market sessions
Important Information
What This Indicator Does NOT Do
- Does not predict future price movement
- Does not guarantee profitable trades
- Does not show internal calculation methods or specific detection criteria
- Does not display the pattern scanning process (only confirmed setups)
What Traders Should Understand
- This tool identifies potential setups based on candlestick order flow analysis
- All trading involves risk - use appropriate position sizing
- Combine with your own analysis and market understanding
- Proper risk management is essential regardless of signal quality
- Past setup performance does not guarantee future results
Standard Risk Management Guidelines
Position Sizing
- Risk only 1-2% of account capital per trade
- Use the displayed stop loss distance to calculate position size
- Adjust size smaller for lower-confidence setups
- Never risk more than you can afford to lose
Stop Loss Placement
- Always honor the displayed stop loss level
- Place stops at or slightly beyond the marked level
- Do not move stops further away if trade moves against you
- Accept the loss if stop is hit and wait for next setup
Profit Taking Strategy
- Consider scaling out at multiple target levels
- Take some profit at 1:1 to reduce risk to zero
- Let remaining position run toward extended targets
- Move stops to breakeven after first target is hit
Additional Considerations
- Be aware of overall market trend direction
- Reduce position size during uncertain market conditions
- Keep detailed records of trades taken from indicator setups
Important Trading Considerations
Price Action Variability
It is important to note that market conditions vary and price does not always retrace into the displayed entry zones. In certain market environments, particularly during strong impulsive moves or high-impact news events, price may move directly toward the projected targets without providing an opportunity to enter at the optimal entry levels. Traders should be prepared to either wait for proper entry conditions or adjust their strategy accordingly based on their risk tolerance and trading plan.
Disclaimer
Educational Purpose Only
This indicator is provided solely for educational and informational purposes. It is designed to assist traders in analyzing market structure and identifying potential trading opportunities based on technical analysis principles. The indicator does not constitute financial advice, investment advice, trading advice, or any other type of professional advice.
No Guarantee of Results
Past performance of signals and setups identified by this indicator does not guarantee future results. All trading and investing involves substantial risk of loss, and you may lose some or all of your invested capital. No representation is being made that any account will or is likely to achieve profits or losses similar to those shown or discussed.
Personal Responsibility
Users of this indicator are solely responsible for their own trading decisions and any resulting outcomes. You should conduct your own research, analysis, and due diligence before making any trading or investment decisions. Always consult with a qualified financial advisor before making investment decisions if you are uncertain about your financial situation.
Risk Warning
Trading futures, forex, stocks, and cryptocurrencies carries a high level of risk and may not be suitable for all investors. The high degree of leverage can work against you as well as for you. Before deciding to trade, you should carefully consider your investment objectives, level of experience, and risk appetite. Only trade with money you can afford to lose.
No Warranty
This indicator is provided "as is" without warranty of any kind, either expressed or implied. The developer makes no guarantees about the accuracy, reliability, completeness, or timeliness of the information, signals, or projections provided by this indicator.
---
This indicator represents proprietary research into algorithmic price behavior and order flow dynamics. The methodology is protected to preserve the effectiveness of the approach and maintain the integrity of the analysis framework.
ابحث في النصوص البرمجية عن "Candlestick"

Hammer Model [#]Hammer Model - HTF Candle Entry Model
Overview
The Hammer Model is a sophisticated technical indicator that identifies high-probability reversal setups based on Higher Timeframe (HTF) candlestick wick rejection patterns. Unlike traditional hammer pattern indicators that simply flag candle formations, this system provides a complete trading framework with precise entry zones, stop loss placement, and multiple take profit targets calculated using statistical projections.
What Makes This Different
Proprietary Signal Filtering: This indicator uses a proprietary algorithm that analyzes multiple market structure conditions to filter out low-quality hammer patterns. Only the highest-probability setups are displayed, significantly reducing false signals compared to standard pattern recognition tools.
Dynamic Quadrant Mapping: Rather than basic support/resistance levels, the system divides each qualified hammer candle into three distinct zones (Upper Wick, Body, and Lower Wick), with precise .25, .5, and .75 subdivision levels for granular entry and exit planning.
Multi-Standard Deviation Projections: The indicator automatically calculates TP1 and TP2 targets based on the wick's range, along with optional 1-4 standard deviation extension levels for position scaling and profit maximization.
How It Works
Signal Generation @ Candle Close/New Candle Open
The indicator monitors your chart for HTF candles that meet specific criteria:
Bullish Hammer: Lower wick must be significantly larger than the body
Bearish Hammer: Upper wick must be significantly larger than the body
When both wicks qualify, the indicator selects the larger wick as the primary signal, depending on conditions set.
Visual Components
Bullish Setups:
SL: Stop loss level (below lower wick)
ENTRY: Entry zone (candle body range)
.25/.5/.25: Wick quadrant levels for scaling entries
TP1/TP2: First and second take profit targets
1-4STDV: Advanced/Long Range Targets
Bearish Setups:
SL: Stop loss level (above upper wick)
ENTRY: Entry zone (candle body range)
.25/.5/.25: Wick quadrant levels for scaling entries
TP1/TP2: First and second take profit targets
1-4STDV: Advanced/Long Range Targets
HTF Candle Overlay (Optional):
Displays the actual HTF candle that generated the signal
Shows Open, High, Low, and Close lines for context
Trading the Signals
For Bullish Hammers (Long):
Entry is @ HTF Candle Close / New HTF Candle Open (or wait for a .25-.5 wick retrace)
Place stop loss at or 1 tick below the SL level (lower wick low)
Target TP1 (1x wick range above) and TP2 (2x wick range above) and STDV
Use .25/.5/.25 levels to scale into positions or manage partial exits
For Bearish Hammers (Short):
Entry is @ HTF Candle Close / New HTF Candle Open (or wait for a .25-.5 wick retrace)
Place stop loss at or above the SL level (upper wick high)
Target TP1 (1x wick range below) and TP2 (2x wick range below) and STDV
Use .25/.5/.25 levels to scale into positions or manage partial exits
Key Settings
Hammer Model Conditions
Bullish/Bearish: Toggle which direction setups to display
1-2STDV / 3-4STDV: Show extended projection levels
HTF Liquidity Sweep: Filter for setups that swept previous HTF highs/lows (proprietary)
Wick Size: Require larger wick-to-body ratio (1.75x vs 1x)
Time Filters: Isolate setups during specific trading sessions (NY AM/PM, Asia, London)
Hourly Filters: Target setups that form during specific hour segments (useful for lower timeframes)
Display Options
Show Recent Hammer Models: Limit how many setups display on chart (default: 4)
Unlimited: Show all historical setups
Candle Quadrants: Toggle .25, .5, .25 subdivision lines
HTF Candle Overlay: Display the actual HTF candle that generated the signal
Timeframes
1min chart → 15min HTF (scalping)
5min chart → 1H HTF (day trading)
15min chart → 4H HTF (swing trading)
1H chart → Daily HTF (position trading)
The indicator automatically selects appropriate HTF pairs
Why Closed Source
This indicator is closed source to protect proprietary filtering algorithms that determine which hammer patterns qualify as valid signals. These filters analyze specific market structure conditions, liquidity dynamics, and statistical thresholds that have been developed through extensive backtesting, data logging over 1 years time, and represent the core intellectual property of this system. The filtering methodology is what separates this from basic pattern recognition tools and delivers higher-probability setups. To learn how to learn more about this system see Author Notes.
Best Practices
Confluence: Use this indicator alongside trend analysis, key support/resistance levels, or volume profiles
Risk Management: The SL levels provide clear invalidation points - always honor them
Scaling: Use the quadrant levels (.25/.5/.25) to scale into positions rather than entering full size at once
Session Filters: Enable time filters to focus on setups during high-liquidity sessions
Backtesting: Review historical signals on your preferred instruments to understand typical behavior and win rates
Notes
The indicator displays a table in the top-right showing the current chart timeframe and HTF being analyzed
Only charts with sufficient historical data will display all past signals
The "Unlimited" option may cause performance issues on very low timeframes with extensive history
Disclaimer: This indicator is a tool for technical analysis and risk management education and does not guarantee profitable trades. Always practice proper risk management and position sizing. Past performance does not indicate future results

Pivot Reversal Signals - Multi ConfirmationPivot Reversal Signals - Multi-Confirmation System
Overview
A comprehensive reversal detection indicator designed for daytraders that combines six independent technical signals to identify high-probability pivot points. The indicator uses a scoring system to classify signal strength as Weak, Medium, or Strong based on the number of confirmations present.
How It Works
The indicator monitors six key reversal signals simultaneously:
1. RSI Divergence - Detects when price makes new highs/lows but RSI shows weakening momentum
2. MACD Divergence - Identifies divergence between price action and MACD histogram
3. Key Level Touch - Confirms price is at significant support/resistance (previous day high/low, premarket high/low, VWAP, 50 SMA)
4. Reversal Candlestick Patterns - Recognizes bullish/bearish engulfing, hammers, and shooting stars
5. Moving Average Confluence - Validates bounces/rejections at stacked moving averages (9/20/50)
6. Volume Spike - Confirms increased participation (default: 1.5x average volume)
Signal Strength Classification
• Weak (3/6 confirmations) - Small circles for situational awareness only
• Medium (4/6 confirmations) - Regular triangles, viable entry signals
• Strong (5-6/6 confirmations) - Large triangles with background highlight, highest probability setups
Visual Features
• Entry Signals: Green triangles (up) for long entries, red triangles (down) for short entries
• Exit Warnings: Orange X markers when opposing signals appear
• Signal Labels: Show confirmation score (e.g., "5/6") and strength level
• Key Levels Displayed:
o Previous Day High/Low - Solid green/red lines (uses actual daily data)
o Premarket High/Low - Blue/orange circles (4:00 AM - 9:30 AM EST)
o VWAP - Purple line
o Moving Averages - 9 EMA (blue), 20 EMA (orange), 50 SMA (red)
• Background Tinting: Subtle color on strongest reversal zones
Key Level Detection
The indicator uses request.security() to accurately fetch previous day's high/low from daily timeframe data, ensuring precise level placement. Premarket high/low levels are dynamically tracked during premarket sessions (4:00 AM - 9:30 AM EST) and plotted throughout the trading day, providing critical support/resistance zones that often influence price action during regular hours.
Customizable Parameters
• Signal strength thresholds (adjust required confirmations)
• RSI settings (length, overbought/oversold levels)
• MACD parameters (fast/slow/signal lengths)
• Moving average periods
• Volume spike multiplier
• Toggle individual display elements (levels, MAs, labels)
Best Practices
• Use on 5-minute charts for entries, confirm on 15-minute for direction
• Focus on Medium and Strong signals; Weak signals provide context only
• Strong signals (5-6 confirmations) have the highest win rate
• Pay special attention to reversals at premarket high/low - these levels frequently hold
• Previous day high/low often acts as major support/resistance
• Always use proper risk management and stop losses
• Works best in moderately trending markets
Alert Capabilities
Set custom alerts for:
• Strong long/short signals
• All entry signals (medium + strong)
• Exit warnings for open positions
Ideal For
• Daytraders and scalpers (especially SPY, QQQ, and liquid equities)
• Swing traders seeking precise entries
• Traders who prefer confirmation-based systems
• Anyone looking to reduce false signals with multi-factor validation
• Traders who utilize premarket levels in their strategy
Technical Notes
• Uses Pine Script v6
• Premarket hours: 4:00 AM - 9:30 AM EST
• Previous day levels pulled from daily timeframe for accuracy
• Maximum 500 labels to maintain chart performance
• All key levels update dynamically in real-time
________________________________________
Note: This indicator provides signal analysis only and should be used as part of a complete trading strategy. Past performance does not guarantee future results. Always practice proper risk management.

CVD – Visible Range Candles & Line (Cumulative Delta Volume)Disclaimer:
This indicator is provided for informational and educational purposes only. It does not constitute investment advice, trading advice, or a recommendation to buy or sell any financial instrument. The author assumes no liability for any losses, damages, or errors arising from use or misuse of this script. Please test thoroughly and use at your own risk.
________________________________________________________________________________
Purpose
This indicator provides a fast and clear visualization of Cumulative Delta Volume (CVD) for the currently visible chart range in TradingView. It helps traders identify buy/sell volume pressure and market sentiment over any custom timeframe, with full control over reset intervals and chart style.
Key Features
CVD by Visible Bars: Dynamically calculates CVD only for bars currently visible on the chart, so scrolling and zooming always rescale the line and candles to your view.
Style Selection: Choose line or candlestick display. Candles include both standard OHLC and optional Heikin Ashi smoothing.
Automatic Resets: Restart CVD accumulation at the beginning of every day, week, month, or quarter. Choose ‘None’ for ongoing accumulation.
Fully Custom Colors: Line color, candle body, wick, border – all optimized for clarity and customizable via the indicator’s Style tab.
Autoscale Support: Always fits your timeframe. No need to adjust scale manually.
Zero-Level Reference: Includes a horizontal zero line for quick reversal detection.
Input Parameters
Style: "Line" or "Candles" – controls visual type
Heikin Ashi candles: Enable smoothing for candle view
Show Line: Toggle CVD line visibility
Reset CVD: Options: None, Daily, Weekly, Monthly, Quarterly
How To Use
Add the indicator to your TradingView chart.
Select your preferred visual style (Line or Candles).
Choose reset frequency based on your trading timeframe.
Customize colors in the Style tab (line, candle up/down, wick, border).
Scroll or zoom on the chart – the indicator’s range always fits the currently visible bars.
Typical Use Cases
Intraday traders tracking open/close session volume delta
Swing traders identifying quarterly or monthly market accumulations
Visualizing buy/sell pressure divergence at reversal points
Comparing volume sentiment across flexible chart intervals
Formula
Delta calculation: Delta=volume×(sign(close−open))
Accumulation: Resets at user-chosen intervals, CVD plotted for only visible bars
Author
Created by Ronen Cohen

Day-Type Detector — Rejection / FNL / Outside / StopRun (Clean)Day-Type Detector — Rejection / FNL / Outside / Stop-Run (Clean Version)
This indicator identifies four high-impact candlestick day-types commonly used in professional price-action and auction-market trading: Rejection Days, Failed New Low (FNL) Days, Outside Days, and Stop-Run Days. These patterns often precede major directional moves, reversals, and absorption events, making them particularly valuable for swing traders, positional traders, and short-term discretionary traders.
The script is designed to work across all timeframes and is built around volatility-adjusted measurements using Average Daily Range (ADR) for accuracy and consistency.
What This Indicator Detects
1. Rejection Day (Bullish & Bearish)
A Rejection Day is a wide-range bar that rejects a previous extreme.
The indicator identifies rejection based on:
Range > ADR × threshold
Long lower wick (for bullish) or long upper wick (for bearish)
Close located in the strong zone of the day’s range
These conditions highlight areas where aggressive counter-orderflow entered the market.
2. Failed New Low (FNL) / Failed New High
An FNL day traps traders who attempted breakout selling or buying.
The indicator checks for:
A break beyond the previous session’s low or high
Immediate rejection back inside
Midpoint recapture conditions
ADR-normalized range requirements
These days often trigger powerful directional reversals.
3. Outside Day (Bullish & Bearish)
An Outside Day is a statistically significant expansion day that breaks both the previous high and low.
The script validates:
High > previous high and low < previous low
Range > ADR threshold
Close beyond prior session extreme to complete the rejection sequence
Outside Days often represent stop runs, shakeouts, or trend accelerations.
4. Stop-Run Day (Bullish & Bearish)
Stop-Run Days are aggressive volatility expansions and tend to be the largest ranges within short windows.
This detector identifies them using:
Range > ADR × multiplier
Close located near the extreme of the day (top for bullish, bottom for bearish)
Strong body relative to total range
Break above/below previous session extreme
These patterns indicate capitulation or forced liquidation and are often followed by continuation or sharp counter-rotation.
Key Features
✔ Historical Pattern Marking
All qualifying bars are marked on the chart using plotshape() in global scope, ensuring full historical visibility.
✔ Event Logging & Table Display
A table (top-right of the chart) displays the most recent pattern detections, including:
Timestamp
Pattern type
Bar index
This allows users to monitor and study past pattern occurrences without scanning the chart manually.
✔ ADR-Adjusted Detection
Volatility uncertainty is removed by anchoring all thresholds to ADR.
This ensures consistency across:
Different symbols
Different timeframes
Different market regimes
✔ Alerts Included
Alerts are preconfigured for:
Rejection Day Bull / Bear
FNL Bull / Bear
Outside Day Bull / Bear
Stop-Run Bull / Bear
This allows the user to receive real-time notifications when major day-type structures develop.
How to Use
Add the indicator to any timeframe chart.
Enable or disable:
Historical markers
History table
ADR diagnostics
Watch for shape markers or use alerts for real-time signals.
Use the history table to review recent occurrences.
Combine these day-types with:
Market structure levels
High/low volume nodes (LVNs)
Support/resistance zones
Trend context
These day-types are most effective when they occur near meaningful structural levels because they show where strong order-flow entered the market.
Best Practices
Use higher timeframes (1H–1D) for swing entries.
Confirm signals with market structure or volume profile.
Treat these day-types as context, not standalone signals.
Observe follow-through behavior in the next 1–3 bars after detection.
Credits
This script is based on concepts commonly seen in auction-market theory and professional price-action frameworks, such as Rejection Days, Failed New Lows, Outside Days, and Stop-Run behaviors.
All calculations and logic have been rebuilt from scratch to ensure clean, reliable, and optimized Pine Script v6 execution.

Huli (Reversal) PatternsThis indicator identifies and highlights specific candlestick patterns that commonly appear at potential reversal points in price action. The indicator scans for five distinct pattern types and visually marks them on your chart with customizable colors and optional signal shapes.
Pattern Detection:
Doji - Identifies candles with minimal body size relative to their range
Outside Bars - Detects engulfing patterns where the current bar completely contains the previous bar's range
Pin Bars - Recognizes candles with long wicks and small bodies at potential swing points
212 Pattern - Marks three-bar reversal formations with specific high/low relationships
222 Pattern - Identifies more complex three-bar reversal structures
Key Features:
Individual Pattern Controls - Enable/disable each pattern type independently
Volume Filtering - Optional volume increase requirement for each pattern (can be toggled on/off per pattern type)
Lookback Period - Adjustable lookback bars for each pattern to confirm swing highs/lows (default: 30 bars)
Visual Customization - Choose how patterns are highlighted:
Body only coloring
Body + wick coloring
Body + border coloring
Full candle coloring (body, wick, and border)
Signal Shapes - Optional arrows, triangles, diamonds, or dots to mark pattern occurrences
Custom Candle Colors - Apply custom colors to non-pattern candles for better visual organization
Pattern Priority System - When multiple patterns occur simultaneously, the indicator displays only the highest priority pattern (222 > 212 > Pin > Outside > Doji)
Configuration:
Each pattern type includes its own settings group where you can adjust colors, enable/disable volume requirements, and set lookback periods. The indicator allows for precise tuning to match your analysis preferences without cluttering the chart.
All patterns are evaluated using price structure and optionally volume, providing visual cues where multiple technical factors align. The indicator serves as a pattern recognition tool to assist in identifying areas of interest for further analysis.

GOLD PRICES1. Introduction – The Indicator's Purpose
"This indicator is designed to help traders accurately identify entry and exit points, avoiding random trading decisions. It also aims to reduce uncalculated risk and improve trade quality by providing a clear reading of trends and potential reversal points."
2. Simplified Explanation of the Indicator's Operation
-"The indicator's operation relies on a set of technical elements that contribute to providing an accurate reading of market movement. First, it displays strong areas such as support and resistance levels, as these are points where the price frequently reacts and often experiences clear reversals.
-The indicator also works to determine the overall market trend, whether upward or downward, to help the trader enter with the correct trend and avoid counter-trading.
-In addition, the indicator calculates trading volumes and measures momentum to determine the strength of the current movement and its potential for continuation or weakening. When a set of technical conditions are met, the indicator provides precise entry alerts that help the trader seize suitable opportunities at the right time with the highest possible success rate."
3. Indicator Features
For example:
-Lightweight and fast on the chart.
-Identifies optimal buy/sell zones.
-Supports all timeframes.
-Provides reliable signals without noise.
-Includes clear visual tools for both beginners and professionals.
--------------------------------------------------------------------------
--------------------------------------------------------------------------
--------------------------------------------------------------------------
--------------------------------------------------------------------------
00 - Core (Primary choice: timeframe & implied mode
⭐ A Simple and Clear Explanation of the (D-W-M) Timeframe System
This option allows you to specify the type of drawing levels the indicator uses.
The indicator itself is the same… the same conditions… the same method… but only the range of movement changes according to the timeframe.
⭐ What are timeframes?
Timeframes = the candlestick timeframe.
Daily candle = D
Weekly candle = W
Monthly candle = M
The larger the timeframe, the greater the distance between the levels.
⭐ Explanation of D-W-M
🔹 1. D = Daily
Plots levels based on daily price movement.
The levels are close and small.
Suitable for scalping and short-term trading.
Gives more signals and faster price movement.
🔹 2. W = Weekly
Plots levels derived from a full week's price movement.
The levels are farther away and stronger than the daily level.
Suitable for medium-term trading (3–7 days). Fewer signals but higher accuracy.
🔹 3. M = Monthly
Based on a full month's movement.
Depicts significant and distant levels.
Suitable for long-term swing trading and in-depth analysis.
Signs are few but very strong.
⭐ Main Idea (Summary)
-The indicator is the same, -The rules are the same, -The calculation mechanism is the same…
But the difference between D/W/M is:
✔ Movement range
✔ Level strength
✔ Distance between entry points
✔ Signal duration
01 - Localization
⭐ What is this system?
This system completely changes the indicator's language.
It means that the words displayed on the chart are translated into the language you choose in the settings.
It's not just translation… It's a multilingual interface within the indicator.
⭐ What are its benefits?
Its benefits include:
✔ Making the indicator suitable for people from all over the world
✔ Displaying your chart in your preferred language
✔ Making the indicator more professional
✔ Making the indicator's wires and alerts speak your language
For example, if you have an Arabic-speaking user, they will see "Buy."
And if you have a foreign-speaking user, they will see "Buy."
Everyone can see it in their own language without you changing anything within the indicator.
⭐ What exactly does it do?
This system controls three main points:
1️⃣ Chart text interface
Types such as:
Buy / Sell
Target
Stop
Information
Translate to your chosen language.
2️⃣ Supports multiple languages
The system allows you to choose from:
Arabic
English
Turkish
Russian
Chinese
Japanese
Korean
Or Auto (automatically detects TradingView's language)
02 - Display & Colors
⭐ What is the function of this section?
This section is responsible for the Price Levels System using the indicator:
It determines whether to display historical levels or only the current ones.
It gives you complete control over the colors of the zones for each type (A, B, C, D).
In short, this entire section deals with the appearance of the levels on the chart.
⭐ Explanation of each line in a simple and understandable way:
🔵 1. group_levels
This is simply the name of the settings group.
All the settings appear within a section called:
"03 ▸ Price Levels" Organized and grouped in one place.
🔵 2. show_prev_levels
This is the most important option.
Function:
✔ Do you want to show levels for previous periods or not?
In other words:
If you set it ON → it shows current levels + levels from previous days/weeks/months
If you set it OFF → it only shows current period levels (meaning it hides any older lines or zones)
Its purpose:
If you want a clean and uncluttered chart — turn it off.
If you want a deeper analysis and to see the history of the levels — turn it on.
🔵 3. fillColorA
This is the color of the "Main Zone A".
This is usually the most important area of the indicator… and is considered the strongest area.
Your choice should be based on:
Strong support/resistance
Recurring demand/supply zone
🔵 4. fillColorB
This is the color of Zone B.
It is usually:
Localities less strong than A
Or support zones
Or a secondary level within the same period
If you don't specify a different color, the indicator uses the same color as A.
🔵 5. fillColorC
This is the color of Zone C. Typically used for:
Strong reversal zones
Danger zones
Or price divergence zones (Warning Zone)
Often shown in red as a warning.
🔵 6. fillColorD
This is the color of the "D" zone.
Usually used for:
Mild support/resistance zones
Or target levels
Or price slippage zones
Its color is green, indicating a positive zone (buy/support).
⭐ System Summary (Very simple and organized)
✔ Show Previous Levels
Turns the display of previous levels on/off.
✔ Fill Color A
Color of primary and strong zones.
✔ Fill Color B
Color of secondary zones.
✔ Fill Color C
Color of warning zones (often strong resistance/danger).
✔ Fill Color D
Color of support/buy/positive zones.
03 - Price Levels
⭐ What is the Price Levels system?
This system is responsible for plotting price levels within the indicator:
Current levels
Previous levels
Colors of the zones
Strength of each level according to its type (A – B – C – D)
This section is essentially the "visual representation" of the zones plotted by the indicator.
⭐ What does this system include?
🔹 1. Show Previous Levels
This option allows you to:
On: Displays levels from previous periods (previous day, previous week, previous month, etc., depending on the indicator's setting).
Off: Displays only the current period's levels, hiding the previous ones for a clean chart.
This is useful for people who:
Like a clean chart → Turn off
Like in-depth analysis and historical levels → Turn on
🔹 2. Colors of Levels A – B – C – D
The system divides the zones into 4 types:
A – Primary color
Strongest zone
Most important level
Most reliable
B – Supportive color
Secondary zone
Less powerful than A
Often within the same period
C – Warning color
Dangerous level or reversal point
Often red because it's a sensitive zone
D – Support/Buy color
Positive level
Often green
System objective:
Each zone type is distinguished by a different color so the reader can immediately identify the zone's strength from the color.
🔹 3. Use Unified Fill (One color for all zones)
This is a new and important option:
✔ If you enable it → all zones (A–B–C–D) will change to the same color
This means the indicator uses only one color for all zones.
Its benefits:
The chart becomes cleaner
The appearance is unified
For users who don't like too many colors
✔ If you turn it off → each level retains its own color
A color
B color
C color
D color
⭐ What is the purpose of this entire system?
The goal is for the indicator to provide:
✔ Clear and organized levels
✔ Complete control over appearance and display
✔ Professional colors that highlight the strength of each area
✔ The ability to merge all levels with a single color if you prefer a simpler look
✔ An option to show/hide previous levels
04 - Trade Settings (Entries / TP / SL)
✅ Trade Settings Explained — A Simple and Clear Guide
This section controls everything related to entry signals, profit targets, stop-loss levels, and filters within the indicator.
The main idea:
🎯 You define what you want to appear on the chart and what you want to hide… and the indicator operates according to your choices.
1️⃣ Show Buy and Sell Signals
Show Buy Signals
If enabled → Buy signals will appear on the chart (arrow, entry line, sticker).
Show Sell Signals
If enabled → Sell signals will appear.
🔸 If disabled → The indicator operates normally, but without entry signals.
2️⃣ Show Profit Targets (TP) and Stop Loss (SL)
Show TP on Chart
If enabled → The indicator draws the target line and displays the TP along with the level.
Show SL on Chart
If enabled → It draws the stop-loss line.
🔹 This means you can leave the signals without TP/SL if you just want to monitor entry without managing the trade.
3️⃣ Stop Appeared Visual Signal
Show "Stop Appeared" Visual
This is a smart option:
Even if you have disabled SL…
it still displays a small indicator that tells you:
"A stop loss appeared on this candle."
🔸 This is useful if you like to keep your chart clean but want to know exactly when the stop loss appears.
4️⃣ Strong Saturation Filter
Enable Saturation Filter
This is an additional filter to prevent weak signals.
If you enable it:
The indicator will only give a signal if the candle is strong, oversaturated, and has high momentum.
This reduces false signals and makes entry more accurate.
🔥 This option is especially important for those trading on lower timeframes.
05 - Alert Settings
✅ Alert Settings Explained
This section covers everything related to the alerts the indicator sends when an entry signal appears.
Its concept is very simple:
🎯 The indicator only alerts you when an entry signal appears… and you choose the type of alert you want to receive.
✔ Enable Simple Entry Alerts
This option is the main toggle.
If you enable it → the indicator sends an alert whenever a buy or sell signal appears.
If you disable it → the indicator operates normally, but without any alerts.
🔸 This option only controls the alert sending; it does not change the indicator's signals themselves.
2️⃣ Alert Type You Want to Receive
✔ Alert Type
Here you choose the type of signals you want the indicator to alert you to:
Buy only → Buy alerts only
Sell only → Sell alerts only
Both → Buy + Sell alerts (default option)
🔸 If you are scalping or focusing on a specific trend, you can limit the alert to only one type to reduce distractions.
In summary, simply and clearly:
The Alerts section allows you to control:
Turn alerts on/off
Choose the type of signals you want to receive: Buy, Sell, or both
This way, you can customize the indicator to alert you in the way that best suits your trading style.
Now that we've covered the basic settings and details of the indicator, I'll explain clearly and simply how stop-loss orders appear, the best timeframes, the best assets to trade, and the best trading times.
1. What is the best timeframe for trading?
According to the D system, the best fixed timeframe for trading is the 15-minute timeframe.
This timeframe provides clear, fast movement, suitable for the nature of the indicator's levels.
2. How does the stop-loss order appear?
The stop-loss order in this system is not fixed, but dynamic.
If a buy signal appears,
and then a candle closes completely below the level,
without the candle returning to touch the level from above,
then the stop-loss order appears immediately.
This is the exit mechanism for the trade in the indicator.
3. What is the best currency or asset to trade?
Based on the D system and the 15-minute timeframe, the best asset to trade is gold,
especially on ONAE, as it provides clear and consistent movement with the indicator.
4. Is it preferable to trade during news releases? I don't recommend trading during news releases, as the market often experiences slippage, which can lead to unexpected losses.
Therefore, pay close attention to high-impact news releases.
5. Can this indicator be used as support and resistance levels for other currencies, stocks, metals, and cryptocurrencies?
Yes, it can be used normally.
However, you must choose the appropriate settings:
Short-term trading → Use the daily setting (D)
Medium-term trading → Use the weekly setting (W)
Long-term trading → Use the monthly setting (M)
Disclaimer
All information mentioned here is based on personal experience and practical observations and does not constitute financial advice or a call to buy or sell. Trading in the financial markets involves high risk and may result in the loss of capital.
Please ensure you fully understand the risks before making any decisions, and use the indicator at your own risk.
Conclusion
This concludes the explanation.
If I have missed any part or have any questions, please write them in the comments, and I will add and clarify all the information completely and accurately.

CRT / ORB Signals [Yosiet]What is the CRT Pattern?
The Counter-Retracement Pattern is a classic three-candle setup that reveals moments of market structure weakness and potential reversal. It occurs when a strong move is temporarily rejected, signaling a possible continuation.
Several names for the same candlestick pattern: CRT, ORB, Morning Star, Evening Star, and others, but I'm not going to talk about it.
Here’s the anatomy of a Bullish CRT:
Candle 1 (C1: The Signal Candle): A significant momentum candle in a downtrend.
Candle 2 (C2: The Retracement/Sweep Candle): This is the critical candle. It must sweep the low of C1 (liquidity grab / sweep) but then close with its body inside the range of C1 .
Candle 3 (C3: The Confirmation/Entry Candle): A bullish candle that closes above C2's close, confirming the pattern.
Here’s the anatomy of a Bearish CRT:
The bearish pattern is the exact inverse, sweeping the high of Candle 1.
Why This Indicator?
Clarity and Precision. This script is built for accuracy and minimalism.
No Repainting: The logic is calculated on the closed historical bars. The signal is only plotted on the entry candle (Candle 3) after it has closed.
Clean Visuals: Instead of cluttering every candle, it shows you only what you need:
Green Up Arrow: Signals a confirmed Bullish CRT, suggesting a Long entry.
Red Down Arrow: Signals a confirmed Bearish CRT, suggesting a Short entry.
Faint Circles: Subtle white circles mark the high/low of Candle 1 and Candle 2, helping you visually trace the pattern structure without obstruction.

ChanLun Pro|HL标准化与分形 (v6) — 主图ChanLun Pro
There are multiple automatic drawing modes for the candlestick pattern in Chan Theory, including the sub-high/sub-low mode and the high/low mode.

CVD Absorption/Exhaustion IndicatorCVD Absorption/Exhaustion Indicator – Explanation
This indicator identifies trading opportunities by analyzing the relationship between price action and Cumulative Volume Delta (CVD) at key pivot points. It implements a professional trading framework that distinguishes between tradeable continuation signals (Absorption) and potential reversal warnings (Exhaustion).
Part 1: Foundation – CVD Calculation
The indicator starts by calculating Cumulative Volume Delta using the Bull & Bear Balance formula:
Volume Pressure Calculation
Bull Power: Measures buying pressure based on candlestick characteristics
Bear Power: Measures selling pressure using the same methodology
Volume Split: Each bar's volume is proportionally divided between bull and bear pressure
Delta: bullVolume - bearVolume (net buying vs selling per bar)
CVD: Running total (ta.cum(delta)) that shows cumulative market order flow
On the chart: Yellow line = raw CVD. White line = optional SMA (20-period default). Fill color = teal when CVD > MA (bullish flow), red when below (bearish flow).
Part 2: Signal Logic – Pivot Detection
The indicator identifies pivot points on the CVD line (not price) using lookback parameters:
Left Bars (lbL=1): Minimum bars to left to form pivot
Right Bars (lbR=2): Bars to right to confirm pivot (also creates offset)
Range Validation
Pivot signals only trigger if the distance between consecutive pivots is between 5-60 bars (adjustable). This filters out noise and ensures meaningful divergence patterns.
Part 3: Trading Framework
The core innovation is distinguishing two signal types at each pivot:
🟢 BULLISH SIGNALS (at CVD Pivot Lows)
Table
Copy
Signal Type Price Action CVD Action Trading Action Color
Exhaustion Lower Low (LL) Higher Low (HL) AVOID - Reversal warning Transparent Gray
Absorption Higher Low (HL) Lower Low (LL) TRADE - Continuation likely Solid Green
🔴 BEARISH SIGNALS (at CVD Pivot Highs)
Table
Copy
Signal Type Price Action CVD Action Trading Action Color
Exhaustion Higher High (HH) Lower High (LH) AVOID - Reversal warning Transparent Gray
Absorption Lower High (LH) Higher High (HH) TRADE - Continuation likely Solid Red
Part 4: Visualization Mechanism
The indicator uses precision plotting for clarity:
Pivot Lines: Thin vertical lines appear exactly at the pivot bar using offset=-lbR (shifts plot back to correct location)
Conditional Coloring: Lines are transparent (noneColor) unless a valid signal exists
Minimal Labels: Single letters "E" (Exhaustion) or "A" (Absorption) in tiny size to avoid chart clutter
Direction: Labels appear above the line for bullish signals, below for bearish signals
Part 5: How to Read the Chart
Signal Quality Hierarchy
Solid Green/Red lines with "A" = Primary trade signals (Absorption/Continuation)
Transparent Gray lines with "E" = Warning signals (Exhaustion/Reversal) - use for context or exit planning
No lines at pivots = No valid pattern - ignore
Timeframe Usage
Best on: 5-minute to 1-hour charts (as per PDF)
Multi-timeframe: Use the dropdown in settings to analyze higher timeframe signals while trading lower timeframe
Practical Workflow
Wait for solid color "A" signal in the direction of the trend
Confirm with price action (e.g., support/resistance break)
Use "E" signals as profit targets or trend exhaustion warnings
Never trade Exhaustion signals alone – they indicate potential reversals, not entries
Alert System
Four distinct alerts fire on bar close with clear messages:
Exhaustion Bullish: "Price:LL, CVD:HL (Reversal)"
Absorption Bullish: "Price:HL, CVD:LL (Continuation)"
Exhaustion Bearish: "Price:HH, CVD:LH (Reversal)"
Absorption Bearish: "Price:LH, CVD:HH (Continuation)"

CVD Absorption/Exhaustion IndicatorCVD Absorption/Exhaustion Indicator – Explanation
This indicator identifies trading opportunities by analyzing the relationship between price action and Cumulative Volume Delta (CVD) at key pivot points. It implements a professional trading framework that distinguishes between tradeable continuation signals (Absorption) and potential reversal warnings (Exhaustion).
Part 1: Foundation – CVD Calculation
The indicator starts by calculating Cumulative Volume Delta using the Bull & Bear Balance formula:
Volume Pressure Calculation
Bull Power: Measures buying pressure based on candlestick characteristics
Bear Power: Measures selling pressure using the same methodology
Volume Split: Each bar's volume is proportionally divided between bull and bear pressure
Delta: bullVolume - bearVolume (net buying vs selling per bar)
CVD: Running total (ta.cum(delta)) that shows cumulative market order flow
On the chart: Yellow line = raw CVD. White line = optional SMA (20-period default). Fill color = teal when CVD > MA (bullish flow), red when below (bearish flow).
Part 2: Signal Logic – Pivot Detection
The indicator identifies pivot points on the CVD line (not price) using lookback parameters:
Left Bars (lbL=1): Minimum bars to left to form pivot
Right Bars (lbR=2): Bars to right to confirm pivot (also creates offset)
Range Validation
Pivot signals only trigger if the distance between consecutive pivots is between 5-60 bars (adjustable). This filters out noise and ensures meaningful divergence patterns.
Part 3: Trading Framework – PDF Logic
The core innovation is distinguishing two signal types at each pivot:
🟢 BULLISH SIGNALS (at CVD Pivot Lows)
Table
Copy
Signal Type Price Action CVD Action Trading Action Color
Exhaustion Lower Low (LL) Higher Low (HL) AVOID - Reversal warning Transparent Gray
Absorption Higher Low (HL) Lower Low (LL) TRADE - Continuation likely Solid Green
🔴 BEARISH SIGNALS (at CVD Pivot Highs)
Table
Copy
Signal Type Price Action CVD Action Trading Action Color
Exhaustion Higher High (HH) Lower High (LH) AVOID - Reversal warning Transparent Gray
Absorption Lower High (LH) Higher High (HH) TRADE - Continuation likely Solid Red
Part 4: Visualization Mechanism
The indicator uses precision plotting for clarity:
Pivot Lines: Thin vertical lines appear exactly at the pivot bar using offset=-lbR (shifts plot back to correct location)
Conditional Coloring: Lines are transparent (noneColor) unless a valid signal exists
Minimal Labels: Single letters "E" (Exhaustion) or "A" (Absorption) in tiny size to avoid chart clutter
Direction: Labels appear above the line for bullish signals, below for bearish signals
Part 5: How to Read the Chart
Signal Quality Hierarchy
Solid Green/Red lines with "A" = Primary trade signals (Absorption/Continuation)
Transparent Gray lines with "E" = Warning signals (Exhaustion/Reversal) - use for context or exit planning
No lines at pivots = No valid pattern - ignore
Timeframe Usage
Best on: 5-minute to 1-hour charts (as per PDF)
Multi-timeframe: Use the dropdown in settings to analyze higher timeframe signals while trading lower timeframe
Practical Workflow
Wait for solid color "A" signal in the direction of the trend
Confirm with price action (e.g., support/resistance break)
Use "E" signals as profit targets or trend exhaustion warnings
Never trade Exhaustion signals alone – they indicate potential reversals, not entries
Alert System
Four distinct alerts fire on bar close with clear messages:
Exhaustion Bullish: "Price:LL, CVD:HL (Reversal)"
Absorption Bullish: "Price:HL, CVD:LL (Continuation)"
Exhaustion Bearish: "Price:HH, CVD:LH (Reversal)"
Absorption Bearish: "Price:LH, CVD:HH (Continuation)"

The Ultimate Price Action & SMC Toolkit: Delta Zones, MTF IndicaThis is an All-in-One Pine Script indicator that seamlessly combines three advanced trading concepts:
Delta Zones (Wick Pressure): Uses Standard Deviation to identify extreme buying/selling pressure within the candlestick wicks, signaling potential stop hunts or liquidity absorption. These are plotted as critical Buy/Sell Boxes.
Multi-Timeframe (MTF) Indicators: Confirms signals using popular indicators (RSI, CCI, Stochastic) calculated from a separate, user-selected Timeframe or the current chart timeframe. This adds a crucial layer of context and momentum confirmation.
Smart Money Concepts (SMC): Automatically detects and plots Orderblocks (OBs) and Breaker Blocks based on confirmed Market Structure Breaks (MSB). This helps locate high-probability Supply and Demand zones.
Key Features:
Integrated plotting for combined indicator signals.
Flexible MTF selection for all standard oscillators.
Automatic Swing High/Low detection for SMC analysis.
Comprehensive Alert system for Delta Pressure, Orderblocks, and Breaker Zones.
Option 2: Focusing on SMC and Flow (Concise)
Title: "SMC Delta Flow: Advanced Orderblock, Breaker, and Wick Reversal Zones with MTF Filter."
Description:
An essential tool for sophisticated SMC traders. This indicator provides high-precision zones:
Smart Money Blocks: Plots Orderblocks and Breaker Blocks following Market Structure Shifts (MSS). Includes a "Chop Control" feature to invalidate re-used or weak Breakers.
Delta Reversal Zones: Pinpoints candles showing extreme high-deviation wick pressure. Use these zones to confirm reversals and identify precise entry points where liquidity was captured.
MTF Confirmation: Incorporates configurable Multi-Timeframe (MTF) RSI, CCI, and Stochastic indicators to act as a momentum filter or confirmation tool.
Add this indicator to unify your analysis of Liquidity, Market Structure, and Momentum on a single chart!
SMC, SmartMoneyConcepts, Orderblock, BreakerBlock, MTF, MultiTimeframe, Delta, Wick, Liquidity, PriceAction, RSI, Stochastic, CCI

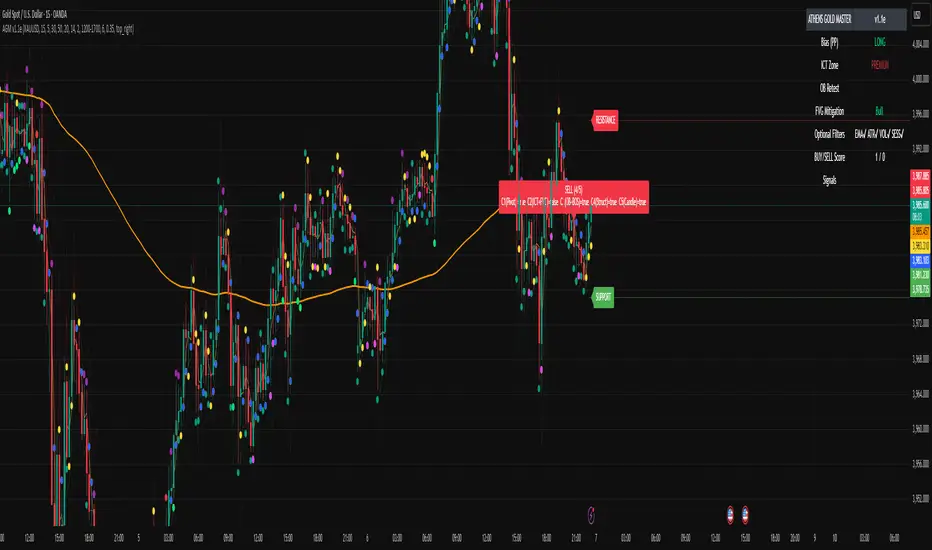
ATHENS GOLD MASTER v1.1e — by ATHENSATHENS GOLD MASTER v1.1e — by ATHENS
Professional Smart-Money-Based Gold Trading System
Built with institutional precision and ICT logic for XAUUSD traders.
⚙️ Core Strategy Components
✅ ICT Premium/Discount Model
✅ Daily Pivot Points & Price Bias
✅ Order Block & Break of Structure Detection
✅ Fair Value Gap (FVG) Mitigation Logic
✅ Dynamic Support & Resistance Recognition
✅ Candlestick + Chart Pattern Confirmation
✅ Multi-Timeframe Structure Alignment
💡 How It Works
The indicator scans real-time GOLD price action and generates Buy / Sell signals only when 3 or more confirmations align across smart money and technical confluence.
Each signal is visually marked on the chart with labels showing:
Confirmation count (1–5)
Key structure notes (Pivot, OB, FVG, etc.)
Support/Resistance zone tags
🧠 Optional Filters for Accuracy (90%+)
EMA-200 Trend Filter
ATR Volatility Filter
Volume Strength Filter
Session-Time Restriction (London–New York Overlap)
🟩 Buy Signal Example
Price above Pivot & in Discount Zone
Bullish Order Block Retest
FVG Mitigation Confirmed
Bullish Engulfing / Pin-Bar Confirmation
🟥 Sell Signal Example
Price below Pivot & in Premium Zone
Bearish Order Block Retest
FVG Mitigation Confirmed
Bearish Engulfing / Pin-Bar Confirmation
📊 Extra Features
Live Bias Table (Panel)
Selective Smart S/R Zones
Auto Session Filter
Alerts for Buy, Sell, and Strong Confluences
Best for: Gold Traders, ICT Students, Smart-Money Concepts Enthusiasts, and Professional Price-Action Analysts.
⚜️ Developed by ATHENS | Sahan Akalanka
📈 “Trade Smart. Think Institutional.”
Freedom Candlestick v5.0.5The is a momentum trading strategy for futures. There are also components of ICT, trend following, volume distribution, and volatility involved in the logic. We are currently using it on NQ and GC. We are also in the process of building a set up to work with ES.

GC-Volume Spike (골드크로스 볼륨스파이크) . V2RSI + Volume + GoldenCross + OBV + Inst + Heart
업데이트 기능추가
7일선에 봉위치에따른 색상추가
상승 하락시그널에따른 색상 다변화
시각화 기반사항 개선 등
Updated features:
Added colors based on candlestick positions to the 7-day moving average.
Diversified colors for rising and falling signals.
Improved visualization.

GANN Friday RulesFriday Rules Indicator Description
Purpose:
The Friday Rules indicator identifies and marks specific Friday candlestick patterns based on
weekly price action and candle body-to-wick relationships.
How it Works:
The indicator tracks the weekly high and low from Monday to Friday, then analyzes Friday's
candle to determine its significance and body/wick characteristics.
Signal Types:
🟢 Green F ▲ - Strong Bullish Friday
- Friday makes the weekly high
- Body closes within 1% of the high (minimal upper wick)
- Indicates strong buying pressure with little rejection
🟡 Yellow F ▲ - Weak Bullish Friday
- Friday makes the weekly high
- Body does NOT close near the high (significant upper wick)
- Shows buying interest but with selling pressure/rejection at highs
🔴 Red F ▼ - Strong Bearish Friday
- Friday makes the weekly low
- Body closes within 1% of the low (minimal lower wick)
- Indicates strong selling pressure with little support
🟠 Orange F ▼ - Weak Bearish Friday
- Friday makes the weekly low
- Body does NOT close near the low (significant lower wick)
- Shows selling pressure but with buying support at lows
⚪ White F - Neutral Friday
- Friday does not make weekly high or low
- Regular Friday with no extreme weekly price action
Key Features:
- Resets weekly tracking every Monday
- All signals positioned above the candle for clean visibility
- Arrow direction indicates bullish (▲) vs bearish (▼) bias
- Color coding shows strength: Green/Red = strong, Yellow/Orange = weak, White = neutral
Usage:
Use this indicator to identify significant Friday price action that may influence next week's
trading, weekend sentiment, and weekly closing patterns.

[LTS] Marubozu Candle StrategyOVERVIEW
The Marubozu Candle Strategy identifies and trades wickless candles (Marubozu patterns) with dynamic take-profit and stop-loss levels based on market volatility. This indicator combines traditional Japanese candlestick pattern recognition with modern volatility-adjusted risk management and includes a comprehensive performance tracking dashboard.
A Marubozu candle is a powerful continuation pattern characterized by the complete absence of wicks on one side, indicating strong directional momentum. This strategy specifically detects:
- Bullish Marubozu: Close > Open AND Low = Open (no lower wick)
- Bearish Marubozu: Close < Open AND High = Open (no upper wick)
When price returns to test these levels, the indicator generates trading signals with predefined risk-reward parameters.
CORE METHODOLOGY
Detection Logic:
The script scans each bar for Marubozu formations using precise price comparisons. When a wickless candle appears, a horizontal line extends from the opening price, marking it as a potential support (bullish) or resistance (bearish) level. These levels remain active until price touches them or until the maximum line limit is reached.
EMA Filter (Optional):
An exponential moving average filter enhances signal quality by requiring proper trend alignment. For bullish signals, price must be above the EMA when touching the level. For bearish signals, price must be below the EMA. This filter reduces counter-trend trades and improves win rates in trending markets. Users can disable this filter for range-bound conditions.
Dynamic Risk Management:
The strategy employs ATR-based (Average True Range) position sizing rather than fixed point values. This approach adapts to market volatility automatically:
- In low volatility: Tighter stops and targets
- In high volatility: Wider stops and targets proportional to market movement
Default settings use a 2:1 reward-to-risk ratio (1x ATR for take-profit, 0.5x ATR for stop-loss), but users can adjust these multipliers to match their trading style.
HOW IT WORKS
Step 1 - Pattern Detection:
On each bar, the indicator evaluates whether the candle qualifies as a Marubozu by comparing the high, low, open, and close prices. When detected, the opening price becomes the key level.
Step 2 - Level Management:
Horizontal lines extend from each Marubozu's opening price. The indicator maintains two separate arrays: one for unbroken levels (actively extending) and one for broken levels (historical reference). Users can configure how many of each type to display, preventing chart clutter while maintaining relevant context.
Step 3 - Signal Generation:
When price returns to touch a Marubozu level, the indicator evaluates the EMA filter condition. If the filter passes (or is disabled), the script draws TP/SL boxes showing the expected profit and loss zones based on current ATR values.
Step 4 - Trade Tracking:
Each valid signal enters the tracking system, which monitors subsequent price action to determine outcomes. The script identifies whether the take-profit or stop-loss was hit first (discarding trades where both trigger on the same candle to avoid ambiguous results).
PERFORMANCE DASHBOARD
The integrated dashboard provides real-time strategy analytics to automatically convert results to dollar values for any instrument:
Tracked Metrics:
- Total Trades: Complete count of closed positions
- Wins/Losses: Individual counts with color coding
- Win Rate: Success percentage with dynamic color (green >= 50%, red < 50%)
- Total P&L: Cumulative profit/loss in dollars
- Avg Win: Mean dollar amount per winning trade
- Avg Loss: Mean dollar amount per losing trade
NOTE: The dollar values shown in the dashboard are for trading only a single share/contract/etc. You will need to manually multiply those numbers by the amount of shares/contracts you are trading to get a true value.
The dollar conversion works automatically across all markets:
- Futures contracts (ES, NQ, CL, etc.) use their contract specifications
- Forex pairs use standard lot calculations
- Stocks and crypto use their respective point values
This eliminates manual calculation and provides immediate performance feedback in meaningful currency terms.
CUSTOMIZATION OPTIONS
ATR Settings:
- ATR Period: Lookback length for volatility calculation (default: 14)
- TP Multiplier: Take-profit distance as multiple of ATR (default: 3.0)
- SL Multiplier: Stop-loss distance as multiple of ATR (default: 1.5)
EMA Settings:
- EMA Length: Period for trend filter calculation (default: 9)
- Use EMA Filter: Toggle trend confirmation requirement (default: enabled)
Visual Settings:
- Bullish Color: Color for long signals and wins (default: green)
- Bearish Color: Color for short signals and losses (default: red)
- EMA Color: Color for trend filter line (default: orange)
- Line Width: Thickness of Marubozu level lines (1-5, default: 2)
- EMA Width: Thickness of EMA line (1-5, default: 2)
Line Management:
- Max Unbroken Lines: Limit for active extending lines (default: 10)
- Max Broken Lines: Limit for historical touched lines (default: 5)
Dashboard Settings:
- Show Dashboard: Toggle performance display on/off
- Dashboard Position: Corner placement (4 options)
- Dashboard Size: Text size selection (Tiny/Small/Normal/Large)
HOW TO USE
1. Add the indicator to your chart
2. Adjust ATR multipliers based on your risk tolerance (higher values = more conservative)
3. Configure the EMA filter based on market conditions (enable for trending, disable for ranging)
4. Set line limits to match your visual preference and chart timeframe
5. Monitor the dashboard to track strategy performance in real-time
6. Use the TP/SL boxes as reference levels for manual trades or automation
Best Practices:
- Enable EMA filter in strongly trending markets
- Disable EMA filter if you want more trade signals but at lower quality
- Increase ATR multipliers in highly volatile markets
- Decrease ATR multipliers for tighter, more frequent trades
- Review avg win/loss ratio to ensure positive expectancy
UNIQUE FEATURES
Unlike basic Marubozu detectors, this strategy provides:
1. Automatic level tracking with memory management
2. Volatility-adjusted risk parameters instead of fixed values
3. Optional trend confirmation via EMA filter
4. Real-time performance analytics with automatic dollar conversion
5. Separate tracking of wins/losses with individual averages
6. Configurable visual display to prevent chart clutter
7. Complete transparency with all logic visible in open-source code

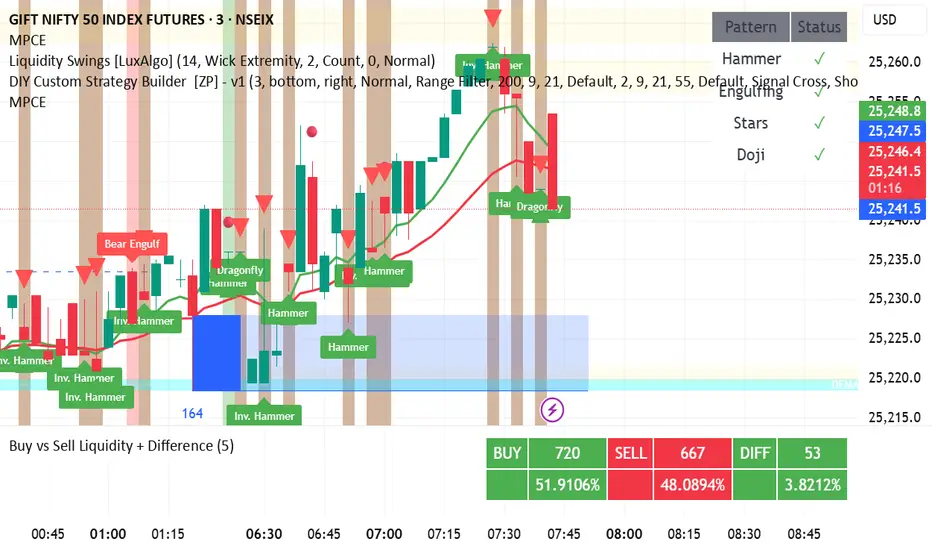
Swing Points LiquiditySwing Points Liquidity
Unlock advanced swing detection and liquidity zone marking for smarter trading decisions.
Overview:
Swing Points Liquidity automatically identifies key swing highs and swing lows using a five-candle “palm” structure, marking each significant price turn with precise labels: “BSL swing high” for potential bearish liquidity and “SSL swing low” for potential bullish liquidity. This transparent swing logic provides a robust way to highlight areas where price is most likely to react—making it an invaluable tool for traders applying Smart Money Concepts, supply and demand, or liquidity-based strategies.
How It Works:
The indicator scans every candle on your chart to detect and label swing highs and lows.
A swing high (“BSL swing high”) is identified when a central candle’s high is greater than the highs of the previous two and next two candles.
A swing low (“SSL swing low”) is identified when a central candle’s low is lower than the lows of the previous two and next two candles.
Labels are plotted for every detected swing point, providing clear visualization of important market liquidity levels on any symbol and timeframe.
How to Use:
Liquidity levels marked by the indicator are potential price reversal zones. To optimize your entries, combine these levels with confirmation signals such as reversal candlestick patterns, order blocks, or fair value gaps (FVGs).
When you see a “BSL swing high” or “SSL swing low” label, observe the price action at that area—if a reliable reversal pattern or order block/FVG forms, it can signal a high-probability trade opportunity.
These marked liquidity swings are also excellent for locating confluence zones, setting stop losses, and identifying where institutional activity or smart money may trigger significant moves. Always use market structure and price action in conjunction with these levels for greater consistency and confidence in your trading.
Features:
Customizable label display for swing highs (BSL) and swing lows (SSL)
Automatic detection using robust 5-candle palm logic
Works with all symbols and chart timeframes
Lightweight, clear visual style—easy for manual and algorithmic traders
Notes:
The indicator requires at least two candles both before and after each swing point, so labels will start appearing after enough historical data is loaded.
For deeper historical analysis, simply scroll left or zoom out on your chart to load more candles—the indicator will automatically process and display swing points on all available data.

QT Insights [Pro +]: PSP + TPD Alerts | [cephxs]This indicator's primary function is to highlight chart candlestick divergence with candle closes.
*A full list of the Supported Correlated Asset Pairings (CAPs) will be linked at the bottom.
There are two primary operating modes
PSP Only
All precision candles
There is a tooltip describing what each operating mode does in the indicator settings
Asset Selection
The indicator handles asset selection for divergences automatically for a large variety of asset(s) classes automatically and is ready for use Out of the Box with Major Assets like:
CME_MINI:NQ1! , CME_MINI:ES1! , CBOT_MINI:YM1!
It also works with non-futures for indices (CFD), for best functionality with no stress, we only have support for the following brokers. CAPITALCOM, VANTAGE, OANDA
It works with Forex, Crypto and Energies, also works with Metals.
The default pairings are determined by the active chart
i.e CME_MINI:NQ1! will pair with Asset 2 as CME_MINI:ES1! and Asset 3 as CBOT_MINI:YM1!
Alerts
This version has alerts, I will create a tutorial for that. You can use the alerts by adding alerts and selecting the indicator from the "Contdition" Dropdown in the Alert Creation Pop-up
Customizations
The indicator is fully customizable in the Styles tab under the settings
Play around with it and determine what works best with your aesthetic, it comes out of the box with a lot of clutter and as you can see in the showcase image, it's clean and functional, just how I like it.
*Supported CAPs
CFD
Forex:
EURUSD / GBPUSD (FOREXCOM Only)
Indices:
NAS100 / SPX500 / US 30 (CAPITALCOM / Vantage / Oanda Only)
Metals:
XAUUSD / XAGUSD
Futures
Indices:
NQ / MNQ , ES / MES , YM / MYM
Metals:
GC / MGC , SI / SIL
Crypto
BTCUSD / ETHUSD, this will work for any asset with "BTC" or "ETH" in the asset name
Note: There is support for Micro contracts automatically
Subsequent Updates Will be posted, Stay tuned.
Note: I wrote this description on the fly so there might be flaws, Regardless, made with ❤️ by cephxs

HammerThis indicator automatically detects powerful candlestick formations such as Hammer, Inverted Hammer, Bullish Engulfing, Hanging Man, Shooting Star, and Bearish Engulfing.
It visually marks potential reversal zones on the chart and provides instant Long / Short alerts.
By combining pattern recognition with swing levels, it helps you identify possible trend reversals more clearly.
A simple, fast, and price-action-focused tool for smarter trading decisions.
💡 Yellow dotted lines indicate possible reaction zones around swing points.
DAMMU CANDEL TYPE🧩 Overview
Detects multiple bullish and bearish candlestick patterns.
Plots visual buy/sell signals and labels on chart.
Sends alerts when patterns appear.
Shows table of enabled/disabled patterns.
✅ Main Features
Bullish patterns: Hammer, Inverted Hammer, Bullish Engulfing, Morning Star, Piercing, Dragonfly Doji.
Bearish patterns: Hanging Man, Shooting Star, Bearish Engulfing, Evening Star, Dark Cloud, Gravestone Doji.
Visuals: Green/red arrows and labels.
Alerts: Optional alerts for bullish/bearish signals.
Table: Shows active pattern status.
⚙️ Improvements Suggested
Move table.new outside if block to prevent recreation every bar.
Adjust label position to avoid overlap.
Add “signal strength” (count multiple patterns same bar).
Add MA confirmation for better accuracy.
Upgrade to Pine Script v6 for better performance.
GRG/RGR Signal, MA, Ranges and PivotsThis indicator is a combination of several indicators.
It is a combination of two of my indicators which I solely use for trading
1. EMA 10-20-50-200, Pivots and Previous Day/Week/Month range
2. 3/4-Bar GRG / RGR Pattern (Conditional 4th Candle)
You can use them individually if you already have some of them or just use this one. Belive me when I say, this is all you need, along with market structure knowlege and even if you don’t have that, this indicator has been doing wonders for me. This is all I use. I do not use anything else.
**Note - Do checkout the indicators individually as I have added valuable information in the comment section.
It contains the following,
1. 10 EMA/SMA - configurable
2. 20 EMA/SMA - configurable
3. 50 EMA/SMA - configurable
4. 200 EMA/SMA - configurable
5. Previous Day's Range - configurable
6. Previous Week's Range - configurable
7. Previous Month's Range - configurable
8. Pivots - configurable
9. Buy Sell Signal - configurable
The Moving Averages
It is a very important combination and using it correctly with price action will strengthen your entries and exits.
The ema's or sma's added are the most powerful ones and they do definitely act as support and resistance.
The Daily/Weekly/Monthly Ranges
The Daily/Weekly/Monthly ranges are extremely important for any trader and should be used for targets and reversals.
Pivots
Pivots can provide support and resistance level. R5 and S5 can be used to check for over stretched conditions. You can customise them however you like. It is a full pivot indicator.
It is defaulted to show R5 and S5 only to reduce noise in the chart but it can be customised.
The 3/4 RGR or GRG Signal Generator
Combined with a 3/4 RGR or GRG setup can be all a trader needs.
You don't need complex strategies and SMC concepts to trade. Simple EMAs, ranges and RGR/GRG setup is the most winning combination.
This indicator can be used to identify the Green-Red-Green or Red-Green-Red pattern.
It is a price action indicator where a price action which identifies the defeat of buyers and sellers.
If the buyers comprehensively defeat the sellers then the price moves up and if the sellers defeat the buyers then the price moves down.
In my trading experience this is what defines the price movement.
It is a 3 or 4 candle pattern, beyond that i.e, 5 or more candles could mean a very sideways market and unnecessary signal generation.
How does it work?
Upside/Green signal
1. Say candle 1 is Green, which means buyers stepped in, then candle 2 is Red or a Doji, that means sellers brought the price down. Then if candle 3 is forming to be Green and breaks the closing of the 1st candle and opening of the 2nd candle, then a green arrow will appear and that is the place where you want to take your trade.
2. Here the buyers defeated the sellers.
3. Sometimes candle 3 falls short but candle 4 breaks candle 1's closing and candle 2's opening price. We can enter on candle 4.
4. Important - We need to enter the trade as soon as the price moves above the candle 1 and 2's body and should not wait for the 3rd or 4th candle to close. Ignore wicks.
5. But for a more optimised entry I have added an option to use candle’s highs and lows instead of open and close. This reduces lot of noise and provides us with more precise entry. This setting is turned on by default.
6. I have restricted it to 4 candles and that is all that is needed. More than that is a longer sideways market.
7. I call it the +-+ or GRG pattern or Green-Red-Green or Buyer-Seller-Buyer or Seller defeated or just Buyer pattern.
8. Stop loss can be candle 2's mid for safe traders (that includes me) or candle 2's body low for risky traders.
9. Back testing suggests that body low will be useless and result in more points in loss because for the bigger move this point will not be touched, so why not get out faster.
Downside/Red signal
1. Say candle 1 is Red, which means sellers stepped in, then candle 2 is Green or a Doji, that means buyers took the price up. Then if candle 3 is forming to be Red and breaks the closing of the 1st candle and opening of the 2nd candle then a Red arrow will appear and that is the place where you want to take your trade.
2. Sometimes candle 3 falls short but candle 4 breaks candle 1's closing and candle 2's opening price. We can enter on candle 4.
3. We need to enter the trade as soon as the price moves below the candle 1 and 2's body and should not wait for the 3rd or 4th candle to close.
4. But for a more optimised entry I have added an option to use candle’s highs and lows instead of open and close. This reduces lot of noise and provides us with more precise entry. This setting is turned on by default.
5. I have restricted it to 4 candles and that is all that is needed. More than that is a longer sideways market.
6. I call it the -+- or RGR pattern or Red-Green-Red or Seller-Buyer-Seller or Buyer defeated or just Seller pattern.
7. Stop loss can be candle 2's mid for safe traders ( that includes me) or candle 2's body high for risky traders.
8. Back testing suggests that body high will be useless and result in more points in loss because for the bigger move this point will not be touched, so why not get out faster.
Combining Indicators and Signal
Combining these indicators with GRG/RGR signal can be very powerful and can provide big moves.
1. MA crossover and Signal - This is very powerful and provides a very big move. Trades can be held for longer. If after taking the trade we notice that the MA crossover has happened then trades can be held for higher targets.
2. Pivots and Signal - Pivots and add a support or resistance point. Take profits on these points. R5/S5 are over streched conditions so we can start looking for reversal signals and ignore other signals
3. Intraday Range - first 1, 5, 15 min of the day - Sideways days is when price will stay in these ranges. You can take profits at these ranges or if the range is broken and we get a signal, then it can mean that the direction will be sustained.
4. Previous Day/Week/Month Ranges - These can be used as Take Profit points if the price is moving towards them after getting the signal. If the range is broken and we get a signal then it can be a strong signal. They can also be used as reversal points if a strong signal is generated.
Important Settings
1. Include 4th Candle Confirmation - You can enable or disable the 4th candle signal to avoid the noise, but at times I have noticed that the 4th candle gives a very strong signal or I can say that the strong signal falls on the 4th candle. This is mostly a coincidence.
2. Bars to check (default 10) - You can also configure how many previous bars should the signal be generated for. 10 to 30 is good enough. To backtest increase it to 2000 or 5000 for example.
3. Use Candle High/Low for confirmation instead of Candle Open/Close - More optimized entry and noise reduction. This option is now defaulted to false.
4. Show Green-Red-Green (bull) signals - Show only bull entries. Useful when I have a predefined view i.e, I know market is going to go up today.
5. Show Red-Green-Red (bear) signals - Show only bear entries. Useful when I have a predefined view i.e, I know market is going to go down today.
6. 3rd candle should be a Strong candle before considering 4th candle - This will enforce additional logic in 4 candle setup that the 3rd candle is the candle in our direction of breakout. This means something like GRGG is mandatory, which is still the default behaviour. If disabled, the 3rd candle can be any candle and 4th candle will act as our breakout candle. This behaviour has led to breakouts and breakdowns as times, hence I added this as a separate feature. Vice-versa for a RGGR.
For a 4 candle setup till now we were expecting GRGG or RGRR but we can let the system ignore the 3rd candle completely if needed.
This will result in additional signals.
7. Three intraday ranges added for index and stock traders - 1 min, 5 min and 15 min ranges will be displayed. These are disabled by default except 15 min. These are very important ranges and in sideways days the price will usually move within the 15 min. A breakout of this range and a positive signal can be a very powerful setup.
Safe traders can avoid taking a trade in this range as it can lead to fakeouts.
The line style, width, color and opacity are configurable.
Pointers/Golden Rules
1. If after taking the trade, the next candle moves in your direction and closes strong bullish or bearish, then move SL to break even and after that you can trail it.
2. If a upside trade hits SL and immediately a down side trade signal is generated on the next candle then take it. Vice versa is true.
3. Trades need to be taken on previous 2 candle's body high or low combined and not the wicks.
4. The most losses a trader takes is on a sideways day and because in our strategy the stop loss is so small that even on a sideways day we'll get out with a little profit or worst break even.
5. Hold trades for longer targets and don't panic.
6. If last 3-4 days have been sideways then there is a good probability that today will be trending so we can hold our trade for longer targets. Inverse is true when the market has been trending for 2-3 days then volatility followed by sideways is coming (DOW theory). Target to hold the trade for whole day and not exit till the day closes.
7. In general avoid trading in the middle of the day for index and stocks. Divide the day into 3 parts and avoid the middle.
8. Use Support/Resistance, 10, 20, 50, 200 EMA/SMA, Gaps, Whole/Round numbers(very imp) for identifying targets.
9. Trail your SL.
10. For indexes I would use 5 min and 15 min timeframe and at times 10 mins.
11. For commodities and crypto we can use higher timeframe as well. Look for signals during volatile time durations and avoid trading the whole day. Signal usually gives good targets on those times.
12. If a GRG or RGR pattern appears on a daily timeframe then this is our time to go big.
13. Minimum Risk to Reward should be 1:2 and for longer targets can be 1:4 to 1:10.
14. Trade with small lot size. Money management will happen automatically.
15. With small lot size and correct Risk-Reward we can be very profitable. Don't trade with big lot size.
16. Stay in the market for longer and collect points not money.
17. Very imp - Watch market and learn to generate a market view.
18. Very imp - Only 3 type of candles are needed in trading -
Strong Bullish (Big Green candle), Strong Bearish (Big Red candle),
Hammer (it is Strong Bullish), Inverse Hammer (it is Strong Bearish)
and Doji (indecision or confusion).
If on daily timeframe I see Strong Bullish candle previous day then I am biased to the upside the next day, if I see Strong Bearish candle the previous day then I am biased to the downside the next day, if I see Doji on the previous day then I am cautious the next day, if there are back to back Dojis forming in daily or weekly then I am preparing for big move so time to go big once I get the signal.
19. Most Important Candlestick pattern - Bullish and Bearish Engulfing
20. The only Chart patterns I need -
a) Falling Wedge/Channel Bullish Pattern Uptrend or Bull Flag - Buying - Forming over a couple days for intraday and forming over a couple of weeks for swing
b) Falling Wedge/Channel Bullish Pattern Downtrend or Falling Channel - Buying
c) Rising Wedge Bearish Pattern Uptrend or Rising Channel - Selling
d) Rising Wedge Bearish Pattern Downtrend or Bear flag - Selling
e) Head and Shoulder - Over a longer period not for intraday. In 15 min takes few days and for swing 1hr or 4h or daily can take few days
f) M and W pattern - Reversal Patterns - They form within the above 4 patterns, usually resulting in the break of trend line
21. How Gaps work -
a) Small Gap up in Uptrend - Market can fill the gap and reverse. The perception is that people are buying. If previous day candle was Strong Bullish then market view is up.
b) Big Gap up in Uptrend - Not news driven - Profit booking will come but may not fill the entire gap
c) Big Gap up in Uptrend - News driven, war related, tax, interest rate - Market can keep going up without stopping.
c) Flat opening in Uptrend - Big chance of market going up. If previous day candle was Strong Bullish then view is upwards, if it was Doji then still upwards.
d) Gap down in Uptrend - Market is surprised. After going down initially it can go up
e) Small Gap down in Downtrend - Market can fill the gap and keep moving down. If previous day candle was Strong Bearish then view is still down.
f) Flat opening in Downtrend - View is down, short today.
g) Big Gap down in Downtrend - Profit booking and foolish buying will come but market view is still down.
h) Gap down with News - Volatility, sideways then down.
i) Gap Up in Downtrend - Can move up - Price can move up during 2/3rd of the day and End of the day revert and close in red.
22. Go big on bearish days for option traders. Puts are better bought and Calls are better sold.
23. Cluster of green signals can lead to bigger move on the upside and vice versa for red signals.
24. Most of this is what I learned from successful traders (from the top 2%) only the indicator is mine.

Tristan's Three Line Strike PatternThree Line Strike Indicator (5-Minute Timeframe)
This indicator highlights Three Line Strike candlestick patterns on a 5-minute chart . The Three Line Strike is a rare four-candle formation that often signals trend continuation rather than reversal.
Bullish Three Line Strike (green “3LS long” above the candle):
Three strong bullish candles in a row are followed by a large bearish candle that completely engulfs the prior three. Despite looking bearish, this setup often indicates strength in the uptrend.
Bearish Three Line Strike (red “3LS sell” below the candle):
Three consecutive bearish candles are followed by a large bullish engulfing candle. Although it looks like a reversal, the downtrend commonly resumes.
How to use on the 5-min chart:
Watch for the labels marking the pattern.
A bullish signal suggests that the upward move is likely to continue after the engulfing candle.
A bearish signal suggests that the downtrend is likely to continue after the engulfing candle.
These signals are not entry/exit triggers on their own—I suggest you combine them with trend confirmation (e.g., moving averages, momentum indicators, or volume analysis) before acting.
Use good risk management, and don't buy / sell based on these indicators alone.
