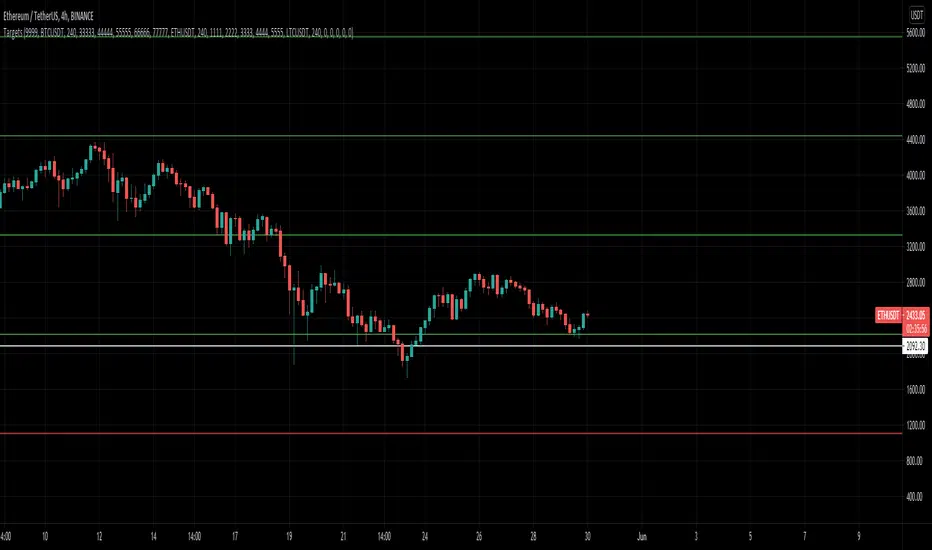
MultiAlert LITEAllows one to set 5 price level alerts on one symbol (1 Stop Loss 4 Targets)
Alerts work by prices crosses under the stop loss or over the targets, enabling short reverses this.
Unlike regular MultiAlert, this actually draws a true horizontal price at your price.
This is a lighter version of MultiAlert, supporting only one symbol. Your price levels will appear on all charts unless you hide the indicator.
Make the alert with targets and stop loss set, every time you make a change you MUST REMAKE THE ALERT.
Please comment any problems .
ابحث في النصوص البرمجية عن "alert"

MultiAlert, MultiTargets + TickersThis is my first script, completely made from scratch. Bear with me.
Script that allows one to set an alert for Multiple Price Levels, on Multiple Tickers, complete with Dynamic Messages showing you which ticker, at which price, at which alert (Stop loss, Target 1 etc.), set to Once Per Bar.
Select Ticker, type in price levels that you have for targets & stop loss, move on to the next, or don't and leave 0 and blank.
Disable the targets you do not need in STYLE tab to disable plotting & scaling, leave unused tickers & targets blank & 0.
Create Alert, select this indicator, anyfunction() alert.
MAKE SURE to remake the alert every time you change something, they are not smart enough to change as you change things. Can Confirm by using the numbers in the alert name. You will also have to set the profit level or stop loss to zero every time it triggers to avoid triggered again.
In fact, you do not need the indicator active at all. Add it to a chart and hide it by clicking on the little eyeball icon, to make an alert open the settings for the indicator and type in your targets like normal. Indicator will remain invisable.
I have not found a way to dynamic message the alert name, or else I would.
DISCLAIMER: NONE OF THIS IS FINANCIAL ADVICE. You are completely responsible for whatever happens to you. Do not use the targets in this chart. Do your own research before trading.
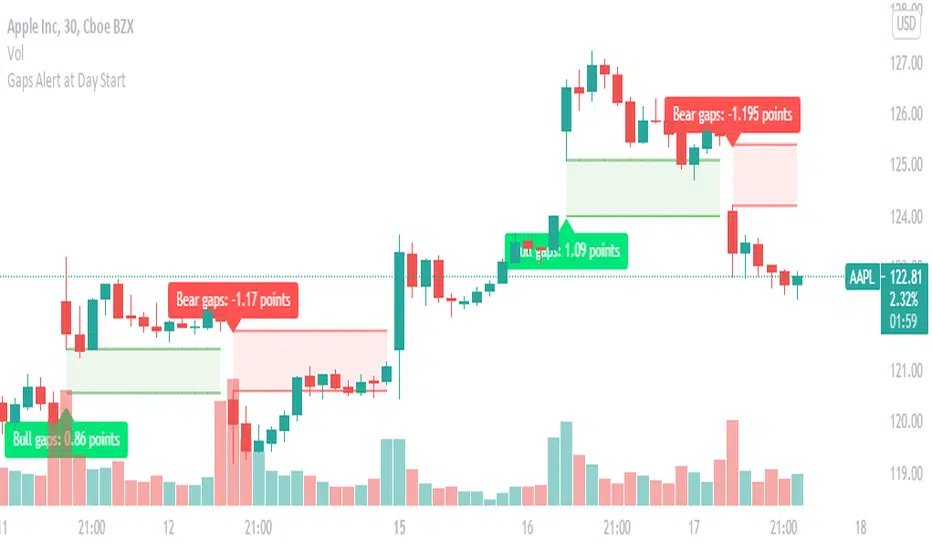
Gaps : set Alert to get Alert at Day StartGaps are areas on a chart where the price of a stock (or another financial instrument) moves sharply up or down,
with little or no trading in between. As a result, the asset's chart shows a gap in the normal price pattern.
The trader can interpret and exploit these gaps for profit.
What do i look for in these gaps, Will these gaps will fill or not fill?
When someone says a gap has been filled, that means the price has moved back to the original pre-gap level.
how you can benefit with this indicator?
this indicator instantly picks up the gap at the start of the day and also helps in identifying weather it is a bullish gap or a bearish gap
in this you can easily set up alerts, you will be instantly alerted if any gap occurs.
What does the visual on chart indicates ?
Green color gaps are bullish gaps or gap up ,label indicates the type of gap and the width of the gap
Red color gaps are bearish gaps or gap down ,label indicates the type of gap and the width of the gap
once you set alert you will Receive alert in the below format
Price (current price) 'Bear gap width: ' (gap Width in points)
Price (current price) 'Bull gap width: ' (gap Width in points)
This will work on all time frame equal to or less than "D".
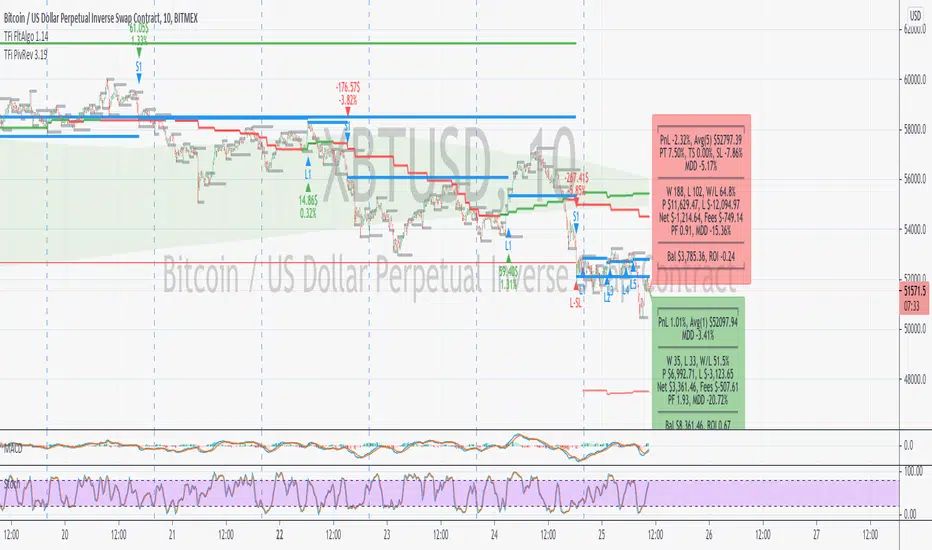
TFi Pivot Reversal V3The Pivot Reversal Study uses pivot points to create a support and resistance level; based on this levels the script creates virtual stop-market orders to catch the trend if the price is crossing the pivot lines.
A "Pyramiding" input allows to configure up to 3 entries; the script enters an additional position if the price falls by a configurable percentage amount (long), the reverse to short orders.
A configurable profit-target and stop-loss is being used to exit an open position.
An optional Moving Average filter can be used to enable only long or short positions.
The script renders a status box at the last bar, which shows the current position status and result of the built-in trading simulation results.
It shows the following statistic values:
current position PnL - also background turns green if position is in profit and red if in loss
the percentage distance to the profit-target and stop-loss level
the overall number of wins and losses and the win/loss ratio
the overall profit and loss amount (assuming a quantity of 1)
the net-profit and profit-ratio
For the correct simulation of entry/exit prices, the script contains inputs for a percentage entry and exit slippage.
The study also creates configurable alerts, which follow the exact position of the entry/exit markers. The default alert messages contain trading instruction to execute orders via Alertatron; but the message content can be replaced if configuring the alert in the Tradingview environment.
The script was mainly backtested with crypto-coins, e.g. XBTUSD at 15min timeframe. But the script also works with any other type of security and timeframe.
How to access
This strategy is a "Invite Only" script. You can can subscribe or purchase the strategy; please use the link below or send me a message via Tradingview to obtain access to the strategy and study script.
For enabling the script in your Tradingview chart window, click on "Indicators" and select "Invite-Only Scripts".
Full list of alerts
'Alertatron Exit' ... Exit all open positions.
'Alertatron Enter Long' ... Enter long position, w/o stop-loss being used.
'Alertatron Enter Short' ... Enter short position, w/o stop-loss being used.
'Alertatron Enter Long SL' ... Enter long position, w/ stop-loss being used.
'Alertatron Enter Short SL' ... Enter short position, w/ stop-loss being used.
Full list of parameters
"Pivot Left Bars" ... Number of bars on the left of the pivot point - used for pivot /peak detection.
"Pivot Right Bars" ... Number of bars on the right of the pivot point - used for pivot /peak detection.
"MA Filter Fast" ... Moving Average filter fast period.
"MA Filter Slow" ... Moving Average filter slow period.
"Profit Target Option" ... Configure the profit-target either as a fix percentage value or an ATR.
"Profit Target " ... Fix percentage profit-target.
"Profit ATR Period" ... ATR profit-target period.
"Profit ATR Factor" ... ATR profit-target factor/multiplier.
"Stop Loss Option" ... Configure the stop-loss either as a fix percentage value or disable the stop-loss completely.
"Stop Loss " ... Fix percentage stop-loss.
"Rebuy Loss " ... Percentage loss of the initial position before script enter a nw position in the same direction.
"Pyramiding" ... Maximum number of positions.
"Show MA Plots" ... Show/hide Moving average plots.
"Slippage Entry " ... Percentage slippage for entering a position.
"Slippage Exit " ... Percentage slippage for exiting a position.
"Statistic Label" ... Defines the position of the statistic label relatively to the last bar in the chart.
"Backtest Start" ... Backtest start time; area outside this timeframe will be grayed out.
"Backtest Stop" ... Backtest stop time; area outside this timeframe will be grayed out.
"Backtest Mode" ... Closes the currently opened position if chart switches to last bar; please only enable if backtesting, otherwise it leads to unwanted alerts.
TBT Stop Loss Hunting AlertPurpose:
The TBT Stop Loss Hunting Alert is a simple early warning system that indicates when Bitcoin could have unexpected volatility (in either direction) within a 24 to 48 hour time frame as you can see above (indicated by the red bar/column in the indicator lane). By knowing when there could be possible upcoming volatility for the price of Bitcoin, traders can take preventative measures to protect open positions to preserve profits.
Time Frame:
While you can view this indicator on any time frame, it was originally created with the 6-hour time frame in mind. Because of this, the indicator can be set to "same as symbol" (the indicator will adapt to any time frame you use) or "6 hours" (the original and intended time frame). Please understand that the alert will show "noise" (false positive signals) on faster (lower) time frames. This is another reason to keep the indicator on the 6-hour time frame in its settings.
Metrics:
The TBT Stop Loss Hunting Alert looks at sudden/unexpected changes in price action, volatility, and volume.
Realistic Expectations:
While this indicator is effective in alerting users when there could be sudden volatility for Bitcoin, note that there is no way to know which way Bitcoin will move after the alert is triggered. The frequency of alerts is few and far between, but in a way this is a good thing. When the signal is triggered, it is a great early warning system to remember to be careful for the next 24 to 48 hours.

Dual Colored Least Squares Moving Average + Crossover AlertsDual Least Squares Moving Averages
Flexible Options (On/Off):
- Color change based on slope
- Background color change based on the slope of the slow moving average (LSMA 2).
- Crossover Arrows
- Crossover Alerts
How to Use on Your Own Chart & How to Set Alerts:
1. Click Add to Favorites
2. Add indicator to your chart, Click add Indicators > Favorites > Click on Dual LSMA
3. Click Add Alert, Select the condition Dual LSMA, then choose Long LSMA or Short LSMA
4. Click Create Alert
Let me know if it's useful for you! Also, if you have any new ideas and strategies based on this indicator, let me know. I love to hear (and learn) from all of the brilliant minds out there!

MACD+ Alerts [SystemAlpha]This is the alert companion of the MACD+ Strategy . Instead of using just the normal crossovers, we use trend filters, trailing stop loss and take profit targets. This strategy was developed for crypto, forex and stocks on daily timeframe but feel free to experiment on 15 minutes or higher using heikin ashi or normal candles.
In this alert you have a choice of:
Trend Filters:
- Average Directional Index ( ADX ) – buy when price is trend is up and sell when trend is down.
- Moving Average (MA) – buy when price close above the defined moving average and sell when price close below moving average
- Parabolic SAR – buy when SAR is above price is above price and sell when SAR is below price.
- All - Use ADX , MA and SAR as filters
For MA Filter , you can use the “TF MA Type” and "TF MA Period" parameter to select Simple or Exponential Moving Average and length.
Stop Loss:
- Average True Range (ATR) – ATR % stop as trailing stop loss.
- Parabolic SAR ( SAR ) – Parabolic SAR adapted as trailing stop loss.
For ATR , you can use the “ATR Trailing Stop Multiplier” parameter to set an initial offset for trailing stop loss.
Take Profit Target:
- Average True Range (ATR) – ATR % stop as trailing stop loss.
- Standard % – Percent as target profit
For ATR , you can use the “ATR Take Profit Multiplier” parameter to set an initial offset for trailing stop loss.
Additional feature include:
- Regular and Hidden Divergence display and alerts
Alerts:
When creating alerts use “Once Per Bar Close” parameter for Long and Short and “Once Per Bar” for Close, Trailing Stop, Take Profit and Divergence.
TradingView Links:
Strategy:
MACD:
How to use:
1. Apply the script by browsing through Indicators --> Invite-Only scripts and select the indicator
2. Once loaded, click the gear (settings) button to select/adjust the parameters based on your preference.
3. Wait for the next BUY or SELL signal to enter the trade!
Disclaimer:
The indicator and signals generated do not constitute investment advice; are provided solely for informational purposes and therefore is not an offer to buy or sell a security; are not warranted to be correct, complete or accurate; and are subject to change without notice.

BO - CCI Arrow with AlertBO - CCI Arrow with Alert base on CCI indicator to get signal for trade Binary Option.
Rules of BO - CCI Arrow with Alert below:
A. Setup Menu
1. cciLength:
* Default CCI lenght = 14
2. Linear Regression Length:
* Periods to calculate Linear Regression of CCI,
* Default value = 5
3. Extreme Level:
* Default top extreme level = 100
* Default bottom extreme level = -100
4. Filter Length:
* Periods to define highest or lowest Linear Regression
* Default value = 6
B. Rule Of Alert Bar
1. Put Alert Bar
* Current Linear Regression Line created temporrary peak
* Peak of Linear Regression Line greater than Top Extreme Level (100)
* Previous Linear Regression is highest of Filter Length (6)
* Previous Linear Regression is greater than previous peak of Linear Regression Line
* Current price greater than previous low
* CCI(14) less than Linear Regression Line
2. Call Alert Bar
* Current Linear Regression Line created temporrary bottom
* Bottom of Linear Regression Line less than Bottom Extreme Level (-100)
* Previous Linear Regression is lowest of Filter Length (6)
* Previous Linear Regression is less than previous bottom of Linear Regression Line
* Current price less than previous lhigh
* CCI(14) greater than Linear Regression Line
B. Rule Of Entry Bar and Epiry.
1. Put Entry with expiry 3 bars:
* After Put Alert Bar close with signal confirmed, put Arrow appear, and after 3 bars, result label will appear to show win trade, loss trade or draw trade
2. Call Entry with expiry 3 bars:
* After Call Alert Bar close with signal confirmed, call Arrow appear, and after 3 bars, result label will appear to show win trade, loss trade or draw trade.
3. While 1 trade is opening no more any signal
C. Popup Alert/Mobile Alert
1. Signal alert: Put Alert or Call Alert will send to mobile or show popup on chart
2. Put Alert: only Put Alert will send to mobile or show popup on chart
3. Call Alert: only Call Alert will send to mobile or show popup on chart

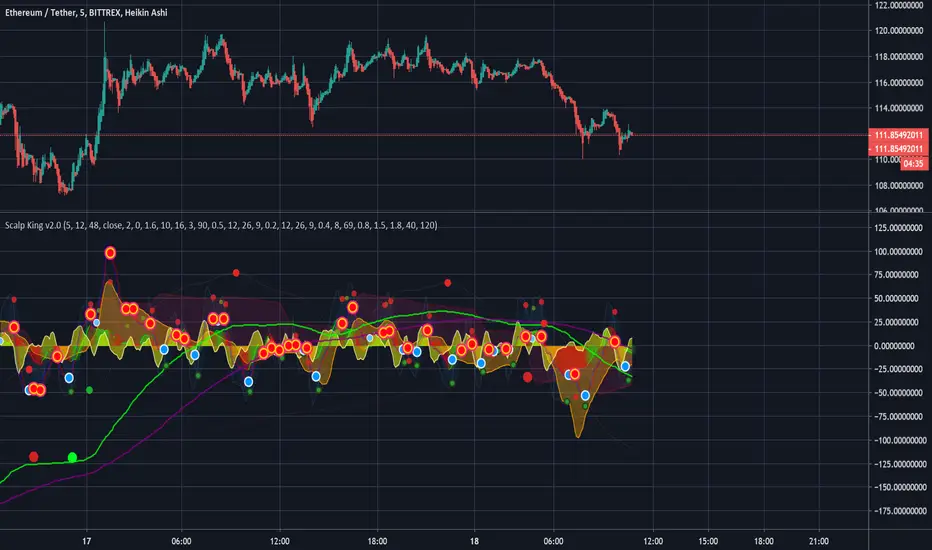
Scalp King v2.0 - Multi-time VWAP, multi-condition alertsMulti time-range VWAP with Multiple condition alerts - version 2.0 - by Viral Killer
This is a script that contains 3 VWAP modes, 5 min, 60 min and 240 min timeframes, all on the same indicator. You add it to the 5 min chart, but seems to work on other ranges.
Usually, when the VWAP wave crosses above, it is a buy signal, although not perfect. This ensures there is also a MAC-D buy confirmation, for a much stronger buy signal.
You can setup SUPER alerts which ensure multiple time ranges line up, before alerting. Some are already built in.
Yellow Wave is 5 min VWAP , crossing from below into positive is a buy signal. Note the word signal, not guaranteed buy.
Orange Wave is 60 min VWAP , crossing from below into positive is a buy signal.
Purple Wave is 240 min VWAP , crossing from below into positive is a buy signal.
The blue wave is 5 the minutes RSI and the other lines are 1h/4h, corresponding to oversold and overbought signals.
U will see a trail of red and blue arrows on the MAC-D, this script knows when the MAC-D is losing power.
Green dots are a buy, dark dots are a sell. Green with orange rim is a weak buy.
If you see 2 or 3 green dots from different time frames very close together, that is a much stronger buy signal. If the MAC-D also agrees, well, it is very strong. This is shown as blue circle white arrow up.
Exit when you see a red cross or red arrow down, RSI overbought and MAC-D crossing down respectively.
You can use multi condition alerts, i.e. alert me to a STRONG BUY when 5 min VWAP crossed above while the 60 min is positive too, aaaand the MAC-D agrees.
Enjoy.
-Viral Killer
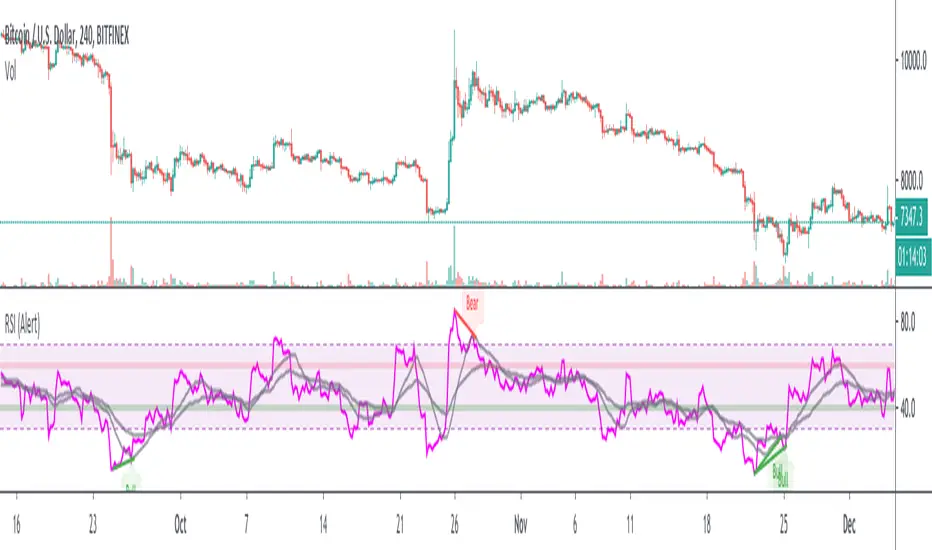
RSI w/ MAs & Divergences (Alert)This script fires off real-time RSI Divergence alerts.
To best use the RSI Divergence indicators, adjust the following settings accordingly.
• RSI Bullish Divergence Under: 20 – 45 (lower for larger volatility and more bearish markets)
• RSI Bearish Divergence Above: 55 – 80 (higher for larger volatility and more bullish markets)
Key Notes:
1. Set "Once Per Bar" instead of "Once Per Bar Close" alert.
The strategy already uses prior bar close (instead of current bar close) for calculation. This ensures that the signals will stay as they are after fired off, even when the current bar price is still changing.
2. It's OKAY to see the "alert may trigger differently than expected" warning.
Reason why you are seeing this warning is because we used a function called valuewhen() in our strategy. This function does not look at the entire history of data and has several limitations. For instance, on a 30min resolution, at the end of 2018, the function will be able to find past occurrences of BTC exceeding 16k. However, the function won't be able to find such occurrences at the end of 2019. Since our strategy is only concerned with very recent events, these limitations will not impact our results or cause repainting. You can find out more about this in the TradingView Wiki .
Cyatophilum Ultimate Trading Bot [ALERTSETUP]Private Indicator.
This is an indicator for trading low timeframes . It is generic and configurable meaning you can use it not only on crypto, but also forex, CFD, stocks etc.
HOW IT WORKS
The user chooses between three powerful base strategies: Bollinger Bands + Stoch RSI, RSI Divergences or the SARMA Strategy .
He can also trade support and resistance breakouts , with or without the base strategy.
Use the Alert Setup version to trigger entry and exit alerts .
You can choose between a set of trend lines that will filter trades that are against the main trend in order to increase profitability.
The integrated Trailing Stop Loss will trigger an alert to exit the trade.
You can use the Trailing Take Profit with a configurable % deviation. It will also trigger an exit alert.
SAMPLE USE CASES
XBTUSD 5m BitMEX
XBTUSD 15m BitMEX
ETHUSD 5m BitMEX
ETHUSD 15m BitMEX
USD/WTI 1m IDC (Us Dollar/ WTI Crude OIL)
Backtest below for BITMEX:LTCZ19 in 15m timeframe.
Note: This is the Alert version. You can find the backtest version in my profile.
To get access to the indicator, use the link below, thanks for reading!

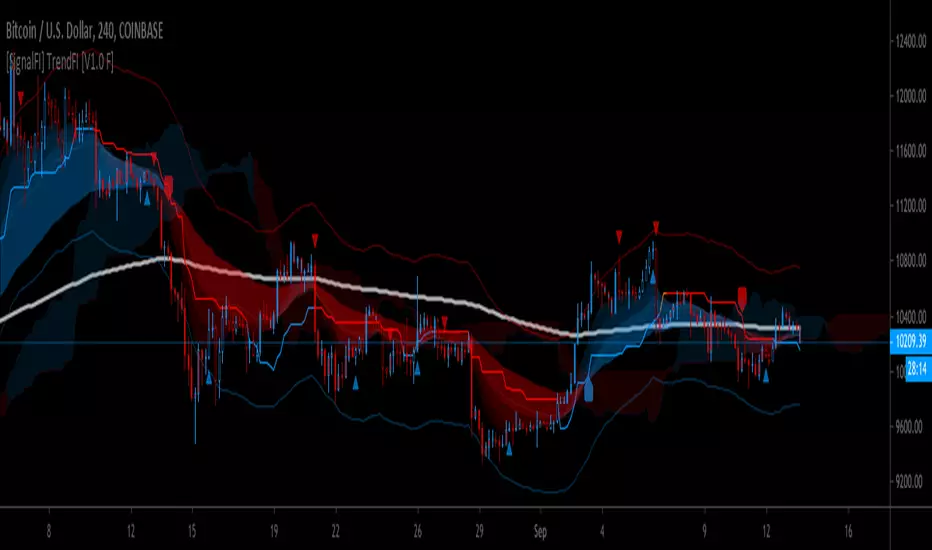
[SignalFI] TrendFI [V1.0 F] [BETA]TrendFI is trending tool used to spot entry exit signals using a wide range of dynamics which include:
- Ichi based EMA with (w/Deviation Bands)
- Fibonacci based EMA spreads
- MACD
- Ichi based Cloud (Future Support and Resistance)
Alerts:
3-Stage alerting system for buy/sell.
BETA as of 8/7/2019. More info and descriptions to come.
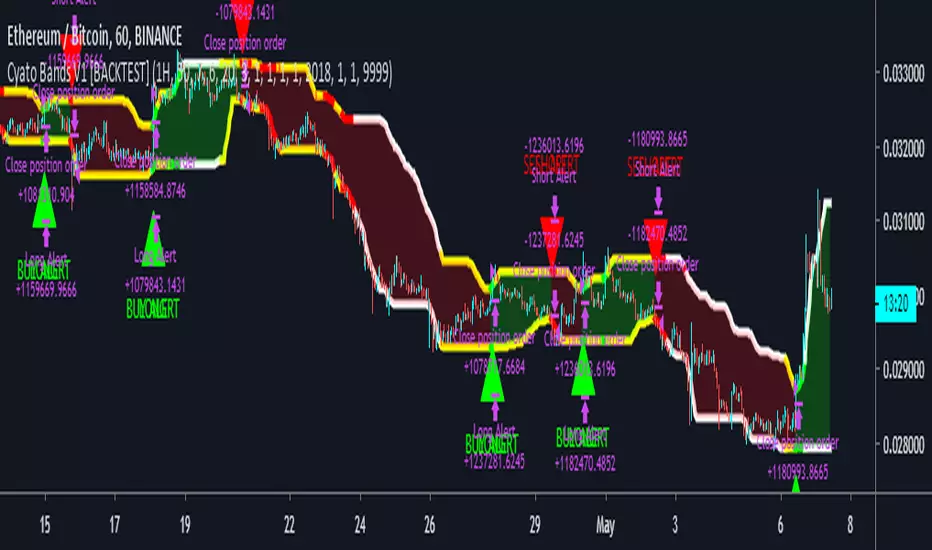
Cyatophilum Bands Pro Trader [ALERTSETUP]A Multi Timeframe Indicator for trading cryptocurrency and other assets
Presentation Page
HOW IT WORKS
The indicator mainly consists of what I call "Cyatophilum Bands", who can be used as either Trend lines or Support/Resistance. The color indicates the current Trend. Buy and Sell signals trigger upon Trend Reversal Breakouts.
These alerts can be used with automated trading systems. They correspond to the big green and red triangles.
For daytraders, there is an option to activate Long and Short signals during a Trend. It can also be used as re-entry points if you missed a major breakout. They correspond to the small triangles.
If you trade BTCUSD, I created an option that will allow you to configure your script on any timeframe from 5M to 1D in one click.
If you do not trade BTCUSD, you can use a custom setup (See the Presentation Page )
This indicators also works on other assets such as Oil Futures or other cryptocurrency pairs such as ETH/BTC.
The script comes with two versions:
The alert Setup is used creating automated alerts
The Backtest Version that will help you see the results on past data. You can choose to enable or disable shorts results.
HOW TO USE
Once I granted you access, you will receive a notification. Add both indicators to the chart. Use the Backtest version to find the best configuration (BTCUSD is already pre-configured. I post configurations on my Discord Server, and you can ask me for help). Then apply this configuration to the Alert Setup script. Finally, create the alerts.
Before you ask, the script does not repaint. I made sure to not use the security function which I know is bugged right now.
Get the indicator today !
Purchase on my website
NOTE
If you purchase the Indicator you will get access to my past indicators as well!

Cyatophilum Bands Pro Trader [BACKTEST]A Multi Timeframe Indicator for trading cryptocurrency and other assets
Presentation Page
HOW IT WORKS
The indicator mainly consists of what I call "Cyatophilum Bands", who can be used as either Trend lines or Support/Resistance. The color indicates the current Trend. Buy and Sell signals trigger upon Trend Reversal Breakouts.
These alerts can be used with automated trading systems. They correspond to the big green and red triangles.
For daytraders, there is an option to activate Long and Short signals during a Trend. It can also be used as re-entry points if you missed a major breakout. They correspond to the small triangles.
If you trade BTCUSD, I created an option that will allow you to configure your script on any timeframe from 5M to 1D in one click.
If you do not trade BTCUSD, you can use a custom setup (See the Presentation Page )
This indicators also works on other assets such as Oil Futures or other cryptocurrency pairs such as ETH/BTC.
The script comes with two versions:
The alert Setup is used creating automated alerts
The Backtest Version that will help you see the results on past data. You can choose to enable or disable shorts results.
HOW TO USE
Once I granted you access, you will receive a notification. Add both indicators to the chart. Use the Backtest version to find the best configuration (BTCUSD is already pre-configured. I post configurations on my Discord Server, and you can ask me for help). Then apply this configuration to the Alert Setup script. Finally, create the alerts.
Before you ask, the script does not repaint. I made sure to not use the security function which I know is bugged right now.
Get the indicator today !
Purchase on my website
NOTE
If you purchase the Indicator you will get access to my past indicators as well!
inwCoin Stoch+BB AlertSimple alert to go along with the inwCoin Stoch+BB Strategy
Please not that the alerts are persistent, if you already enter the position,
just ignore the rest of the same alert until the opposite alert show up
( long then short / or short then long , if change, just close and enter opposite position )
You can set the alert and let it tell you to iOS app via TradingView app ( yey! )
Please note that, if you don't have bot to track your trailing start/stop. you have to enter the TP/SL manually ( also tracking the position )
So... be careful to follow this alert. just try it with small amount of money first.
and make sure to set stop loss every time because OKEX is a portfolio killer if you don't have any stop loss.

Heiken Ashi 10/20MA w/ AlertsHeiken Ashi 10/20MA script with alerts.
General premise:
- Is the 10MA above the 20MA and a bullish candle? If yes, open a long.
- Will close the trade at the first bearish candle.
- Reverse it for going short.
Quite a conservative strategy, not for day trading.
Alerts:
- Long
- Short
- Close
Will need to be able to short altcoins to make the most of it, but will at least keep you out of sustained downtrends.
Backtest it on bitcoin and other large cap alts on high time frames. For lazy trading, can set up alerts with AutoView.
Check out my other scripts.

MG - Moving Average Offset AlertThe purpose of this indicator is to allow the user to get alerted when price gets within a certain threshold of an interesting moving average (which has a customizable length, type and source).
It can be used for a timely notification that the price is in an important area or used for alerts to trigger trades slightly above the moving average to provide a higher probability of getting an entry at a key level
Basic Example:
- A bullish impulse wave occurs
- You plan to join in the next wave as it bounces of the 50 SMA
- You would ideally like to do other things with your life than watch the screen all day but you would like some time beforehand to perfect your trade setup
- You therefore, could set an alert to let you know when price has dropped within 2% of the 50 SMA which would provide ample notice for a comfortable trade.
More interesting example - (Using autoview):
- A bullish impulse wave occurs late in the evening
- You would like to join in for the second wave but you are human and have to sleep
- You could identify sensible profit and stop loss targets beforehand
- You could then, in preparation:
- Set an alert at profit level to close any long positions
- Set an alert at stop level to close any long positions
- NOTE: If the alert is never reached, that is not a problem. You are simply closing a position (not applying the opposition action i.e. short)
- Once your targets are set up, you could add whatever offset you desire (if any), to your custom moving average and set a buy alert on that moving average.
- If the price bounces off the moving average, you have the whole trade set up and automatically put in to action whilst you're asleep!

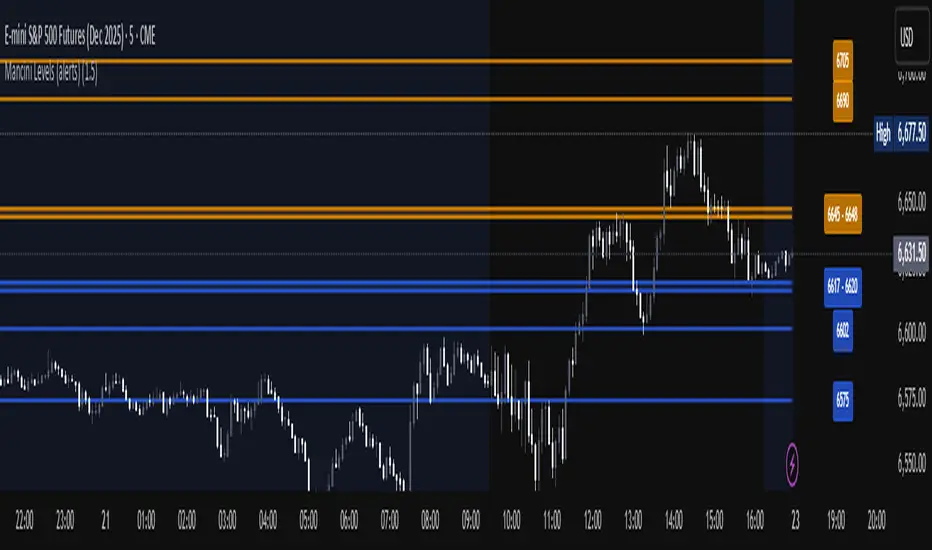
Mancini Levels (with alerts, majors only option)This indicator displays Support and Resistance levels on ES or MES (E-mini and Micro E-mini S&P 500 Index Futures) charts by parsing text copied and pasted by the user.
(The levels displayed on the chart above are not valid, they are for illustration only)
Features
Option to display only the major levels
The chart on the left displays both major and minor levels, distinguished by color and line style. The chart on the right shows only the major levels; minor levels are disabled:
Alert function for when the price approaches a major level or zone (within a customizable distance).
The script provides a trigger for alerts. When creating an alert, you can then choose your desired frequency (Only once/Once per bar/Once per bar close/Once per minute) from the TradingView alert pop-up.
The alert message contains the current price and the approached major level price.
Customizable Lookback Period
Set how many days into the past the lines should appear (Subject to a maximum of 5000 bars).
To display lines for the current day only, set this value to 1.
Functions only on ES or MES (E-mini and Micro E-mini S&P 500 Index Futures) charts, as the text format is intended for these instruments.
How to Use
Copy and paste the support and resistance levels into the indicator's "Supports" and "Resistances" input fields.
Format Example:
For the "Supports" input: 6772-6770 (major), 6764 (major), 6757, 6751-54
For the "Resistances" input: 6799 (major), 6814, 6828-30, 6839-40 (major)
The indicator supports the display of zone levels in multiple formats
(e.g., 6235-45 and 6235-6245 and 6245-6235 are all valid).
For hundred- or thousand-point rollovers, please use only the full number format: 5995-6005.
The indicator includes an error-checking system to help you troubleshoot common setup issues.
An on-chart error label will be displayed on the chart if:
The chart instrument is not ES or MES.
The "Supports" and "Resistances" fields are both empty.
A data formatting error is detected (e.g., non-numeric characters, incomplete zones, etc.).
How It Works
For optimal resource efficiency and performance, the script executes all computationally intensive tasks only once, on the very first bar when the chart loads (if barstate.isfirst).
One-time Parsing: The parsing, splitting, and conversion of the text (string) formatted levels, which are provided in the settings, occurs only once.
Persistent Objects: The lines (line.new), fills (linefill.new), and price labels (label.new) that mark the levels are all persistent graphical objects. The script creates these on the first bar and stores their references in arrays declared with the var keyword.
No Redrawing: On subsequent bars, the indicator does not delete and redraw these objects. It merely updates the x-axis position of the existing lines and labels (line.set_x1, line.set_x2, label.set_x) on the last bar (if barstate.islast), ensuring they always remain on the right edge of the chart, following the formation of new bars.
By default, TradingView charts have a limit of 50 lines and 50 labels. Given that the number of levels often exceeds this, the script's drawing logic is as follows:
The number of displayable lines and labels has been increased (to 500) in the indicator's declaration line.
The script applies a prioritized order when drawing levels and labels. Major levels have priority over minor levels during drawing.
Disclaimer
This indicator is provided for educational and informational purposes only. It is not financial advice.
Trading involves substantial risk of loss and is not suitable for every investor. Past performance shown in examples is not indicative of future results.
The indicator provides signals and calculations, but trading decisions are solely your responsibility. Always:
Test strategies on paper before using real money
Never risk more than you can afford to lose
Understand that all trading involves risk
Consider seeking advice from a licensed financial advisor
The publisher makes no guarantees regarding accuracy, profitability, or performance. Use at your own risk.
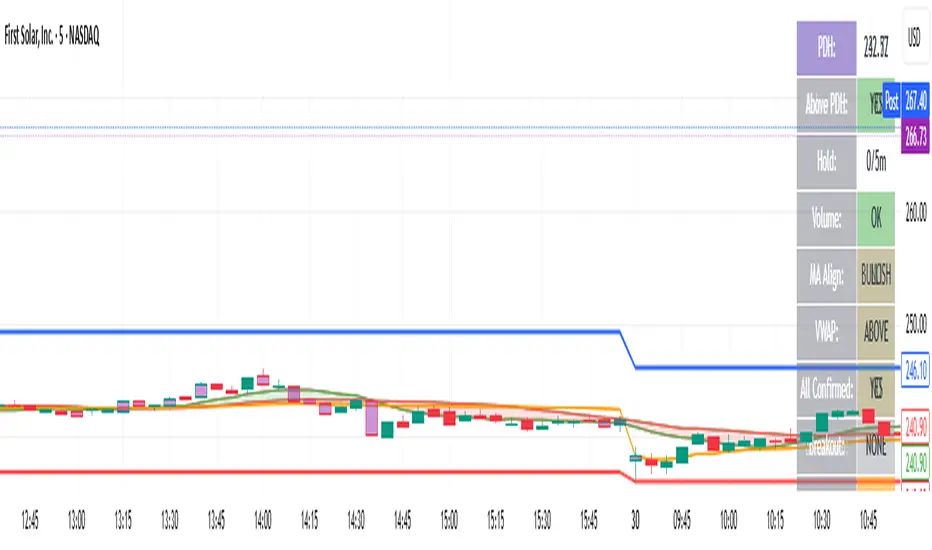
bearish Price Below PDL - Complete Multi-Confirmation Alert🎯 KEY IMPROVEMENTS:
1. Enhanced Alert Visibility:$jmoskyhigh
✅ HUGE triangle down marker with "SELL" text
✅ Alert title: "SELL SIGNAL - PDL BREAKDOWN CONFIRMED"
✅ Prominent info panel with red theme
✅ Clear "SELL ALERT: TRIGGERED" status
2. Better Visual Feedback:
Red frame around info panel
Larger shapes and markers
Color-coded confirmations (green = OK, red = FAIL)
Progress percentage displayed
Breakdown price label
3. Complete Alert System:
Main Alert: "SELL SIGNAL - PDL BREAKDOWN CONFIRMED"
Early Warning: "PDL Breakdown Started - Monitoring"
Reset Alert: "Confirmation Lost - Breakdown Reset"
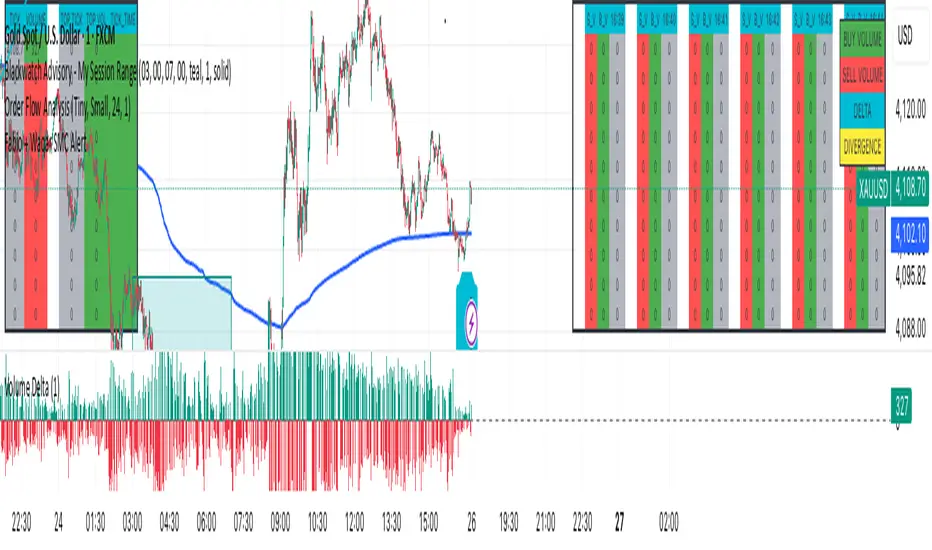
F & W SMC Alerthis script is a custom TradingView indicator designed to combine elements of a trend‑following VWAP approach (inspired by the “Fabio” strategy) with a smart‑money‑concepts framework (inspired by Waqar Asim). Here’s what it does:
* **Directional bias:** It calculates a 15‑minute VWAP and compares the current 15‑minute close to it. When price is above the 15‑minute VWAP, the script assumes a long bias; when below, a short bias. This reflects the trend‑following aspect of the Fabio strategy.
* **Liquidity sweeps:** Using recent pivot highs and lows on the current timeframe, it identifies when price takes out a recent high (for potential longs) or low (for potential shorts). This represents a “liquidity sweep” — a fake breakout that collects stops and signals a possible reversal or continuation.
* **Break of structure (BOS):** After a sweep, the script confirms that price is breaking away from the swept level (i.e., higher than recent highs for longs or lower than recent lows for shorts). This BOS confirmation helps avoid false signals.
* **Entry filters:** For a long setup, the bias must be long, there must be a liquidity sweep followed by a BOS, and price must reclaim the current‑timeframe VWAP. For a short setup, the opposite conditions apply (short bias, sweep + BOS to the downside, and price rejecting the VWAP).
* **Alerts and plot:** It provides two alert conditions (“Fabio‑Waqar Long Setup” and “Fabio‑Waqar Short Setup”) that you can attach to notifications. It also plots the intraday VWAP on your chart for visual reference.
In short, this script watches for a confluence of trend direction, liquidity sweeps, structural shifts, and VWAP reclaim/rejection, and then notifies you when those conditions align. You can use it as an alerting tool to identify high‑probability setups based on these combined strategies.

Fabio + Waqar SMC AlertThis script is a custom TradingView indicator designed to combine elements of a trend‑following VWAP approach (inspired by the “Fabio” strategy) with a smart‑money‑concepts framework (inspired by Waqar Asim). Here’s what it does:
* **Directional bias:** It calculates a 15‑minute VWAP and compares the current 15‑minute close to it. When price is above the 15‑minute VWAP, the script assumes a long bias; when below, a short bias. This reflects the trend‑following aspect of the Fabio strategy.
* **Liquidity sweeps:** Using recent pivot highs and lows on the current timeframe, it identifies when price takes out a recent high (for potential longs) or low (for potential shorts). This represents a “liquidity sweep” — a fake breakout that collects stops and signals a possible reversal or continuation.
* **Break of structure (BOS):** After a sweep, the script confirms that price is breaking away from the swept level (i.e., higher than recent highs for longs or lower than recent lows for shorts). This BOS confirmation helps avoid false signals.
* **Entry filters:** For a long setup, the bias must be long, there must be a liquidity sweep followed by a BOS, and price must reclaim the current‑timeframe VWAP. For a short setup, the opposite conditions apply (short bias, sweep + BOS to the downside, and price rejecting the VWAP).
* **Alerts and plot:** It provides two alert conditions (“Fabio‑Waqar Long Setup” and “Fabio‑Waqar Short Setup”) that you can attach to notifications. It also plots the intraday VWAP on your chart for visual reference.
In short, this script watches for a confluence of trend direction, liquidity sweeps, structural shifts, and VWAP reclaim/rejection, and then notifies you when those conditions align. You can use it as an alerting tool to identify high‑probability setups based on these combined strategies.
Wyckoff Stage Approximator (MTF Alerts)Wyckoff Stage Approximator (MTF Context)
This indicator is a powerful tool designed for traders who use a top-down, multi-timeframe approach based on Wyckoff principles. Its primary function is to identify the market's current stage—consolidation (Stage 1) or trend (Stage 2)—on a higher Context (C) timeframe and project that analysis onto your lower Validation (V) and Entry (E) charts.
This ensures you are always trading in alignment with the "big picture" trend, preventing you from taking low-probability trades based on lower-timeframe noise.
Core Concept: Top-Down Analysis
The script solves a common problem for multi-timeframe traders: losing sight of the primary trend. By locking the background color to your chosen Context timeframe (e.g., 15-minute), you are constantly reminded of the market's true state.
🟡 Yellow Background (Stage 1): The Context timeframe is in consolidation. This is a time to be patient and wait for a clear directional bias to emerge.
🟢 Green Background (Stage 2 - Markup): The Context timeframe is in a confirmed uptrend. This is your green light to look for bullish pullback opportunities on your lower timeframes.
🔴 Red Background (Stage 2 - Markdown): The Context timeframe is in a confirmed downtrend. This is your signal to look for bearish rally opportunities.
How It Works
The indicator uses a combination of moving averages and trend strength to objectively define each stage:
Trend Alignment: It checks if the 5 EMA, 10 EMA, and 20 EMA are properly stacked above or below the 50 SMA to determine the potential trend direction.
Trend Strength: It uses the ADX to measure the strength of the trend. A trend is only confirmed as Stage 2 if the ADX is above a user-defined threshold (default is 23), filtering out weak or choppy moves.
Stage Definition: Any period that is not a confirmed, strong Stage 2 Markup or Markdown is classified as a Stage 1 consolidation phase.
Key Features
Multi-Timeframe (MTF) Projection: Select your master "Context" timeframe, and its analysis will be displayed on any chart you view.
Customizable Inputs: Easily adjust the moving average lengths and ADX threshold to fit your specific strategy and the asset you are trading.
Clear Visual Cues: The intuitive background coloring makes it easy to assess the market environment at a glance.
Stage Transition Alerts: Set up specific alerts to be notified the moment your Context timeframe shifts from a Stage 1 consolidation to a Stage 2 trend, ensuring you never miss a potential setup.
How to Use This Indicator
Add the indicator to your chart.
In the settings, set the "Context Timeframe" to your highest timeframe (e.g., "15" for 15-minute).
Create alerts for the "Stage 1 -> Stage 2" conditions.
When you receive an alert, it signals that a potential trend is beginning on your Context chart.
Switch to your lower Validation and Entry timeframes. The background color will confirm the higher-timeframe trend, giving you the confidence to look for your specific entry patterns.
Disclaimer: This tool is designed for confluence and environmental analysis. It is not a standalone signal generator. It should be used in conjunction with your own price action, volume, or order flow analysis to validate trade entries.
Vol-Pace Projected-ATR-ADX-Alert-MAThe VolSC indicator analyzes stock volume trends with a focus on the Pace metric, which projects today's volume as a percentage of the 30-day average, highlighting unusual activity (e.g., over 200% turns bright green with alerts). The phantom projection bar, a wide green histogram to the right of the last bar, visually represents this projected volume on daily charts only, aiding quick identification of potential volume surges without cluttering intraday or weekly views. Additional features include ADX strength, ATR averages, and customizable table display for comprehensive insights.
Key Features:
* Primary Indicator: Volume with ADX (Average Directional Index) text.
* Pacing and Alerts: Calculates the volume pace for the day. Features an unusual volume alert with an adjustable threshold (e.g., 200%).
* Volume Projection: Projects a visual "Phantom Volume" for the day, offset to the right of the actual volume bar.
* ATR Indicator: Displays the 2x ATR (Average True Range) value as text.
* Volume Average: Displays the ADV (Average Daily Volume) Moving Average as text.
* Customization: Most settings are adjustable.
