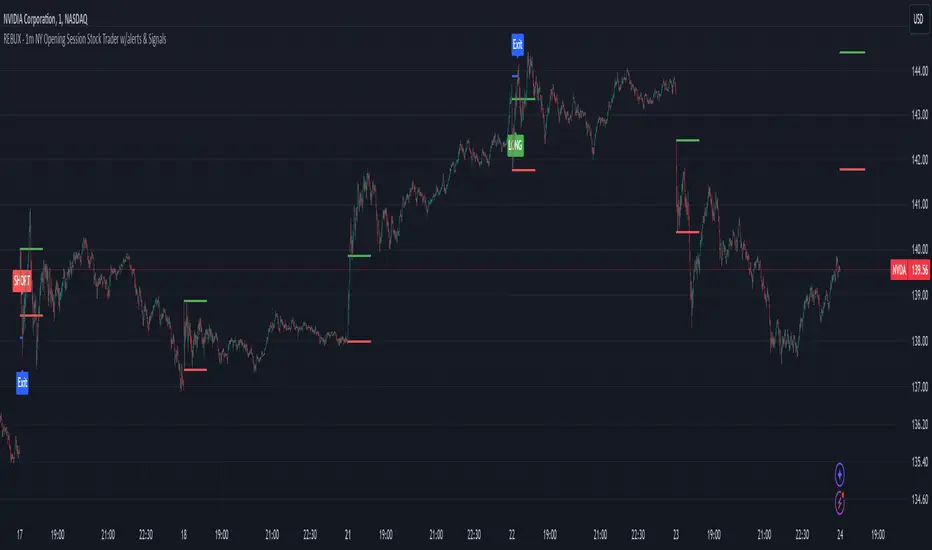
REBUX - 1m NY Opening Session Stock Trader w/alerts & SignalsREBUX - 1m NY Opening Session Stock Trader w/alerts & Signals
This closed-source indicator is designed to trade the volatile New York opening session on a 1-minute chart, offering traders a unique approach to scalping high-probability opportunities. What sets this script apart is its ability to dynamically detect key price ranges in real-time, then apply a percentage-based offset for precise trade entries, along with an automatic take-profit calculation based on the session’s volatility.
How It Works: The script monitors the first few minutes of the New York session to define a price range based on the session high and low. It then calculates entry levels using customizable percentage offsets. When the price crosses above or below these levels, the script triggers alerts for potential buy (LONG) or sell (SHORT) entries. Additionally, the script implements a take-profit level based on a percentage of the detected price range, automatically adjusting as volatility changes.
Key features include:
Customizable timing: Traders can configure the number of minutes after the session open to define the price range and when to stop trading for the day.
Dynamic price offsets: Entry points are calculated based on percentage offsets from the session’s range, ensuring flexibility in volatile markets.
Visual aids and alerts: The script plots visual labels on the chart for LONG and SHORT signals, and provides take-profit exit points, helping traders make informed decisions.
Originality and Usefulness: Unlike many open-source scalping scripts that rely on static strategies or traditional indicators, this script uses a session-specific approach, adapting to real-time price action and volatility. Its focus on the high-impact New York open and integration of automatic TP calculations make it an effective and unique tool for day traders who need to react quickly to market movements.
This script is particularly useful for traders who want to capitalize on the sharp price movements that occur at the NY session open, providing actionable alerts and visual signals to streamline the trading process.
ابحث في النصوص البرمجية عن "alert"
TFC Alerts Multi Time Frame
TFC Alerts Multi Time Frame
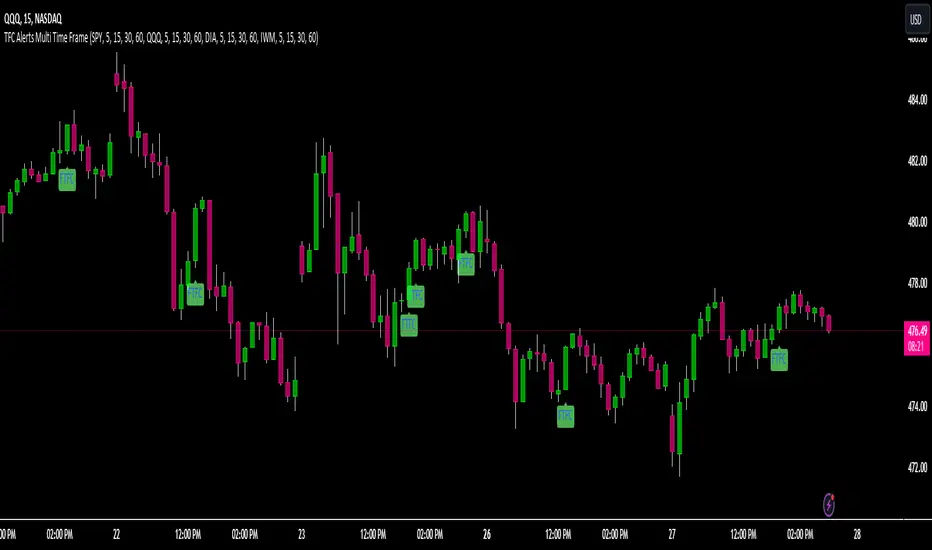
The TFC Alerts Multi Time Frame indicator is a powerful tool designed to monitor full timeframe continuity (FTFC) across multiple symbols and multiple timeframes simultaneously. This indicator tracks the performance of four selected symbols (e.g., SPY, QQQ, DIA, IWM) across four distinct timeframes, providing visual alerts when all selected symbols are in full continuity.
### Key Features:
- **Multi-Timeframe Monitoring:** Track up to four different symbols across four separate timeframes (e.g., 60-minute, daily, weekly, monthly) in a single indicator, offering a comprehensive view of market continuity over various time horizons.
- **FTFC Alerts:** The indicator provides visual labels on the chart when all selected symbols are in full continuity across the chosen timeframes. Green labels indicate that all symbols are above their open prices across all timeframes (bullish FTFC), while red labels show that all symbols are below their open prices (bearish FTFC).
- **Versatile Timeframe Selection:** Each symbol is monitored across four customizable timeframes. Traders can adjust these to fit their trading strategy, whether they are looking at shorter intraday intervals like 5-minute, 15-minute, 30-minute, and 60-minute, or longer-term perspectives such as daily, weekly, monthly, and even quarterly timeframes.
### Image Explanation:
- **Full Timeframe Continuity Overview:** This image illustrates the indicator set to monitor the 5-minute, 15-minute, 30-minute, and 60-minute timeframes for each of the four symbols (SPY, QQQ, DIA, IWM). The FTFC labels plot on the chart when all four timeframes for each symbol align in the same direction. This setup is flexible and can easily be adjusted to longer timeframes such as the 60-minute, daily, weekly, and monthly intervals, depending on the trader’s preferred time horizon.
### Most Powerful Use Case:
The most powerful way to use this indicator is to confirm market trends across your chosen timeframes by monitoring major indices or sector ETFs. For short-term traders, setting the indicator to track 5-minute, 15-minute, 30-minute, and 60-minute timeframes allows for quick identification of intraday trends. For longer-term traders, adjusting the timeframes to 60-minute, daily, weekly, and monthly (or even quarterly and yearly) provides a robust analysis of market alignment over extended periods. This versatility makes it invaluable for executing trades that align with broader market momentum, regardless of the trading horizon.
ICT Setup 01 [TradingFinder] FVG + Liquidity Sweeps/Hunt Alerts🔵 Introduction
The ICT (Inner Circle Trader) style of trading involves analyzing the behavior of market participants and market makers to identify areas where fake buy and sell activities occur. This trading style helps retail traders align with market maker behavior and avoid falling into market traps.
A key aspect of the ICT strategy is focusing on liquidity hunts. This involves searching for trading opportunities in areas of the market with low liquidity or where other traders have little activity. The ICT method leverages market inefficiencies and weaknesses, allowing traders to profit from small price movements that might go unnoticed by others.
In "ICT Setup 01," our focus is on these liquidity areas and stop hunts that form in Fair Value Gaps (FVGs). Trading within FVGs, combined with confirmations from "Hunts" and "Sweeps," can enhance trader performance.
🔵 How to Use
The presence of Fair Value Gaps (FVGs) in the market indicates rapid, powerful movements likely caused by the influx of smart money. When the price returns to these levels, a market reaction is expected.
Combining this with the complex and deceptive behavior of smart money—such as "Liquidity Sweeps" and "Stop Hunts"—forms an ICT-based price action setup that we expect to perform well.
Components of "ICT Setup 01" :
● Fair Value Gap (FVG)
● Premium and Discount
● Hunts / Sweeps
Whenever the price returns to an FVG area and reacts in such a way that only the wicks of the candles remain in the area and the candle bodies are outside the FVG, the first condition for creating the setup is met.
If subsequent candles hunt the wick that has penetrated the deepest into the FVG, a buy or sell signal is issued. In the format where hunting is based on Sweeps, penetrations that extend even outside the area are considered signals, provided they do not form a body within the area.
Additionally, a refining system exists for cases where a candle body forms in the area, optimizing the proximal levels of the FVG.
Bullish Setup :
Bearish Setup :
🔵 Features and Settings of "ICT Setup 01"
You can Find out more in Setting :
● FVG Detector Multiplier Factor
● FVG Validity Period
● Level in Low-Risk Zone
● Issuing Signals Method
● Number of Signals Allowed from a Zone
● Signal after Hunts/Sweeps
● How Many Hunts/Sweeps
● Show or Hide
● Alert Sender
FVG Detector Multiplier Factor :
This feature allows you to determine the size of the moves forming the FVGs based on the ATR (Average True Range). The default value is 1 to identify the majority of setups. You can increase this value according to the symbol and market you are trading in to achieve better results.
FVG Validity Period :
This shows the validity period of an FVG based on the number of candles. By default, an FVG area is valid for up to 15 candles. However, you can increase or decrease this period.
Level in Low-Risk Zone :
This feature helps reduce your risk. The method works by identifying the entire length of the three candles forming the FVG and dividing it into two equal areas. The upper area is "Premium," and the lower area is "Discount." To reduce risk, it is better for "Demand FVG" to be in the "Discount" and "Supply FVG" in the "Premium." This feature is off by default.
Issuing Signals Method :
This feature allows you to specify whether the hunt should occur only within the FVG area or if the wicks can extend outside the area.
If set to "Hunts," only signals where the wicks are within the area are issued, and the area loses its validity if the wicks extend outside.
In "Sweeps" mode, wicks can extend outside the area as long as they do not form a body within the area.
Number of Signals Allowed from a Zone :
This feature allows you to specify how many valid signals can be issued from one area.
Signal after Hunts/Sweeps :
In markets or symbols with a tendency for frequent stop hunts, this feature allows you to specify how many hunts should occur before you receive a signal to avoid receiving potentially failed signals.
How Many Hunts/Sweeps :
Enter the number of hunts you want to set for the "Signal after Hunts/Sweeps" feature here.
Show or Hide :
The number of setups formed may be very large, and displaying all of them on the chart can be distracting and messy. By default, only the last setup is displayed, but if you want to see all setups, you can turn on the relevant options.
Alert Sender :
You cannot constantly monitor multiple charts to identify trading opportunities. Using the alert sending feature can save time and improve performance.
Alerts Name : Customize the alert name to your preference.
Message Frequency : Determines the frequency of alert messages. Options include 'All' (triggers every time the function is called), 'Once Per Bar' (triggers only on the first call within the bar), and 'Once Per Bar Close' (triggers only on the final script execution of the real-time bar upon closure). The default is 'Once per Bar.'
Show Alert Time by Time Zone : Configure the alert messages to reflect any chosen time zone. For instance, input 'UTC+1' for London time. The default is 'UTC.'
By configuring these settings, traders can effectively utilize ICT setups to improve their trading strategies and outcomes.

Change Analysis and AlertsThe "Change Analysis and Alerts" script in Pine Script allows you to analyze and visualize the percentage change of different values on a chart. It calculates the true change based on the closing prices and provides options to input custom values for comparison. The script also includes an alert feature that triggers when the true change exceeds a specified threshold.
Examples:
Analyzing True Change:
Show the true change between consecutive candle closes as a histogram.
Set a threshold for the true change and receive an alert when it surpasses the specified value.
Comparing Custom Values:
Input custom values to analyze the percentage change between different price levels (e.g., high-low, open-close).
Highlight the value with the highest change in each period.
Visualize the changes as columns on the chart for easy comparison.
By using the "Change Analysis and Alerts" script, traders and analysts can gain insights into the magnitude of price changes and receive alerts when significant changes occur.
Please note that this description and examples are provided for illustrative purposes and can be customized based on your specific needs and preferences.
If you need further assistance, feel free to ask.

TrendLine I3-TLIdea:
Draw a trendline that can set an alert every time the price cross over/under.
Concept:
(Note that we take the close to get the closing price).
-Determine the coordinates of 2 points of the line AB: A(x1;y1); B(x2;y2).
-Apply Oxy geometry to the chart with price as Oy axis, time as Ox axis. Use linear equations to determine:
+If point's x > line's x, the point is to the right of the line.
+If point's x < line's x, the point is to the left of the line.
+If point's x == line's x, the point is on the line.
-Determine when the price is crossOver or crossUnder the trend line, display that time on the chart and send an alert.
How it works:
1. Input value to config the line by manually:
- Y1: Price 1 as point 1.
- X1: Time at point 1.
- Y2: Price 2 as point 2.
- X2: Time at point 2.
X2 (To date) must be after X1 (From date).
Please consider time (hour, minute) if timeframe < 1hour.
Then draw a line on the pouring table with straight line AB as solid line, extended line as broken line. Logic will start from dashed line (To date in input).
If the price changes value from side to side of the line, show the text label, change the background color accordingly (blue top, red bottom),
also sends an alert ("CrossUnder"; "CrossOver").
2. The indicator's operating range is limited to 500 bars from the "From date" bar. When reaching to the outside, it will show a yellow warning with outbound message.
3. Set alert for this indicator, it will send alert follow 1. condition.
Suitable time frames:
5m, 15m, 1h, 4h, 1D
* Please note that this logic does not attempt to predict future prices or 100% accurate signal.
This is FREE indicator.
(Please direct message or visit website if you want to try another invite-only indicators)
Hope you guys enjoy!
Examples:
GOLD 1D
EURUSD 1H

Elliott Wave Theory [Alerts]This indicator may be one of the first to provide signals & alerts for the Elliott Wave Theory Pattern. Unfortunately, there are few, if any, indicators that are public which allow the Elliott Wave Theory to be plotted+with alerts.
Because this is experimental, I'm going to offer access to it free of charge. Send me a direct message requesting access.
Elliott Wave Theory is a complex chart pattern to learn, and even harder to master. It requires being able to identify the wave lengths of price history and using various tools to plot and assess the price structure in order to find the wave counts. Whilst there are many ways to compute the waves apart of the pattern, there is no universal method that everyone would agree upon. For this indicator, I am using the traditional method.
The different colors represent different cycle types. Using it on a higher timeframe is strongly encouraged for best results.
This version currently provides alerts for the final wave, wave 5. I WILL BE ADDING MORE TO THIS INDICATOR SHORTLY, SEE BELOW:
-Will be adding the other counts to display all the waves
-Will be adding 'correction wave' alerts
-Will be adding 'inverse' pattern alerts
-Will be improving the the labels to include their cycle type
This is not a buy & sell indicator.. This is a TOOL to help analyze the market using Elliott Wave Theory.
The indicator should be used for the following:
-Aiding with EWT analysis
-Helping find potential exit points
-Assist with learning EWT by using this as a template
-Timing trades and improving risk management
-Plotting the overall market

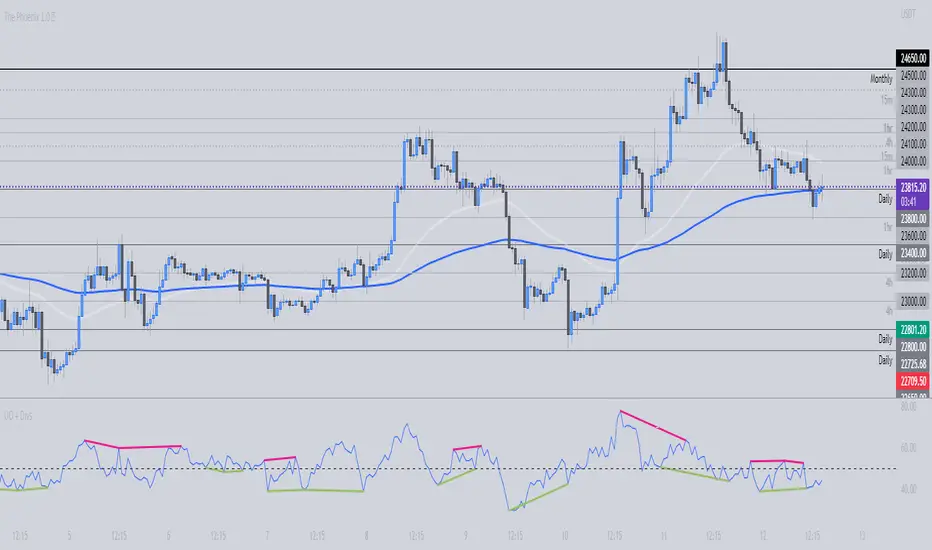
TSI + DivergencesTrue Strength Indicator (TSI) + Divergences + Alerts + Lookback periods.
This version of the True Strength Indicator adds the following 3 additional features to the stock TSI by Tradingview:
- Optional divergence lines drawn directly onto the oscillator.
- Configurable alerts to notify you when divergences occur.
- Configurable lookback periods to fine tune the divergences drawn in order to suit different trading styles and timeframes.
This indicator adds additional features onto the stock TSI by Tradingview, whose core calculations remain unchanged. Namely the configurable option to automatically, quickly and clearly draw divergence lines onto the oscillator for you as they occur, with minimal delay. It also has the addition of unique alerts, so you can be notified when divergences occur without spending all day watching the charts. Furthermore, this version of the TSI comes with configurable lookback periods, which can be configured in order to adjust the sensitivity of the divergences, in order to suit shorter or higher timeframe trading approaches.
The True Strength Indicator
Tradingview describes the True Strength Indicator as follows:
“The True Strength Index (TSI) is a momentum oscillator that ranges between limits of -100 and +100 and has a base value of 0. Momentum is positive when the oscillator is positive (pointing to a bullish market bias) and vice versa. It was developed by William Blau and consists of 2 lines: the index line and an exponential moving average of the TSI, called the signal line. Traders may look for any of the following 5 types of conditions: overbought, oversold, centerline crossover, divergence and signal line crossover. The indicator is often used in combination with other signals..”
What are divergences?
Divergence is when the price of an asset is moving in the opposite direction of a technical indicator, such as an oscillator, or is moving contrary to other data. Divergence warns that the current price trend may be weakening, and in some cases may lead to the price changing direction.
There are 4 main types of divergence, which are split into 2 categories;
regular divergences and hidden divergences. Regular divergences indicate possible trend reversals, and hidden divergences indicate possible trend continuation.
Regular bullish divergence: An indication of a potential trend reversal, from the current downtrend, to an uptrend.
Regular bearish divergence: An indication of a potential trend reversal, from the current uptrend, to a downtrend.
Hidden bullish divergence: An indication of a potential uptrend continuation.
Hidden bearish divergence: An indication of a potential downtrend continuation.
Setting alerts.
With this indicator you can set alerts to notify you when any/all of the above types of divergences occur, on any chart timeframe you choose.
Configurable lookback values.
You can adjust the default lookback values to suit your prefered trading style and timeframe. If you like to trade a shorter time frame, lowering the default lookback values will make the divergences drawn more sensitive to short term price action.
How do traders use divergences in their trading?
A divergence is considered a leading indicator in technical analysis, meaning it has the ability to indicate a potential price move in the short term future.
Hidden bullish and hidden bearish divergences, which indicate a potential continuation of the current trend are sometimes considered a good place for traders to begin, since trend continuation occurs more frequently than reversals, or trend changes.
When trading regular bullish divergences and regular bearish divergences, which are indications of a trend reversal, the probability of it doing so may increase when these occur at a strong support or resistance level. A common mistake new traders make is to get into a regular divergence trade too early, assuming it will immediately reverse, but these can continue to form for some time before the trend eventually changes, by using forms of support or resistance as an added confluence, such as when price reaches a moving average, the success rate when trading these patterns may increase.
Typically, traders will manually draw lines across the swing highs and swing lows of both the price chart and the oscillator to see whether they appear to present a divergence, this indicator will draw them for you, quickly and clearly, and can notify you when they occur.
Disclaimer : This script includes code from the stock TSI by Tradingview as well as the RSI divergence indicator.

Ultimate Oscillator + DivergencesUltimate Oscillator (UO) + Divergences + Alerts + Lookback periods.
This version of the Ultimate Oscillator adds the following 3 additional features to the stock UO by Tradingview:
- Optional divergence lines drawn directly onto the oscillator.
- Configurable alerts to notify you when divergences occur.
- Configurable lookback periods to fine tune the divergences drawn in order to suit different trading styles and timeframes.
This indicator adds additional features onto the stock Ultimate Oscillator by Tradingview, whose core calculations remain unchanged. Namely the configurable option to automatically, quickly and clearly draw divergence lines onto the oscillator for you as they occur, with minimal delay. It also has the addition of unique alerts, so you can be notified when divergences occur without spending all day watching the charts. Furthermore, this version of the Ultimate Oscillator comes with configurable lookback periods, which can be configured in order to adjust the sensitivity of the divergences, in order to suit shorter or higher timeframe trading approaches.
The Ultimate Oscillator
Tradingview describes the Ultimate Oscillator as follows:
“The Ultimate Oscillator indicator (UO) indicator is a technical analysis tool used to measure momentum across three varying timeframes. The problem with many momentum oscillators is that after a rapid advance or decline in price, they can form false divergence trading signals. For example, after a rapid rise in price, a bearish divergence signal may present itself, however price continues to rise. The ultimate Oscillator attempts to correct this by using multiple timeframes in its calculation as opposed to just one timeframe which is what is used in most other momentum oscillators.”
More information on the history, use cases and calculations of the Ultimate Oscillator can be found here: www.tradingview.com
What are divergences?
Divergence is when the price of an asset is moving in the opposite direction of a technical indicator, such as an oscillator, or is moving contrary to other data. Divergence warns that the current price trend may be weakening, and in some cases may lead to the price changing direction.
There are 4 main types of divergence, which are split into 2 categories;
regular divergences and hidden divergences . Regular divergences indicate possible trend reversals, and hidden divergences indicate possible trend continuation.
Regular bullish divergence: An indication of a potential trend reversal, from the current downtrend, to an uptrend.
Regular bearish divergence: An indication of a potential trend reversal, from the current uptrend, to a downtrend.
Hidden bullish divergence: An indication of a potential uptrend continuation.
Hidden bearish divergence: An indication of a potential downtrend continuation.
Setting alerts.
With this indicator you can set alerts to notify you when any/all of the above types of divergences occur, on any chart timeframe you choose.
Configurable lookback values.
You can adjust the default lookback values to suit your prefered trading style and timeframe. If you like to trade a shorter time frame, lowering the default lookback values will make the divergences drawn more sensitive to short term price action.
How do traders use divergences in their trading?
A divergence is considered a leading indicator in technical analysis, meaning it has the ability to indicate a potential price move in the short term future.
Hidden bullish and hidden bearish divergences, which indicate a potential continuation of the current trend are sometimes considered a good place for traders to begin, since trend continuation occurs more frequently than reversals, or trend changes.
When trading regular bullish divergences and regular bearish divergences, which are indications of a trend reversal, the probability of it doing so may increase when these occur at a strong support or resistance level. A common mistake new traders make is to get into a regular divergence trade too early, assuming it will immediately reverse, but these can continue to form for some time before the trend eventually changes, by using forms of support or resistance as an added confluence, such as when price reaches a moving average, the success rate when trading these patterns may increase.
Typically, traders will manually draw lines across the swing highs and swing lows of both the price chart and the oscillator to see whether they appear to present a divergence, this indicator will draw them for you, quickly and clearly, and can notify you when they occur.
Disclaimer : This script includes code from the stock UO by Tradingview as well as the RSI divergence indicator.
Moon Launch Alerts Template [Indicator]I created this indicator/study script because i ran into the issue that the same Alerts would fire multiple times. For example it would trigger a Long signal when already being in a Long. I guess there would be no issue with a very basic strategy but with a larger script and many variables, it seemed to create complications.
This is resolved by a TradingLine oscillator and only when it switches to a new and different position from previous, will it trigger an Alert.
If you are in a Long and it signals Long again, then this is seen as a "Continuation Long" in the Alerts settings. You can use this condition to add to your existing position (Optional). Continuation signals are plotted as bright green/red dots.
You will notice there's an option to uncheck "Trade Shorts" and "Trade Exits" signals.
Lets say you choose not to trade Short and Exits, then your Long would only Exit once a Short signal is detected.
This could prove useful for Back-testing purposes.
This quick example script uses the EMA 10, EMA 200, emaPlus1Atr and emaMinus1Atr.
To use in your script, you will need to modify and add your own BUY/SELL/EXIT signals in the box where it says:
//// INPUT YOUR BUY/SELL/EXIT SIGNALS HERE: ////
//////////////////////////////////////////////////
Hope someone will find this useful, or even just as an additional visual confirmation for your own trading strategy and script.

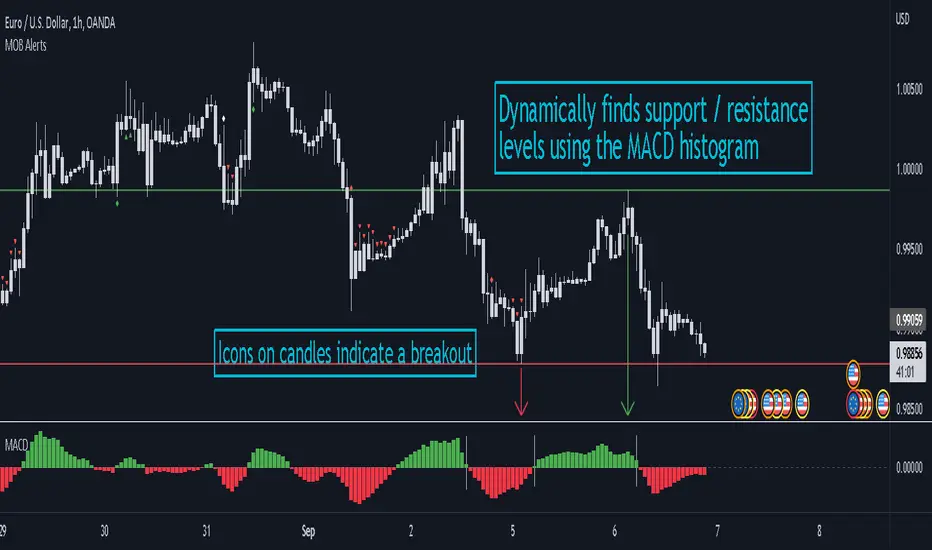
MACD Objective Breakouts + AlertsFinds the most recent support and resistance level as confirmed by the MACD . These level are detected dynamically and the lines will be updated as new levels form.
Alerts can be toggled on or off in the settings but will not work if the alert is not added to your chart. Alerts can be added by selecting the "Alert" button on TradingView then selecting "MOB Alerts" as the condition
Alerts will trigger when price closes above or below the indicated levels.
Please let me know if you find any bugs!
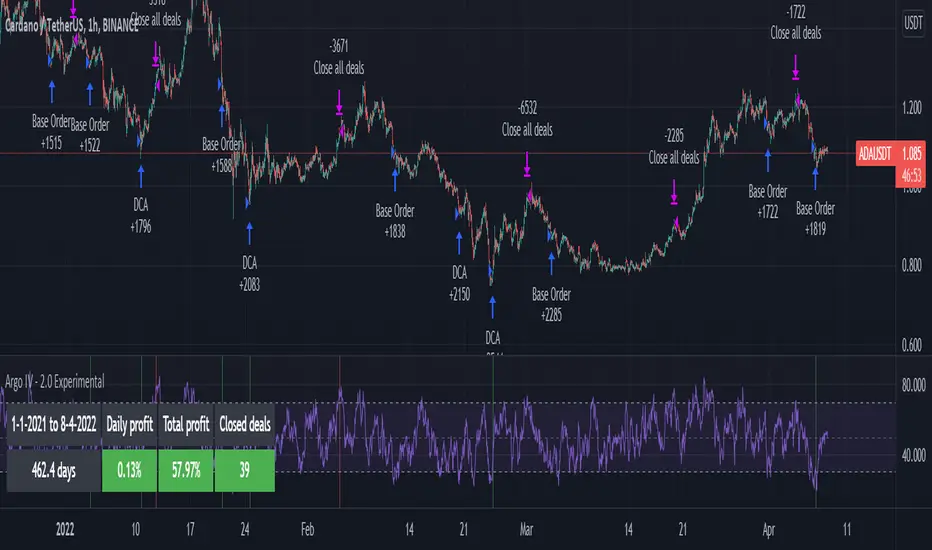
Argo IV - EXPERIMENTAL strategy for 3commas with alertsThis strategy lets users create BUY/SELL alerts for 3commas single bots in a simple way, based on a built in set of indicators that can be tweaked to work together or separately through the study settings. Indicators include Bollinger Bands , Williams %R , RSI , EMA , SMA , Market Cipher, Inverse Fisher Transform, RSI divergence.
It is based on the ARGO I study ( here ), with the following major differences:
- It uses pyramiding (see strategy "properties")
- It includes a lot of new options for deal start/close conditions for maximum control
- It doesn't require any external tool to backtest.
If the user choses to create both BUY and SELL signals from the study settings, the alert created will send both BUY and SELL signals for the selected pair. Note the script will only send alerts for the pair selected in the study settings, not for the current chart (if different).
Important : it is only an early experiment, I will only release the script when satisfied with performance. Until then, I advise not to use this for any real trading.
How to use:
- Add the script to the current chart
- Open the strategy settings , insert bot details. Pairs MUST be in capital letters or 3commas will not recognize them.
- Still in the settings, tweak the deal start/close conditions from various indicators until happy. The strategy will plot the entry / exit points on the chart
- When happy, right click on the "..." next to the study name, then "Add alert'".
- Under "Condition", on the second line, chose "Any alert () function call". Add the webhook from 3commas, give it a name, and "create".
CDC Action Zone - 3Commas AlertCDC Action Zone, The well know indicator using EMA 12 and EMA 26.
When EMA 12 crosses EMA 26 will be a signal to trade.
You can change EMA that you want from settings.
This indicator work with 3Commas - Crypto DCA Bot . (Tradingview custom signal)
You can get a "BOT ID" and "Email token" from 3Commas when you create a bot.
Add into text box in indicator's settings.
After that create alert in Tradingview
Check webhook and using Url below for send signals to 3Commas bot.
3commas.io
This indicator will alert 40 Symbols at one time. (Tradingview set max symbols at 40)
If you want to alert more than 40 symbols, you can change symbols from settings and create new alert.

Argo I (alerts for 3commas single bots)This script lets users create BUY/SELL alerts for 3commas single bots in a simple way, based on a built in set of indicators that can be tweaked to work together or separately through the study settings. Indicators include Bollinger Bands, Williams %R, RSI, EMA, SMA , Market Cipher, Inverse Fisher Transform.
If the user choses to create both BUY and SELL signals from the study settings, the alert created will send both BUY and SELL signals for the selected pair. Note the script will only send alerts for the pair selected in the study settings, not for the current chart (if different).
How to use:
- Add the script to the current chart
- Open the study settings , insert bot details. Pairs MUST be in capital letters or 3commas will not recognize them.
- Still in the study settings, tweak the deal start/close conditions from various indicators until happy. The study will plot the entry / exit points below the current chart (1 = buy, 2 = sell)
- Ideally, test the settings with a backtesting script. The present script is compatible with the Trading Parrot's backtester.
- When happy, right click on the "..." next to the study name, then "Add alert'".
- Under "Condition", on the second line, chose "Any alert () function call". Add the webhook from 3commas, give it a name, and "create".
Happy tweaking!

Bank Heist ( Matrix 5 EMA With Delorean Indicator Alerts )Bank Heist ( Market Maker / Matrix 5 EMA With Delorean Indicator Alerts )
Welcome to the "Bank Heist" Indicator
This indicator is based on one strategy that many many individuals and companies have tried to label as their own, brand it, and resell it. The names of these companies will be listed below as to not "steal" the strategy from the people trying to brand EMA's and also to help those using keyword searches (based on the many hot terms coined over the years) to find this indicator. I personally have decided to add to the confusion and call it the "Bank Heist" so as to not appear to be "stealing" someone elses name for free indicators 😊
The Strategy
Simple:
The EMA's are below price, look for buys. EMA's above price, look for sells.
The 50 EMA is ALWAYS market equilibrium
Intermediate:
5 EMA Crossing Up 13 EMA With The 50 EMA Under everything = Buy
5 EMA Crossing Down 13 EMA with 50 EMA Above everything = Sell
The 50 EMA is ALWAYS market equilibrium
Advanced:
Simple+Intermediate
The higher period the EMA , the Longer the trend.
All time frames must pull back to ALL EMA's at some point during the trend
🤯 Each EMA is one period different, one time frame up or down (Example: The 13 EMA on the 15m chart is the same as the 5 EMA on the 1hr Chart)
🔑 If you don't understand this and/or want to study it further then mark each EMA on the 15m chart, then move up one time frame at a time all the way to the daily chart.
🧙♂️ After it "clicks" , just remember that price must always pull back to all EMA's on all time frames, The 50 EMA is ALWAYS market equilibrium
Delorean Indicator Alerts:
Set alarms on TradingView with this indicator!
For those who don't know what this is:
Two candles cutting through the 13 ema, second candle bigger, trade in the direction of the trend.
Special Notes:
The 50 EMA is ALWAYS market equilibrium
The Highly Skilled Will See How To Get The Worlds Tightest Stop Loss
THIS WORKS ON ALL TIME FRAMES (Yes, 1 minute throught 1 year)
THIS WORKS ON ANY FINANCIAL INSTRUMENT
You Can Also Set Alerts For The EMA's Crossing ( 5 EMA Crossing 13 EMA , ETC.)
🔮 Study These, You Cant Make This Up 🔮
Famous Trading System Names That Got You Here
Ordered from true original to most recent "creators" in chronological order
FXPX
Matrix
Matrix Trading System
Matrix 5 EMA
5 EMA
5 EMA's
Market Maker
MarketMaker
Delorean
Delorean Indicator
Delorean Strategy
IM Academy
Bank Heist (Free & Condensed TradingView Indicator)
DISCLAIMER
THIS IS NOT FINANCIAL OR INVESTMENT ADVICE AND SHOULD NOT BE INTERPRETED AS SUCH.
Trading foreign exchange on margin carries a high level of risk, and may not be suitable for all investors. Past performance is not indicative of future results. The high degree of leverage can work against you as well as for you. Before deciding to invest in foreign exchange you should carefully consider your investment objectives, level of experience, and risk appetite. The possibility exists that you could sustain a loss of some or all of your initial investment and therefore you should not invest money that you cannot afford to lose. You should be aware of all the risks associated with foreign exchange trading, and seek advice from an independent financial advisor if you have any doubts.

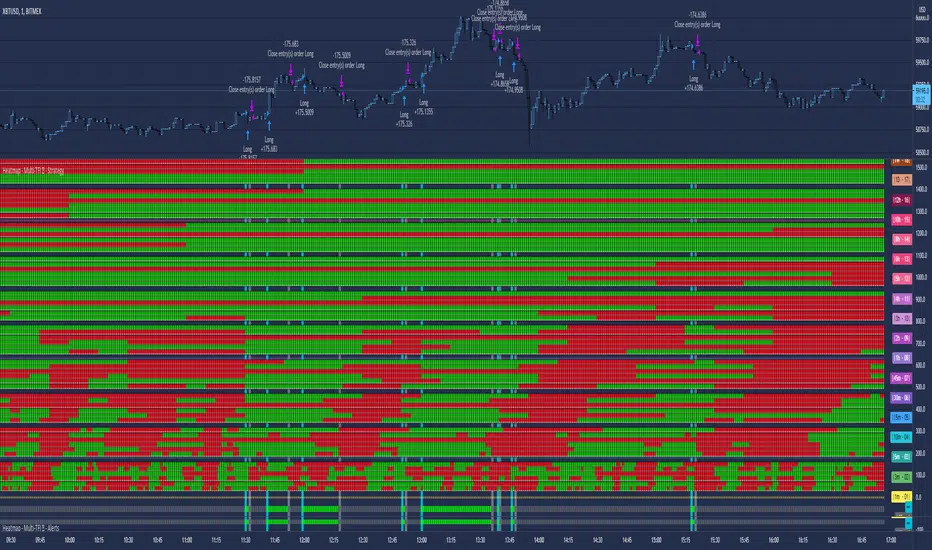
Heatmap - Multi-Timeframe Indicators - AlertsHeatmap - Multi-Timeframe Indicators - Alerts
▪ Main features :
- 19 Timeframes: 1m, 3m, 5m, 10m, 15m, 30m, 45m, 1h, 2h, 3h, 4h, 5h, 6h, 8h, 10h, 12h, 1D, 1W, 1M
- 6 indicators per timeframe
- choose specific timeframes for indicators (example - 1 hour)
- or choose specific timeframe ranges (example - 1 hour to 1 month)
The general idea is that the higher timeframe signals are stronger than the lower timeframe ones.
When a trend is starting, it is first visible on the lower timeframes.
The more time passes, the more the trend propagates through higher timeframes.
The default settings are meant to show all the available features. You may fine-tune it to your specific needs.
How to choose the timeframe for the chart : use the lowest of the choosen timeframes for indicators.
If the heatmap doesn't display correctly on your device, you may check the Heatmap Theme 🎨 setting.
It doesn't repaint.
"Repaint" version available though - good to check the past history, but very bad for real-time analysis.
▪ Indicators used for trend detection
1. MACD Cross
2. Stochastic Cross
3. Stochastic Cross and Overbought or Oversold
4. Moving Average
5. Parabolic SAR
6. Heikin Ashi
▪ Find the best Heatmap settings with the Strategy Tester version.
The signals generated by the Heatmap are considered to be valid at the bar open .
The Strategy Tester, however, uses the bar close in its calculations.
Therefore, the results may seem to be worse than they can be.
The Profitability, Profit Factor and other stats should be taken into consideration relatively to other configurations of the same Heatmap.
▪ Using a score system to consider a change in trend valid.
Example: consider the signal valid if 65% or more of all indicators (max 6) among all timeframes (max 19) hint at a change in trend.
The % percent value can be inserted in settings.
When using the default settings or when all timeframes and indicators are activated,
the ratio of 100% downtrend or 100% uptrend may be less occuring. Adjust accordingly.
The signals across timeframes and indicators are aggregated to show simple entry and exit signals.
▪ Combined Alerts, to be set to fire once per bar open :
0 - 📈 Long! - Heatmap - Multi-TFI
0 - 📈 Short! - Heatmap - Multi-TFI
0 - 📈 Long Exit! - Heatmap - Multi-TFI
0 - 📈 Short Exit! - Heatmap - Multi-TFI
1 *** BUY or SELL (single alert) ***
1 *** Entries or Exits (single alert) ***
▪ Note : The initial load may be slow. If something doesn't seem to work, you can try the following:
- wait more time for it to load
- hide & show or remove & add back to chart
- don't add the indicator to chart multiple times in a short amount of time, as you may be rate limited
▪ Related Studies :
- Heatmap - Multi-Timeframe Indicators - Strategy Tester
- Risk Management System (Stop Loss, Take Profit, Trailing Stop Loss, Trailing Take Profit) - it can be connected to Heatmap - Multi-Timeframe Indicators - Alerts
▪ Layout example:
ELLIPSE: Bidirectional Swing Trading Strategy (Alert Version)This is the alert version of our original script ELLIPSE: Ultimate Bidirectional Swing Trading Strategy.
This release has the same internal algorithm as the ELLIPSE Strategy script. But instead of showing back test results, this script provides the functionality to add alerts that can notify the user via email / pop-up / sms / app once a signal is given! You must manually add these alerts via TradingView. If you need help setting up these alerts, feel free to ask in the comment box or send us a dm.
***The script is invite-only, message us to get script access***
-------------------------------------------------------------------------------------------------
User Guidelines:
The trading strategy was designed and optimized for trading cryptocurrencies only ; furthermore it works best on established cryptocurrencies that have a clear historical trend such as:
BTCUSD
ETHUSD
LTCUSD
XRPUSD
ADAUSD
The trading strategy is based on swing trading methodology. The script must therefore be used on 4h candles only .
Use USD trading pairs only (e.g. use ETHUSD instead of the ETHBTC) since the individual trend is captured more effectively and therefore gives better results.
The trading strategy is bidirectional , both long and short entries are generated.
-------------------------------------------------------------------------------------------------
Indicators used in this strategy:
Ichimoku Cloud ; acts as the leading indicator.
Volume ; without strong volume , a market move is not valid.
MACD and Vortex ; both being used as confirmation indicators.
Choppiness index ; avoids trading in choppy markets.
Simple and Exponential Moving Averages ; prevents trading against the trend.
The trading strategy is easy to use, bidirectional, trend based and without repainting, meaning once a signal has been made it is permanent and that no future data is used in the decision making. It detects the trend and filters out market noise based on more than 10 technical indicators. ONLY when all indicators align with each other the algorithm prints a LONG or SHORT signal. The trading strategy provides high probability trading signals and minimizes risk! This script aims to capture the profit from short to medium trending moves and by doing so filters out non-substantial trends and avoids the associated risks with these trades.
-------------------------------------------------------------------------------------------------
Features:
NO Repaint once candle is closed.
Stop loss feature ; set your own stop loss to manage your risks.
Customizable Display for the Ichimoku cloud indicator display.
Bidirectional ; both long and short trading positions can be enabled.
Full backtest feature ; Easily generate your own backtest results for each asset (Strategy Version Script).
Alerts ; Get notified via email / pop-up / sms / app once a signal is given! (Alert Version Script).
-------------------------------------------------------------------------------------------------
Backtest results
Below are the back test results. Only well established cryptocurrencies are displayed with a clear historical trend.
Back test results: (long and short trades, signal to signal, order size: 100% of equity, commision fee 0.1%, period: start of chart)
Exchange-----Asset---------Timeframe---Percent Profitable----Profit Factor-----Total Trades----Max Drawdown---Average bars in trade-----Net Profit
Bínance------BTCUSDT---------4H-----------------54.4---------------3.37-------------------57----------------14.9---------------------38------------------1978
Bínance------ETHUSD----------4H-----------------50.9---------------3.48------------------- 57---------------26.8----------------------37------------------3953
Bínance------LTCUSD-----------4H-----------------61.0---------------3.15-------------------59----------------20.9---------------------33------------------3098
Bínance------XRPUSD----------4H-----------------43.1---------------2.44--------------------51---------------22.4----------------------26------------------1226
Bínance------ADAUSD----------4H-----------------57.5---------------3.47--------------------47---------------34.7----------------------35------------------1233
-------------------------------------------------------------------------------------------------
Reminder: Use this trading strategy at your own risk and trade responsibly. We are not responsible for any financial loss using this strategy.
***The script is invite-only, message us to get script access***

MA Proximity Alert SystemThis script enables you to get an alert when the price gets in close proximity to moving average of your choice.
►Proximity is a true range multiplied by the number of your choice
►It is designed to be used as a one-use alert. If you enable it to give you one alert per bar close, it is possible to limit the spam by number of periods for which price must be outta proximity range
►Calculations T3, EMA, SMA for true range channel
►EMA and SMA for moving average
I circled the areas where I find the reaction somewhat interesting. Although, I think there are more areas when alert would be useful in the chart.
Have a great trade!

$ SuPeR-RePaNoCHa $ [Alerts]Script for automatic trading (Alerts). This is the second part of the previous RePanoCHa script but with Take Profit.
It Use 6 indicators + volume:
-JURIK MOVING AVERAGE
-RANGE FILTER (DONOVAN WALL)
-ADX (ORIGINAL VERSION)
-PARABOLIC SAR
-RSI + VOLUME WEIGHTED (LAZYBEAR)
-MACD
-VOLUME
To close the position you can choose between Take Profit only, Trailing Stop only or both at the same time.
Example of bot syntax: (alerts once per bar)
LONG | e=BINANCEFUTURES a=ACCOUNT s=BTCUSDT c=order | delay=1 | e=BINANCEFUTURES a=ACCOUNT s=BTCUSDT c=position b=short t=market ro=1 | delay=1 | e=BINANCEFUTURES a=ACCOUNT s=BTCUSDT b=long q=100% t=market | delay=1 | e=BINANCEFUTURES a=ACCOUNT s=BTCUSDT c=position b=long p=0.7% q=50% t=post ro=1
SHORT | e=BINANCEFUTURES a=ACCOUNT s=BTCUSDT c=order | delay=1 | e=BINANCEFUTURES a=ACCOUNT s=BTCUSDT c=position b=long t=market ro=1 | delay=1 | e=BINANCEFUTURES a=ACCOUNT s=BTCUSDT b=short q=100% t=market | delay=1 | e=BINANCEFUTURES a=ACCOUNT s=BTCUSDT c=position b=short p=-0.7% q=50% t=post ro=1
LONG TP | e=BINANCEFUTURES a=ACCOUNT s=BTCUSDT c=position q=50% t=market ro=1 (if you set the TP from entry this alert is not necessary)
SHORT TP | e=BINANCEFUTURES a=ACCOUNT s=BTCUSDT c=position q=50% t=market ro=1 (if you set the TP from entry this alert is not necessary)
LONG TS | e=BINANCEFUTURES a=ACCOUNT s=BTCUSDT c=position q=10% t=market // (alerts once per minute)
SHORT TS | e=BINANCEFUTURES a=ACCOUNT s=BTCUSDT c=position q=10% t=market // (alerts once per minute)
XLONG/STOP-LOSS | e=BINANCEFUTURES a=ACCOUNT s=BTCUSDT c=order | delay=1 | e=BINANCEFUTURES a=ACCOUNT s=BTCUSDT c=position b=long t=market ro=1
XSHORT/STOP-LOSS | e=BINANCEFUTURES a=ACCOUNT s=BTCUSDT c=order | delay=1 | e=BINANCEFUTURES a=ACCOUNT s=BTCUSDT c=position b=short t=market ro=1

Rhaps SMAEMA Combo v1.1There's many versions of this sort of thing around the Tradingview library, but i guess we all like things to our own specifications.
So this is my take on the SMA and EMA version combined.
Bunch of SMA's & EMA's, with labels, and G&D Cross Labels and Alerts.
These values can of course be changed to any you may prefer.
Rhapsodyy's Combo SMAEMA's v1.1
SMA's with Painted Labels : 10/30/50/80/200
EMA's with Painted Labels : 21/50/89/200/377
50SMA / 200SMA Golden & Death Crosses on Current Timeframe & Alerts
Daily 50SMA / 200SMA Golden & Death Crosses overlayed onto Current Timeframe & Alerts
50EMA / 200EMA Golden & Death Crosses on Current Timeframe & Alerts
Daily 50EMA / 200EMA Golden & Death Crosses overlayed onto Current Timeframe & Alerts

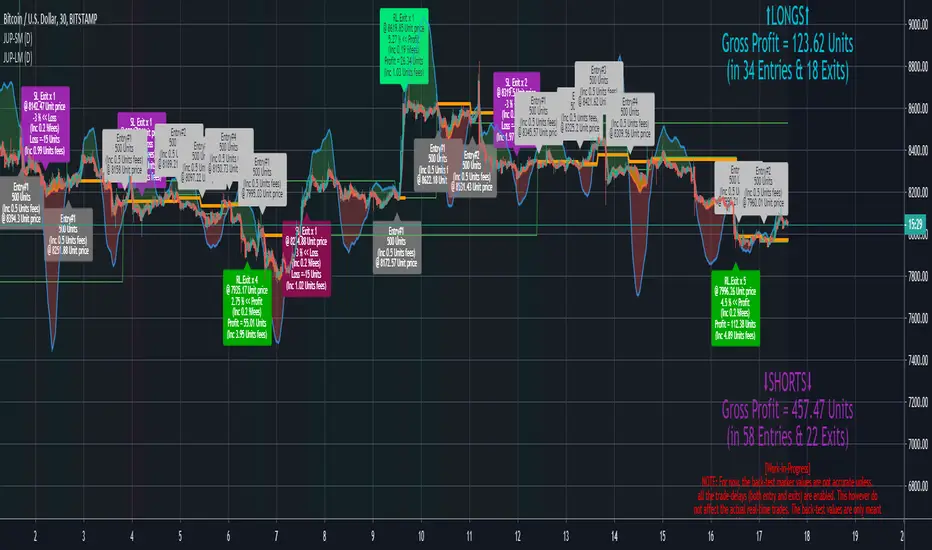
JERK UP {LM.Alerts Edition} (D)This is the " LONGS-MANAGEMENT Alerts " {LM.Alerts} Edition of JERK UP to enable auto-trading via alerts signaling.
Only the long-signals, generated from the underlying JERK UP algorithm, is used in this strategy-alerts script, with my latest risk-exit (collect gains) and stop-limit algorithms, as well as a bear-market filter, implemented.
~ * ~ * ~ * ~ * ~ * ~ * ~ * ~ * ~ * ~ * ~ * ~ * ~ * ~ * ~ * ~ * ~ * ~ * ~ * ~ * ~
Since {LM.Alerts} engine only focuses on trading and managing longs, a bear-market filter is implemented base on the FUSIONGAPS indicator.
The FUSIONGAPS algorithm signals local bull or bear market phases, and then disables trades conditionally to reduce the chances of having to take losses during a local bear market phase (since the short-signals are not traded).
Enabling the different (Fastest >> Slowest) FUSIONGAPS levels (e.g. 50/15, 100/50, 200/50, 200/100, etc) activates the use of each of these levels to decide the local bull/bear market phases.
So in summary, the {LM.Alerts} algorithm trades up a bullish-hill, taking profits along the way; but stops all trading activity when the market is rolling down a bearish-hill; and then once a local bull-phase is detected again, it resumes trading, etc.
Note: To trade on both bullish and bearish phases, {LM.Alerts} scripts can be applied on an inverse-chart (i.e. 0-BTCUSD) for shorts.
The {LM.Alerts} engine will be ported to my other more powerful trade-signaling scripts in the future.
~ * ~ * ~ * ~ * ~ * ~ * ~ * ~ * ~ * ~ * ~ * ~ * ~ * ~ * ~ * ~ * ~ * ~ * ~ * ~ * ~
FUSIONGAPS V5
Note: In no way is this intended as a financial/investment/trading advice. You are responsible for your own investment decisions and/or trades.
~JuniAiko
(=^~^=)v~
QuantNomad - Ultimate Pivot Points AlertsCreated a universal script for pivot points alerts.
In the script, you can choose one of 4 pivot point types: Traditional, Fibonacci, Woodie, and Camarilla.
You are able to create separate alerts for every level or create one for price crossing any level.
For separate levels, you can choose: "Cross", "Crossover" and "Crossunder".
You can also choose to show/hide:
Historical Levels
Levels Values
Current Levels - Levels calculated on the current period, on close of the period they will become valid levels for next periods. These levels do not participate in alerts calculations.
Because of some TradingView limitations, alerts won't be fired for the first bar of the session.
In the script used new v4 plotting features, so will be able to plot levels and labels nicely. Unfortunately, there is a limit on the number of consecutive lines you can plot on the plot (around 50), so historical lines in the past will disappear after 6-7 periods.
And remember:
Past performance does not guarantee future results.
RePaNoCHa [Alerts]Script for automatic trading with Alerts (Use Backtest to customize your own settings)
All timeframes but good results on 2H.
LG --> Long
ST --> Short
TS --> Trailing Stop
xL --> Close Long Position
xS --> Close Short Position
SL --> Stop Loss
The trailing stop closes the trade if the price changes direction by a specified percentage or offset. There is no ideal distance because markets and price are always changing and we know that is impossible to exit on the top or bottom. This script interpolate the trailing Stop Offset with profit, higher profit -- > higher Trailing Stop Offset. Despite this, it's difficult to catch the price. If someone comes up with a good idea, comment, I'm happy to learn.
No security() function so no repaint but has time() and can appear a warning for it.
Alerts:
'Once per bar' More profit but not confirmed alerts (10-20% fake alerts)... I like risk
'Once per bar close' Confirmed alerts (0% fake alerts)... You will sleep better
Some settings:
XBTUSD (BITMEX)
Timeframe = 2H
Position Side = BOTH
Source = hlc3
T3 Length = 5
T3 Volume Factor = 0.9
Sampling Period = 16
Range Multiplier = 1.3
ADX lenght = 10
ADX Threshold = 20
SAR start = 0.07
SAR inc = 0.02
SAR max = 0.15
Pyramiding = 10
Trailing Stop Activation % = 0.5
Trailing Stop Offset % (when profit=0.5 %) = 0.35
Trailing Stop Offset % (when profit=10 %) = 1.5
Stop Loss = 3.5
Tics/Pips Correction = 10
Initial Capital = 1000
Quantity = 100 %
Commission value = 0.075 %
ETHUSD (BITMEX)
Timeframe = 2H
Position Side = BOTH
Source = hlc3
T3 Length = 5
T3 Volume Factor = 0.7
Sampling Period = 13
Range Multiplier = 0.9
ADX lenght = 11
ADX Threshold = 19
SAR start = 0.06
SAR inc = 0.03
SAR max = 0.15
Pyramiding = 10
Trailing Stop Activation % = 0.5
Trailing Stop Offset % (when profit=0.5 %) = 0.35
Trailing Stop Offset % (when profit=10 %) = 1.5
Stop Loss = 4
Tics/Pips Correction = 100
Initial Capital = 1000
Quantity = 100 %
Commission value = 0.075 %
BNBUSDT (BINANCE)
Timeframe = 2H
Position Side = LONG
Source = hlc3
T3 Length = 3
T3 Volume Factor = 1.6
Sampling Period = 17
Range Multiplier = 1.3
ADX lenght = 5
ADX Threshold = 18
SAR start = 0.04
SAR inc = 0.03
SAR max = 0.25
Pyramiding = 10
Trailing Stop Activation % = 0.5
Trailing Stop Offset % (when profit=0.5 %) = 0.4
Trailing Stop Offset % (when profit=10 %) = 1.5
Stop Loss == false
Tics/Pips Correction = 10000
Initial Capital = 1000
Quantity = 100 %
Commission value = 0.075 %
LTCUSDT (BINANCE)
Timeframe = 2H
Position Side = LONG
Source = hlc3
T3 Length = 3
T3 Volume Factor = 1.6
Sampling Period = 11
Range Multiplier = 1.1
ADX lenght = 6
ADX Threshold = 22
SAR start = 0.07
SAR inc = 0.04
SAR max = 0.15
Pyramiding = 10
Trailing Stop Activation % = 0.5
Trailing Stop Offset % (when profit=0.5 %) = 0.4
Trailing Stop Offset % (when profit=10 %) = 1.5
Stop Loss == false
Tics/Pips Correction = 100
Initial Capital = 1000
Quantity = 100 %
Commission value = 0.075 %
TRXUSDT (BINANCE)
Timeframe = 2H
Position Side = LONG
Source = hlc3
T3 Length = 3
T3 Volume Factor = 0.9
Sampling Period = 8
Range Multiplier = 1.2
ADX lenght = 4
ADX Threshold = 22
SAR start = 0.07
SAR inc = 0.04
SAR max = 0.15
Pyramiding = 10
Trailing Stop Activation % = 0.5
Trailing Stop Offset % (when profit=0.5 %) = 0.4
Trailing Stop Offset % (when profit=10 %) = 1.5
Stop Loss == false
Tics/Pips Correction = 100000
Initial Capital = 1000
Quantity = 100 %
Commission value = 0.075 %
NAS100 (OANDA)
Timeframe = 2H
Position Side = BOTH
Source = hlc3
T3 Length = 3
T3 Volume Factor = 1
Sampling Period = 12
Range Multiplier = 1.3
ADX lenght = 18
ADX Threshold = 21
SAR start = 0.08
SAR inc = 0.06
SAR max = 0.25
Pyramiding = 10
Trailing Stop Activation % = 0.2
Trailing Stop Offset % (when profit=0.5 %) = 0.15
Trailing Stop Offset % (when profit=10 %) = 1
Stop Loss = 1.8
Tics/Pips Correction = 10
Initial Capital = 1000
Quantity = 3 contracts
Commission value = 0.2 USD per contract
NATGAS(OANDA)
Timeframe = 2H
Position Side = BOTH
Source = hlc3
T3 Length = 3
T3 Volume Factor = 1
Sampling Period = 18
Range Multiplier = 1.1
ADX lenght = 10
ADX Threshold = 17
SAR start = 0.1
SAR inc = 0.04
SAR max = 0.35
Pyramiding = 10
Trailing Stop Activation % = 0.2
Trailing Stop Offset % (when profit=0.5 %) = 0.15
Trailing Stop Offset % (when profit=10 %) = 1
Stop Loss = 1.6
Tics/Pips Correction = 1000
Initial Capital = 1000
Quantity = 4500 contracts
Commission value = 0.002 USD per contract
SPX500 (OANDA)
Timeframe = 2H
Position Side = BOTH
Source = hlc3
T3 Length = 3
T3 Volume Factor = 0.6
Sampling Period = 14
Range Multiplier = 1.3
ADX lenght = 12
ADX Threshold = 17
SAR start = 0.23
SAR inc = 0.05
SAR max = 0.2
Pyramiding = 10
Trailing Stop Activation % = 0.15
Trailing Stop Offset % (when profit=0.5 %) = 0.1
Trailing Stop Offset % (when profit=10 %) = 0.75
Stop Loss = 1.5
Tics/Pips Correction = 10
Initial Capital = 1000
Quantity = 8 contracts
Commission value = 0.2 USD per contract
US30 (OANDA)
Timeframe = 2H
Position Side = BOTH
Source = hlc3
T3 Length = 4
T3 Volume Factor = 0.9
Sampling Period = 11
Range Multiplier = 1.1
ADX lenght = 16
ADX Threshold = 24
SAR start = 0.08
SAR inc = 0.03
SAR max = 0.05
Pyramiding = 10
Trailing Stop Activation % = 0.15
Trailing Stop Offset % (when profit=0.5 %) = 0.1
Trailing Stop Offset % (when profit=10 %) = 0.75
Stop Loss = 1.5
Tics/Pips Correction = 10
Initial Capital = 1000
Quantity = 1 contracts
Commission value = 1.5 USD per contract
WHEAT (OANDA)
Timeframe = 2H
Position Side = BOTH
Source = hlc3
T3 Length = 3
T3 Volume Factor = 1.1
Sampling Period = 12
Range Multiplier = 1
ADX lenght = 13
ADX Threshold = 21
SAR start = 0.07
SAR inc = 0.05
SAR max = 0.15
Pyramiding = 10
Trailing Stop Activation % = 0.2
Trailing Stop Offset % (when profit=0.5 %) = 0.15
Trailing Stop Offset % (when profit=10 %) = 1
Stop Loss = 2.5
Tics/Pips Correction = 1000
Initial Capital = 1000
Quantity = 2500 contracts
Commission value = 0.003 USD per contract

Magic 4.0 Alerts//HOW TO SET ALERTS
// 1 - Apply script to chart
// 2 - Click Alerts icon at the top toolbar
// 3 - Under "Condition", choose "Magic v2.1 Alerts" in the 1st dropdown menu
// 4 - In the 2nd dropdown menu under "Conditions", choose "Crossing Up"
// 5 - To the right of the "Value" dropdown menu, choose a value of "1"
// 6 - set remaining parameters below to your choosing (Options, Exp . time, Alert actions, Message)
// 7 - Click "Create" and the alert is set
