Normalized Average True RangeThis indicator was originally developed by John Forman (Stocks & Commodities, V.24:6 (May, 2006): "Cross-Market Evaluations With Normalized Average True Range").
Mr. Forman uses a normalized average true range indicator to analyze tradables across markets.
Good luck!
ابحث في النصوص البرمجية عن "range"

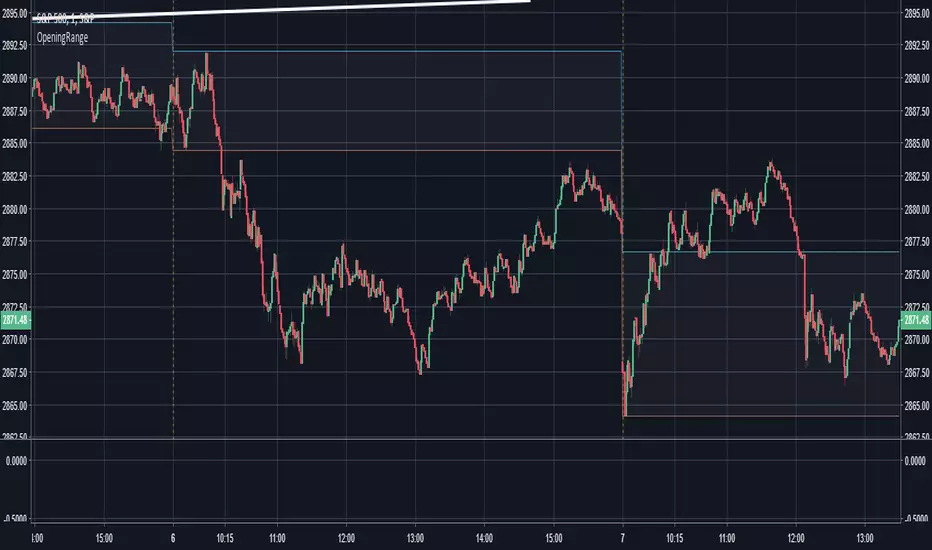
Opening Range - 30m range based on Chris Moody'sThis is a very simple 30-minute opening range script based on Chris Moody's.
It simply highlights the high and low of the opening 30-minutes of trading on a day chart.
This high/low often holds as the range for the day, or can signify an early breakout, often acting as support/resistance once the breakout occurs.
Day25RangeDay25Range(1) - Plot on the candle the 25% low range of the daily price. This helps to show when the current price is at or below the 25% price range of the day. Best when used with other indicators to show early wakening strength in price. On the attached chart, if you look at Jan 23, 2018 you will see a red candle that closed below the 25% mark of the trading day. For that day the 25% mark was at 38.66 and the close of the day was at 38.25 That indicators a potential start of a strong swing trade down. A second signal was given on Jan 25, 2018 when a red candle closed (37.25) below the 25% mark (38.08) again. Within the next few days a third weak indicator signaled on Jan 30,2018 with a close (35.88) below the Day25Range (37.46). price continued down from there for the next 4 days before starting to reverse. If the price closes below the 25% daily range as shown on the Day25Range(1) indicator, this could indicate a possible start of weakening in the price movement.
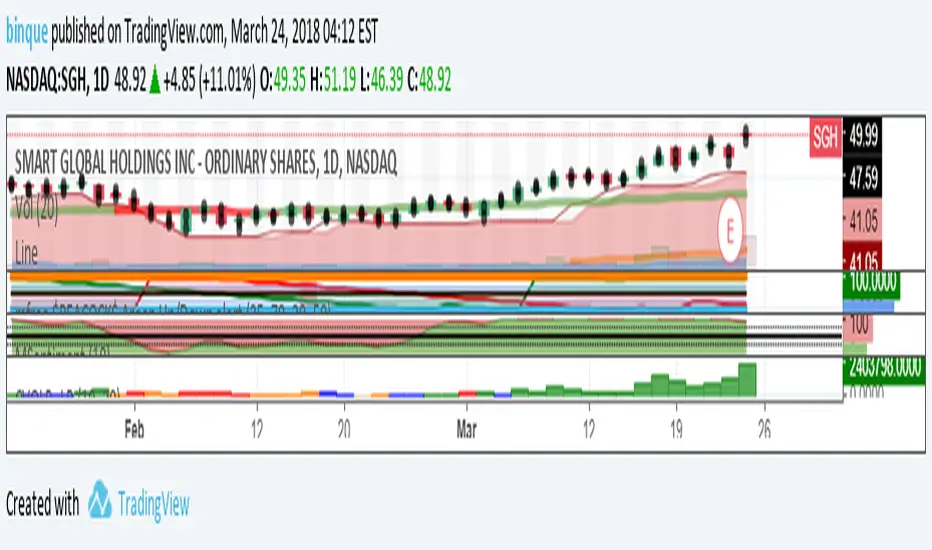
Day75RangeDay75Range(1) use to plot the 75% range of a trading day. I use a CIRCLE or DOT to indict the 75% range of the trading day.

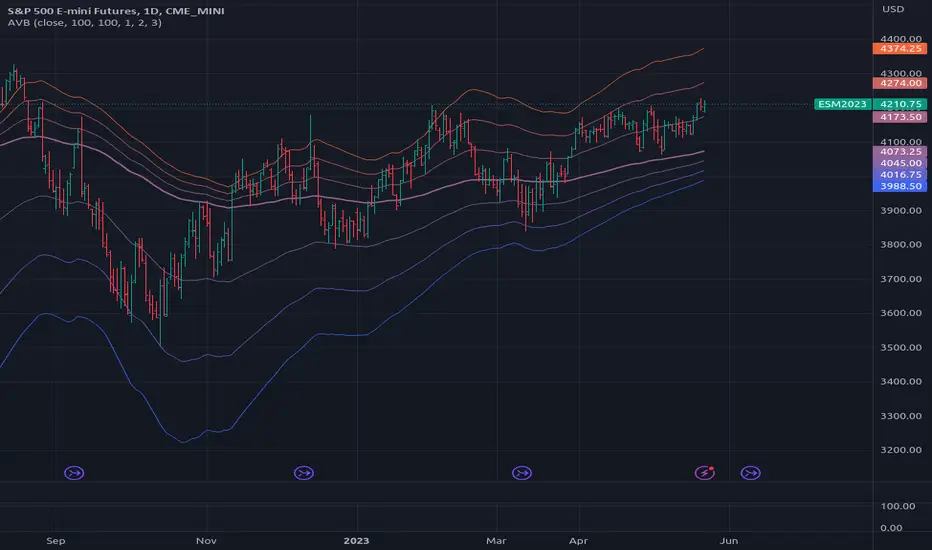
Moving Average Range Channels [DW]This study is an experiment based off the concept used in my Dynamic Range Channel indicator.
Rather than using a McGinley Dynamic, a moving average of your choice is used in this calculation.
There are eight different moving average types to choose from in this script:
- Kaufman's Adaptive Moving Average
- Geometric Moving Average
- Hull Moving Average
- Volume Weighted Moving Average
- Least Squares Moving Average
- Arnaud Legoux Moving Average
- Exponential Moving Average
- Simple Moving Average
For a more refined picture of volatility, I've added upper and lower extension channels. They are calculated by adding the upper half range to the channel high, and subtracting the lower half range from the channel low.
The new custom bar color scheme indicates trends, midline crosses, MA crosses, and overbought and oversold conditions.

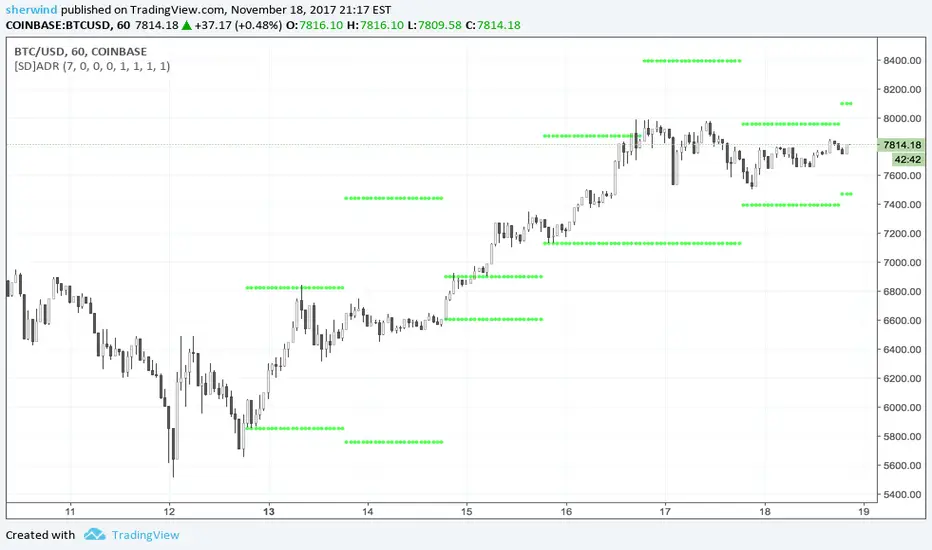
SD - Average Daily Range - Daily Weekly Monthly YearlyAverage Daily Range ('ADR') Indicator for TradingView
This script is based on the "Best 'ADR' Indicator for MT4" described at www.fxdayjob.com
Inputs:
Number of 'ADR' Back - Set the number of calendar days back to plot historical 'ADR'. The default value is 7.
Non-trading days are not taken into account.
A value of 7, for example, would display only 5 'ADR' for a 24x5 market.
Number of 'AWR' Back - Set the number of calendar weeks back to plot historical 'AWR'. The default value is 0.
Number of 'AMR' Back - Set the number of calendar months back to plot historical 'AMR'. The default value is 0.
Number of 'AYR' Back - Set the number of calendar years back to plot historical 'AYR'. The default value is 0.
'ADR' Length parameter - Set the length parameter of 'ADR'. The default value is 1.
'WDR' Length parameter - Set the length parameter of 'AWR'. The default value is 1.
'MDR' Length parameter - Set the length parameter of 'AMR'. The default value is 1.
'YDR' Length parameter - Set the length parameter of 'AYR'. The default value is 1.
See also:
- www.fxdayjob.com
- pivotboss.com
- www.jarrattdavis.com

ChartMojo Opening 1 min. range -V1Opening 1 min range script. Many view (floor traders) the opening minute as how the overnight energy gets delivered to the market and is an important gravity -3.55% area, with its own support and resistance . There are probabilities (roughly) in some instruments that price tends to have a high percentage of returning to the range at least once in 2 days. In my experience it returns to it often on most days. On chart example here..(especially in futures ) price tends to return to it often and in this case when it returns from the bottom..sells tend to stack up in front of it on the first approach several tiers deep. Price tends to reverse on this range..if it breaks through it, it often marks a shift in trend. Try it for yourself. For me it's indispensable. Wave structures often start and end (exhaust) there. Also the relationship of the previous days opening range is shown..which can show an important relationship (trend). It's an interesting shift thinking in terms of opens rather than closes. Many view trend and market structure from the open to be the most relevant, and the opening 1 min range is an important element. Enjoy. I like to use this with my trading time zones. Might want to reference Pivots , Patterns and Intraday Swing Trades by William Scheier.

NR(X) IndicatorNarrow Range Indicator can help determine when a possible Break Out can occur through narrowing price action.
The diamonds above the bar shows the bar to completed the Narrowest Range (high - low) of your selected time period. The default period is 7 but can be changed through the inputs. The next bar will indicate with a label weather it is a predicted Break UP (Green label) or Break Down (Red label).
The original creator of this style of indicator (thepatternsite.com) even admits the accuracy is only around 50%. To help increase those odds I combined his original work with an ATR(x) to help guesstimate the direction of breakout based on overall trend direction.

[RS]Volatility Explosive Measure V0EXPERIMENTAL:
Measures the volatility range of current price range, can help detect squeezes as well explosive moves

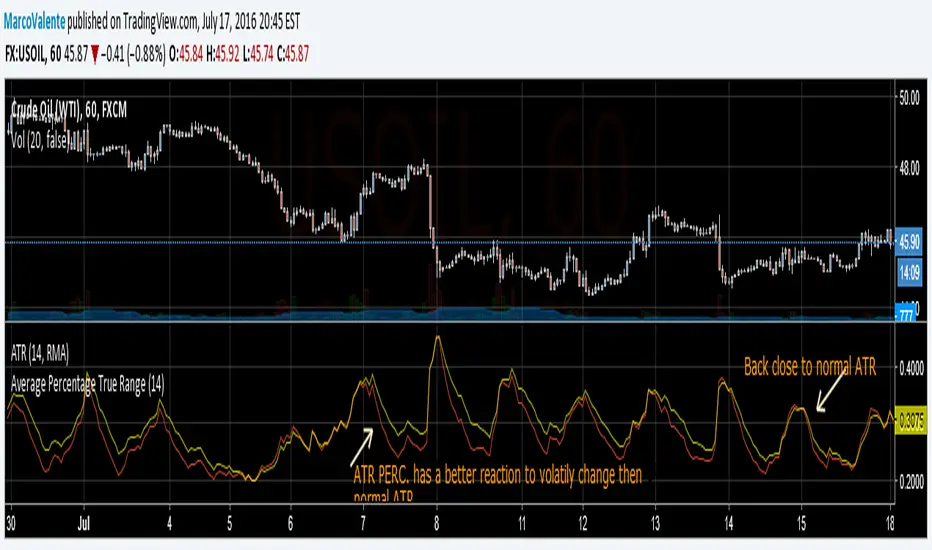
Average Percentage True RangeAvarage True Range Percentage is a volatility indicator that use percent value of the volability. It looks to react better to vol. change. It could be add to other indicator as volatility range value
[RS]Average Variation Bands V1optional method for cumulative averaging of the range variation.
optional length for averaging range variation.
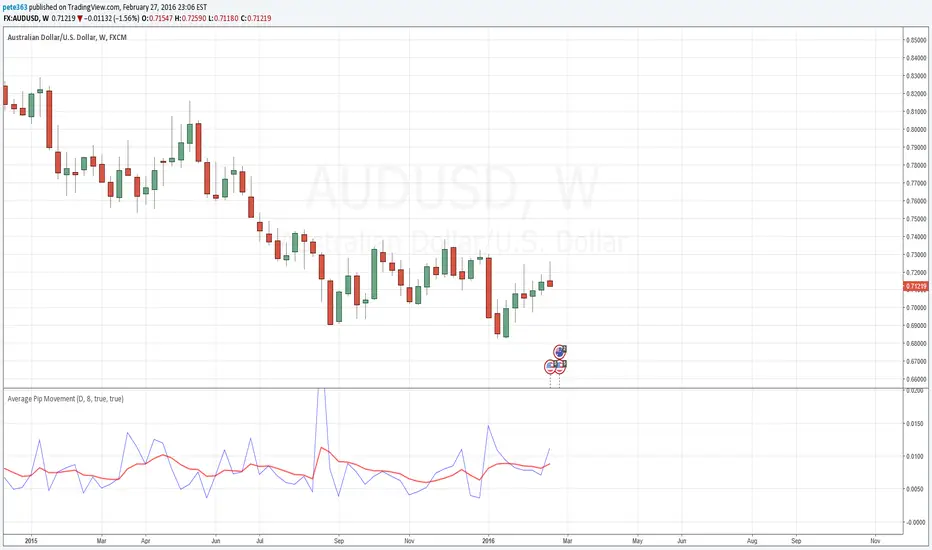
Average Pip MovementAverage Price Movement inidcator displays the high/low for the period over time. On top of that an 8 period exponential moving avergae is attached
to get average movement over time. It provides, for eg. on a Daily chart, gives a day range and this can be used to book profits or place stop loss.
It is very simple indicator to provide price range over time.
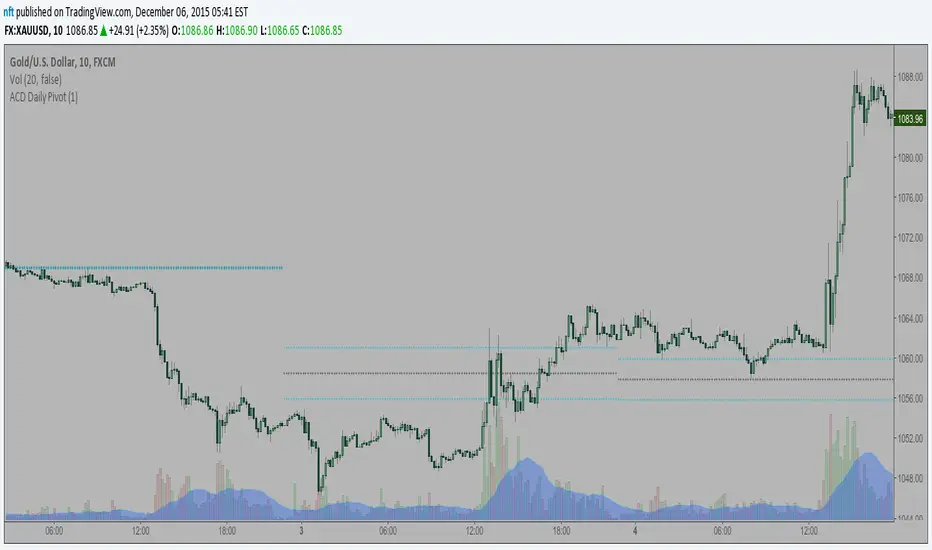
ACD Daily Pivot RangeThis indicator is to display the Daily Pivot Range for Mark Fishers "ACD" method.
If anyone knows how to offset it for different start times (LO, NYO) please let me know so I can update. Ideally the daily daily pivot calculation start should be from the same time as your opening range but i am not sure how to do this.
[RS]Long Term Price Range Analysis (MML)Study on Price range Regression and range (deviation multiplier needs to be accommodate manually to fit price action)
study was made for time frames above weekly

CM Opening Range-Asia and Europe SessionCM Opening Range Asia AndEurope Sessions
Requested by rayhug1 to use Asia Range of 5pm Est to 2am Est...uses 540 minutes (5pm to 2am Est — 9 Hours) to calculate the Range...then breakouts trigger after 2am
-Ability to change Start and End Times to use any entire session.
---Defaults to 540 minutes (9 hours) but Opening Range Calculation can be changed to 1 hour, 2 hour etc. in Inputs tab
***Known Bug…Currently will NOT Plot accurately the U.S. Session from 0800 to 0759. Will Update Indicator when Fixed.
-Ability to Change the Start and End Times to Accommodate any session.
—Default is 1700 to 1659 (Asian Range)
—Europe Session 0200 to 0159
***All times are based on New York Time or Eastern Standard time … GMT-5
***Times will change based on Daylight Savings Time.

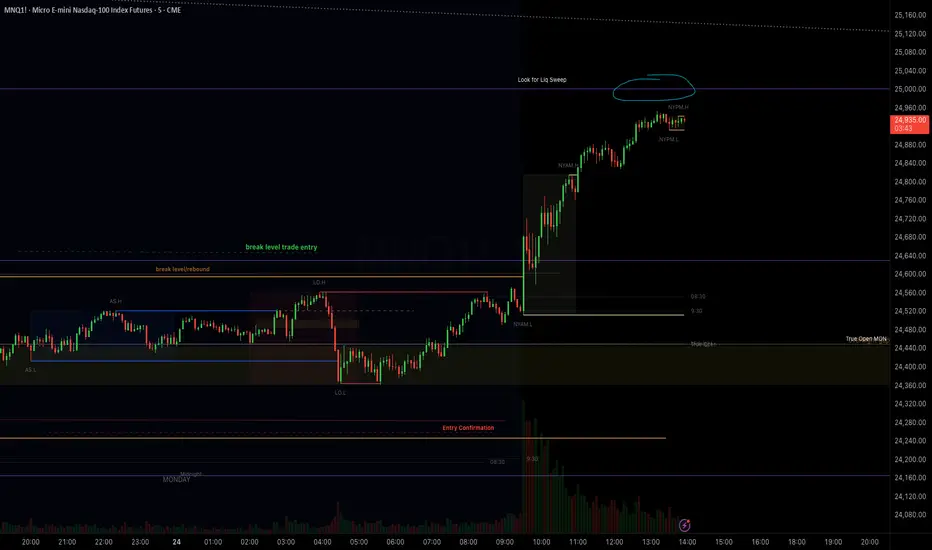
Daily contextThis indicator automatically marks the Previous Day’s High and Low, as well as the market’s midnight opening price.
These levels are updated at the start of each new trading day and remain visible throughout the entire session.
By providing key daily reference points, the indicator helps establish a clear market context and allows traders to immediately understand where price is positioned relative to the previous day’s range and the daily open.

Opening Range ICT 3-Bar FVG + Engulfing Signals (Overlay)Beta testing
open range break out and retest of FVG.
Still working on making it accurate so bear with me

Daily Range SeqDaily Range Seq
Time Window: 04:00 - 10:25 EST
Eval. Window: 10:30 - 15:55 EST
Time Window sets the target for price during the Eval. Window.
If high of time window is created first, then target the high during the Eval. Window.
If low of time window is created first, then target the low during the Eval. Window.

NY 9:30-9:35 High/Low Range📘 Script Description
This script automatically identifies and plots the high and low of the 5-minute candle formed between 9:30 AM and 9:35 AM New York time, which corresponds to the opening of the U.S. equity market.
The goal is to provide a clear reference level for intraday volatility, directional bias, and breakout levels.
🔍 Function Overview
■ 1. Detects the 9:30–9:35 NY Time Candle
The script converts chart timestamps into New York session time and automatically captures the 5-minute candle that forms between:
NY 9:30:00 → NY 9:35:00
■ 2. Automatically Draws Horizontal Lines
After identifying the high and low of this candle, the script draws:
High line → Red
Low line → Blue
Lines start exactly at the 9:30 timestamp
Lines extend 3 hours into the future (until NY 12:30)
Lines do not extend beyond 3 hours (prevents unwanted diagonal lines or lines from previous days)
■ 3. Label Display at NY 20:00
The script places a label at New York 20:00, marking:
“9:30 High” for the high line
“9:30 Low” for the low line
This allows you to instantly identify the key reference levels at the end of the trading day.
■ 4. Auto-Removal at NY 20:00
At NY 20:00, both the lines and the labels are automatically deleted.
No old lines remain on the chart, ensuring clarity and accuracy for each new trading day.
🎯 Purpose and Use Cases
This script is highly useful for:
Determining intraday direction after the NY open
Tracking volatility spikes at the U.S. equity market open
Identifying breakout levels
Using high/low as dynamic support and resistance throughout the day
Understanding market context during economic events or high-impact sessions
The 9:30–9:35 range is one of the most watched price zones in global markets, often serving as the day’s initial liquidity sweep.
📝 Key Features
Accurate New York time conversion
Clean horizontal lines (no previous-day diagonal lines)
Labels positioned clearly at NY 20:00
No unnecessary visuals—simple and effective
Lightweight script with minimal chart impact

Opening Range with Breakouts & Targets w/ Alerts [LuxAlgo]This is the exact Lux Algo opening range with Breakouts and Targets, but added the ability to fire alerts on buy and sell signals

Multi-Timeframe Opening RangeMulti Time frame range created to find trends and look for blocks of time in which the market is most likely to pivot.
Also assists in finding trends more easily highs and lows.
Take bounces and rejections off the boxes it works well.

Silent 60pt Volatility Trigger (60pt Range in 5min)This alert triggers when a 5 minute candle reaches a range of 60pts in a 5 min candle /MNQ. Good for a mid day vol alert