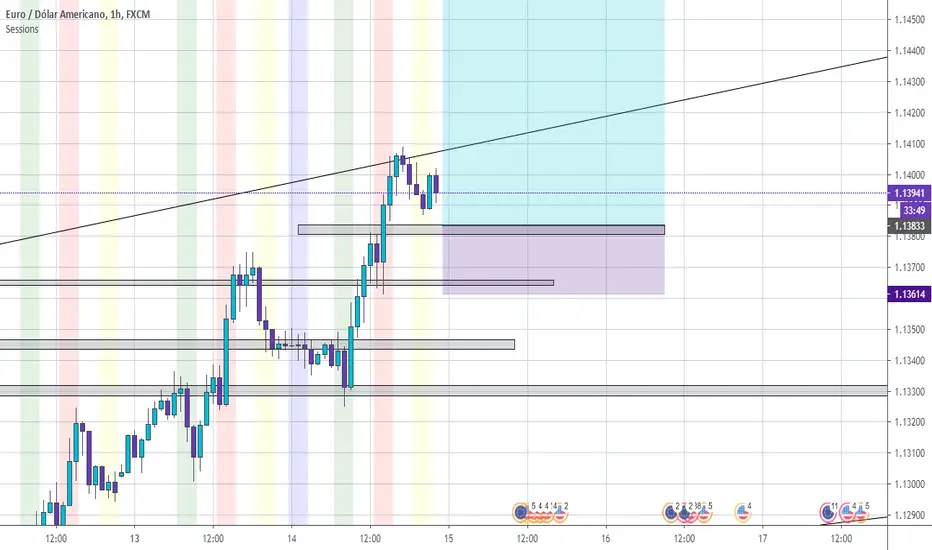
Flexible timezone-aware session rangeAllows you to define session range with local time and its timezone, also can toggle session visibility any day of week.
ابحث في النصوص البرمجية عن "session"


Trading Session IndicatorFollowing time zones showing:
Asia Session - Red
London Open - White
London Session - Blue
NY Open - White

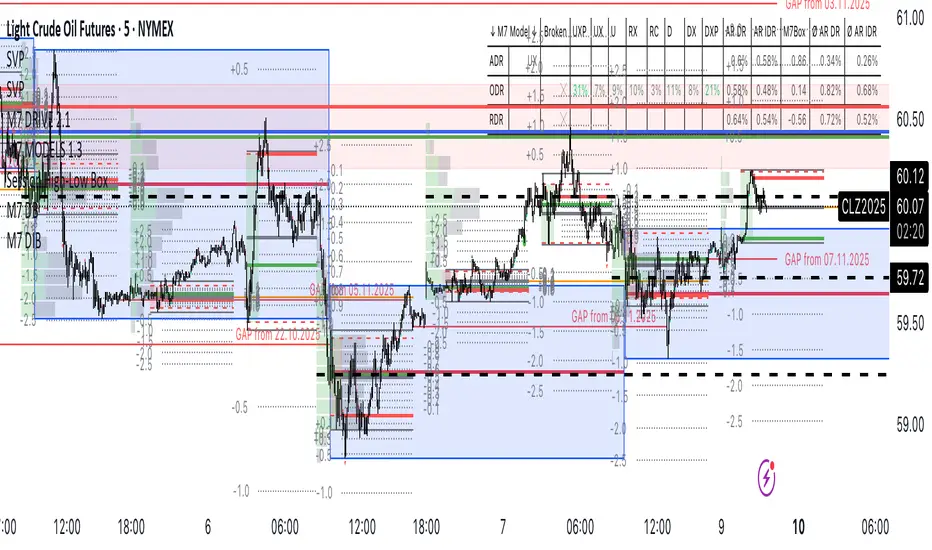
Session High-Low Box,
Session High-Low Box Session High-Low Box indicatorSession High-Low BoxSession High-Low BoxSession High-Low BoxSession High-Low BoxSession High-Low BoxSession High-Low BoxSession High-Low BoxSession High-Low BoxSession High-Low BoxSession High-Low BoxSession High-Low BoxSession High-Low BoxSession High-Low BoxSession High-Low BoxSession High-Low BoxSession High-Low BoxSession High-Low BoxSession High-Low BoxSession High-Low BoxSession High-Low BoxSession High-Low BoxSession High-Low Boxwrtvtrvwrtv4v2tr2Session High-Low Box24v2v2Session High-Low Box
Session times for London (UTC 07:00–16:00 UTC)Session times for London (UTC 07:00–16:00 UTC). Shows the trading hours for the London Session Mon-Fri

Forex Session High/Low TrackerThis indicator maps out each Forex session along with their relative highs and lows.

ICT Index Futures Session LinesICT Index Futures Session Lines
Description:
The script is based on one of ICT's concepts on trading Index Futures. The script lays out the daily range from an intraday basis.
Range:
00:00 - New York Midnight
08:30 – New York Open (News events come out)
12:00/13:00 - New York Lunch (No trade time period)
13:30 - (Algorithm)
16:30 - Close
* The open, high and low lines are plotted from 00:00 to 08:30
How To Use:
You will need to check the daily bias. Prior to 8:30 you are to look for previous swing points where liquidity may exist. During the open you want to see if a high or low is taken out, and then wait for an energetic break/displacement for a potential FVG/imbalance retracement entry.
Strategy is for LTF (1 to 15m)
Default time zone is set to America/New_York (UTC New York), so lines will be plotted correctly regardless of user’s local UTC chart setting.


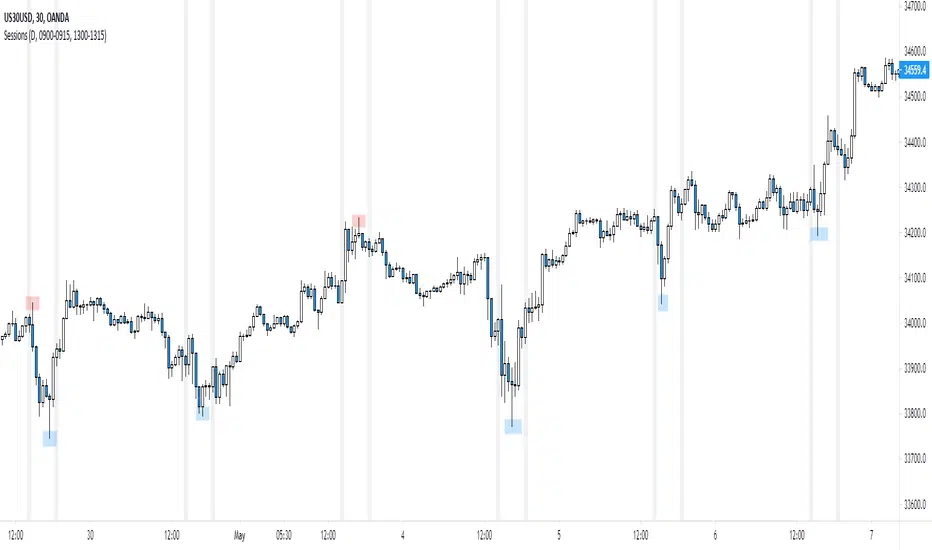
NY Session
Script to highlight the new york session trading hours
-The most volatile hours for us30 & the time in which it's most likely to make a significant high/low
[FN] Session Range & Date Range For BacktestingThis has been done before in different ways, however, my goal is to publish a single, simplified copy/paste version of the idea so you can quickly and easily incorporate it into your strategy backtesting.
You can designate weekdays, weekdays + weekends for 24/7 markets, and also session range.
So, you trade bitcoin? It works. CME futures? It works. You are a discretionary trader so the only signals that matter are the ones that happen when you're awake? It works. Copy and paste.
The goal is that its that easy. You'll have to let me know if it is. glhf everyone.
If I'm not mistaken, you should be able to copy/paste this directly into your strategy script (Paste it in before your entry declarations). Just leave out the last 2 lines where the bgcolor() is declared... unless you want the background color lit up, that's up to you. It's just for demonstration purposes in this script.
After you've pasted it in, then in your strategy.entry() function you are adding: to the strategy.entry() function.
e.g:
strategy.entry("Long", strategy.long, qty=1, when = ENTRY_SIGNAL and signal_backtest())
Shoutouts to @zenandtheartoftrading and @allanster for providing the basis of this code that I put together here. We stand on the shoulders of giants.


Session P4L SNIPERSsession separator only for the operation of the academy. by its time margin. added the asian range for a power of three

SessionBarThis PineScript is designed to display various visual elements on a chart to help traders track session activity within the lower time frames, specifically for the USA main session. Here's a breakdown of the script's functionality:
Session Tracking
The script tracks the USA main session, defined as 9:30 AM to 4:00 PM ET, Monday through Friday.
Visual Elements
The script displays various visual elements, including:
1. Session Open and Close Lines: Lines marking the open and close of the USA main session.
2. Session High and Low Lines: Lines marking the high and low of the USA sessions.
3. Active Session Bar: A Realtime Candle as the current session bar.
4. Overnight Session Bar: A Realtime Candle as the overnight session bar.
5. Session Timer: A label displaying the time left until the next session.
6. Background Colors: Colors indicating different session periods, such as pre-market, post-market, and active session.
Customization
The script allows users to customize various aspects, including:
1. Session Time: Users can adjust the session time.
2. Colors: Users can choose colors for different visual elements.
3. Display Options: Users can toggle the display of various visual elements.
Overall, this script provides a educational tool for traders to track session activity and visualize key market data.

SessionsThis is an advanced level sessions indicator.
Not so much an indicator, more of an auto way of plotting levels rather than drawing levels by hand every day.
It maps out the London and New York Sessions.
It also maps out the closing time and price for future reference.
Daily high and low of the past few days are laid out.
Each setting can be turned on and off in the settings if you don't require that session info.
The time settings are setup according to NY time. It should work straight without any modifications.
If you are a price action trader using sessions, this indicator will help you track price movement between sessions and give you possible support and resistance levels based on the previous session close.
This indicator does require allot of sessions based trading knowledge but if you understand it, it can be of major use to you.
Best used on GBP and USD currency pairs
Best timeframes 5Min - 1Hour
Best trading style would be day trading

Session S/RThis indicator marks the resistances and supports of the post, pre and market sessions of the previous day projecting up to the market of the day, also it marks the hours of these three markets allowing to identify the beginning and end of the sessions in London, Hong Kong, and America.

SessionsA very simple indicator that draws vertical lines on the chart to visually indicate session boundaries. You can set any target timeframe that is larger than the current one and is a multiple of it.
--
Очень простой индикатор, который строит вертикальные линии на графике, чтобы визуально указать границы сессий. Можно задавать любой целевой таймфрейм, который больше текущего и кратен ему.
Sessions [Plug&Play]This indicator automatically highlights the three major FX trading sessions—Asia, London, and New York—on your chart and, at the close of each session, draws right-extended horizontal rays at that session’s high and low. It’s designed to help you visually identify when price is trading within each session’s range and to quickly see where the highest and lowest prices occurred before the next major session begins.
Key Features:
Session Boxes
Draws a semi-transparent box around each session’s timeframe (Asia, London, New York) based on your local UTC offset.
Each box dynamically expands in real time: as new candles form during the session, the box’s top and bottom edges update to match the highest high and lowest low seen so far in that session.
When the session ends, the box remains on your chart, anchored to the exact candles that formed its boundaries.
High/Low Rays
As soon as a session closes (e.g., London session ends at 17:00 UTC+0 by default), two horizontal rays are drawn at that session’s final high and low.
These rays are “pinned” to the exact candles where the high/low occurred, so they stay in place when you scroll or zoom.
Each ray extends indefinitely to the right, providing a clear reference of the key supply/demand levels created during that session.
Session Labels
Optionally places a small “London,” “New York,” or “Asia” label at the top edge of each completed session’s box.
Labels are horizontally centered within the session’s box and use a contrasting, easy-to-read font color.
Customizable Appearance
Show/Hide Each Session: Toggle display of London, New York, and Asia sessions separately.
Time Ranges: By default, London is 08:00–17:00 (UTC), New York is 13:00–22:00 (UTC), and Asia is 00:00–07:00 (UTC). You can override each session’s start/end times using the “Time Range” picker.
Color & Opacity: Assign custom colors to each session. Choose a global “Dark,” “Medium,” or “Light” opacity preset to adjust box fill transparency and border shading.
Show/Hide Labels & Outlines: Turn the text labels and the box borders on or off independently.
UTC Offset Support
If your local broker feed or price data is not in UTC, simply adjust the “UTC Offset (+/–)” input. The indicator will recalculate session start/end times relative to your chosen offset.
How to Use:
Add the Indicator:
Open TradingView’s Pine Editor, paste in this script, and click “Add to Chart.”
By default, you’ll see three translucent boxes appear once each session begins (Asia, London, New York).
Watch in Real Time:
As soon as a session starts, its box will appear anchored to the first candle. The top and bottom of the box expand if new extremes occur.
When the session closes, the final box remains visible and two horizontal rays mark that session’s high and low.
Analyze Key Levels:
Use the high- and low-level rays to gauge session liquidity zones—areas where stop orders, breakouts, or reversals often occur.
For example, if London’s high is significantly above current price, it may act as resistance in the New York session.
Customize to Your Needs:
Toggle specific sessions on/off (e.g., if you only care about London and New York).
Change each session’s color to match your chart theme.
Adjust the “UTC Offset” so sessions align with your local time.
Disable labels or box borders if you prefer a cleaner look.
Inputs Overview:
Show London/New York/Asia Session (bool): Show or hide each session’s box and its high/low rays.
Time Range (session): Defines the start/end of each session in “HHMM–HHMM” (24h) format.
Colour (color): Custom color for each session’s box fill, border, and high/low rays.
Show Session Labels (bool): Toggle the “London,” “New York,” “Asia” text that appears at the top of each completed box.
Show Range Outline (bool): Toggle the box border (if off, only a translucent fill is drawn).
Opacity Preset (Dark/Medium/Light): Controls transparency of box fill and border.
UTC Offset (+/–) (int): Adjusts session times for different time zones (e.g., +1 for UTC+1).
Why It’s Useful:
Quickly Identify Session Activity: Visually distinguish when each major trading session is active, then compare price action across sessions.
Pinpoint High/Low Liquidity Levels: Drawn rays highlight where the market hit its extremes—critical zones for stop orders or breakout entries.
Multi-Timeframe Context: By seeing historical session boxes and rays, you can locate recurring supply/demand areas, overlap zones, or session re-tests.
Fully Automated Workflow: Once added to your chart, the script does all the work of tracking session boundaries and drawing high/low lines—no manual box or line drawing necessary.
Example Use Cases:
London Breakout Traders: See where London’s high/low formed, then wait for price to revisit those levels during the New York session.
Range Breakout Strategies: If price consolidates inside the London box, use the boxed extremes as immediate targets for breakout entries.
Intraday Liquidity Swings: During quieter hours, watch Asia’s high/low to identify potential support/resistance before London’s opening.
Overlap Zones: Compare London’s range with Asia’s range to find areas of confluence—high-probability reversal or continuation zones.

Session VWAPS [QuantVue]The Session VWAPS indicator is a designed for traders to enhance their trading analysis by incorporating Volume Weighted Average Price (VWAP) anchored to custom-defined trading sessions.
This indicator automatically plots VWAPs at three critical points of a user defined session:
🔹session start
🔹session high
🔹session low
Additionally, it provides the option to display the VWAPs from previous sessions, offering a look at potential areas of support and resistance.
Anchored VWAP, or Anchored Volume-Weighted Average Price, is a technical analysis tool used to determine the average price of a stock weighted by volume, starting from a specific point in time chosen by the analyst.
Unlike traditional VWAP, which starts at the beginning of the trading session, the anchored VWAP allows traders to select any point on the chart, such as a significant event, price low, high, or a breakout, to begin the calculation.
VWAP incorporates price and volume in a weighted average and can be used to identify areas of support and resistance on the chart.
Indicator Features:
Custom Session Definition:
Users can define their own trading sessions by specifying start and end times, allowing for tailored analysis according to individual trading strategies or market hours.
Anchored VWAP at Three Key Points:
🔹Session Start VWAP: This VWAP is anchored at the start of the defined session.
🔹Session High VWAP: Anchored at the highest price point within the session.
🔹Session Low VWAP: Anchored at the lowest price point within the session.
Previous Session VWAPs:
The indicator can display VWAPs from the previous session, allowing traders to spot potential areas of support and resistance.
Give this indicator a BOOST and COMMENT your thoughts below!
We hope you enjoy.
Cheers!

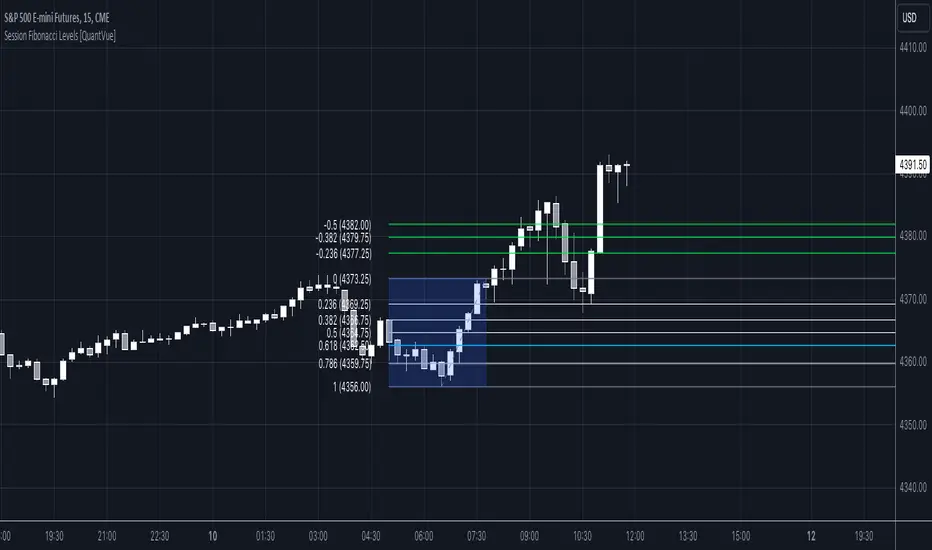
Session Fibonacci Levels [QuantVue]The "Session Fibonacci Levels" indicator is a powerful tool designed for traders who aim to use Fibonacci retracement and extension levels in their trading strategy.
The indicator combines Fibonacci levels with customized trading sessions, allowing traders to observe and utilize Fibonacci levels that are automatically calculated for each defined session.
This approach offers a dynamic and session-relevant perspective on potential support and resistance levels, which can be crucial for intraday trading strategies.
🔹The indicator calculates Fibonacci retracement and extension levels based on the high and low prices of a specified trading session, dynamically adjusting to the location of the high and low bar.
If the low of the session occurs before the high, the fib levels are measured from low to high.
If the low of the session occurs after the high, the fib levels are measured from high to low.
🔹Users can set their time zone and define trading sessions, allowing for flexibility and applicability across global markets. This is particularly beneficial for traders who focus on specific market hours like the London or New York sessions.
Important sessions:
New York (8:00am - 5:00pm EST)
London (3:00am - 12:00pm EST)
Asia (7:00pm - 4:00am EST)
Custom session (user defined session in indicator settings)
🔹The indicator dynamically updates Fibonacci levels as new highs and lows are made within the session, keeping the analysis current. Additionally, it provides alerts when prices hit key Fibonacci levels, aiding in timely decision-making.
How to Use:
Configure the time zone and session time
Once the session begins, the indicator will begin highlighting the session range
When the session ends, Fibonacci levels based on the high and low of the session will be drawn
Use these levels to identify potential support and resistance areas
Session Highs and Lows🔑 Key Levels: Session Liquidity & Structure Mapper
The Key Levels indicator is an essential tool for traders as it automatically plots and projects critical Highs and Lows established during key trading sessions. These levels represent major liquidity pools and define the current market structure, serving as high-probability targets, support, or resistance for the remainder of the trading day.
⚙️ Core Functionality
The indicator operates in two distinct modes, tailored for different asset classes:
1. Asset Class Mode (Toggle)
You can switch between two predefined setups depending on the asset you are trading:
Stock Mode (RTH/ETH): Designed for US stocks and futures (e.g., NQ, ES, YM). It tracks and projects levels for Regular Trading Hours (RTH) (09:30-16:00) and Extended Hours (ETH) (16:00-09:30).
Forex/Default Mode (Asia/London/NY): Designed for global markets (e.g., currency pairs). It tracks and projects levels for the three major liquidity sessions: Asia (19:00-03:00), London (03:00-09:30), and New York (09:30-16:00).
🗺️ Key Levels Mapped
The script continuously tracks and plots the most significant structural levels:
Current Session High/Low: The running high and low of the currently active session.
Previous Session High/Low: The confirmed high and low from the most recently completed session. These are often targeted by market makers.
Previous Day High/Low (PDH/PDL): The high and low of the prior 24-hour day, acting as major structural boundaries and a crucial macro market filter.
🎛️ Advanced Liquidity Management
The indicator is built with specific controls for high-level liquidity analysis:
Extend Through Sweeps (Critical Setting):
OFF (Recommended): The projected line is automatically stopped or deleted the moment the price candle wicks or closes past it. This visually confirms that the liquidity at that level has been "swept" or "mitigated."
ON: The line extends indefinitely, treating the level as simple support/resistance, regardless of interaction.
Previous vs. Current View: You can select a checkbox (e.g., Use PREVIOUS London Level) to hide the current session's running levels and only display the static, confirmed high/low from the prior completed session. This helps declutter the chart and focus only on the confirmed structural levels.
Show Older History: Toggle to keep lines from prior days visible, allowing you to track multi-day structural context.
🎯 Trading Application
The lines plotted by the Key Levels indicator provide immediate, actionable information:
Bias Filter: Use the PDH/PDL to determine the overall market context. Trading above the PDH suggests a bullish bias, while trading below the PDL suggests a bearish bias.
Manipulation/Entry: Wait for price to aggressively sweep a Previous Session High/Low (line stops extending). This often signals a liquidity grab or "manipulation" phase. Look for entries in the opposite direction for the main move (Distribution).
Targets: Key levels (especially unmitigated ones) serve as excellent, objective take-profit targets for active trades.

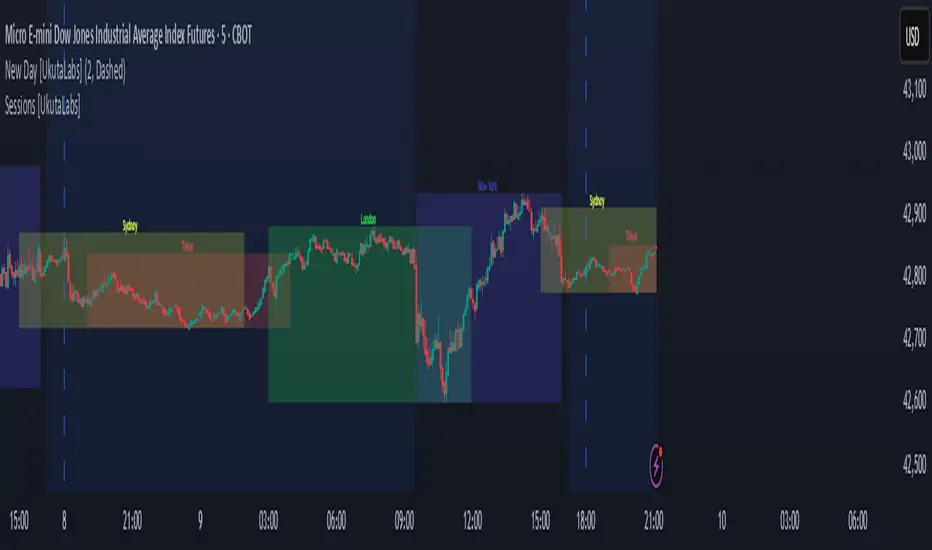
Sessions [UkutaLabs]█ OVERVIEW
Sessions is a trading toolkit that displays the different trading sessions on your chart during a trading day. By default, Sessions displays the four standard trading sessions; New York, Tokyo, London, and Sydney.
Each of the four sessions can be toggled, and the Sessions indicator is completely customizable, allowing users to define their own sessions to be generated by the script.
The aim of this script is to improve the trading experience of users by automatically displaying information about each default or custom session to the user.
█ USAGE
This script will automatically detect and label different market sessions. By default, the script will identify the four standard trading sessions, but each of these can be toggled off in the settings.
However, users are not limited to these four trading sessions and have the ability to define their own sessions to be identified by the script. When a session begins, the script will automatically start outlining the market data of that session, including the high and low of the period that is represented by the session.
If the market is within two or more sessions at the same time, then each session will be treated individually and will overlap with each other.
The sessions will be identified as a colored box surrounding the market data of the period that it represents, and a label will be displayed above the box to identify the session that it represents. The label, color and period of each session is completely customizable.
The user can also adjust all sessions at once to account for timezones in the settings.
█ SETTINGS
Session 1
• Session 1: Determines whether or not this session will be drawn by the script.
• A string field to determine the name of the session that will be displayed above the session range.
• Two time fields representing the start and finish of the session.
• A color field to determine the color of the range and label.
Session 2
• Session 2: Determines whether or not this session will be drawn by the script.
• A string field to determine the name of the session that will be displayed above the session range.
• Two time fields representing the start and finish of the session.
• A color field to determine the color of the range and label.
Session 3
• Session 3: Determines whether or not this session will be drawn by the script.
• A string field to determine the name of the session that will be displayed above the session range.
• Two time fields representing the start and finish of the session.
• A color field to determine the color of the range and label.
Session 4
• Session 4: Determines whether or not this session will be drawn by the script.
• A string field to determine the name of the session that will be displayed above the session range.
• Two time fields representing the start and finish of the session.
• A color field to determine the color of the range and label.
Time Zones
• UTC +/-: Determines the offset of each session. Enter - before the number to represent a negative offset.