Scout Regiment - D17# Scout Regiment - D17 Indicator
## English Documentation
### Overview
Scout Regiment - D17 is a comprehensive TradingView indicator that combines multiple technical analysis tools into one powerful overlay indicator. It provides traders with market structure analysis, divergence detection, volume profiling, smart money concepts, and session analysis.
### Key Features
#### 1. **EMA (Exponential Moving Averages)**
- **Purpose**: Trend identification and dynamic support/resistance levels
- **Configuration**: 13 customizable EMAs with adjustable periods
- **Default Active EMAs**: EMA 3 (21), EMA 5 (55), EMA 7 (144), EMA 8 (233)
- **Uses**: Identify trend direction, entry/exit points, and trend strength
- **Color Coding**: Different colors for easy visual distinction
#### 2. **TFMA (Timeframe Moving Averages)**
- **Purpose**: Multi-timeframe trend analysis
- **Features**:
- 3 EMAs on higher timeframes
- Dynamic labels showing trend direction
- Price difference percentage display
- Customizable timeframe settings
- **Default Settings**: 21-period timeframe with lengths 55, 144, and 233
- **Benefits**: Align trades with higher timeframe trends
#### 3. **DFMA (Daily Frame Moving Averages)**
- **Purpose**: Daily timeframe perspective on any chart
- **Features**: Similar to TFMA but specifically for daily analysis
- **Default Timeframe**: 1D (Daily)
- **Use Case**: Long-term trend confirmation and positioning
#### 4. **PMA (Price Moving Averages)**
- **Purpose**: Price channel analysis with filled areas
- **Configuration**: 7 customizable moving averages with fill zones
- **Default Lengths**: 12, 144, 169, 288, 338, 576, 676
- **Visual**: Color-filled zones between selected MAs for channel trading
#### 5. **VWAP (Volume Weighted Average Price)**
- **Purpose**: Institutional trading levels and fair value
- **Features**:
- Multiple anchor periods (Session, Week, Month, Quarter, Year, etc.)
- Standard deviation bands
- Corporate event anchoring (Earnings, Dividends, Splits)
- **Use Case**: Identify institutional support/resistance and mean reversion opportunities
#### 6. **Divergence Detector**
- **Purpose**: Identify potential trend reversals
- **Supported Indicators**: MACD, MACD Histogram, RSI, Stochastic, CCI, Williams %R, Bias, Momentum, OBV, SOBV, VWmacd, CMF, MFI, and external indicators
- **Divergence Types**:
- Regular Bullish/Bearish
- Hidden Bullish/Bearish
- **Features**:
- Automatic divergence line drawing
- Customizable detection parameters
- Color-coded alerts
#### 7. **Volume Profile & Node Detection**
- **Purpose**: Identify key price levels based on volume distribution
- **Features**:
- Volume Profile with POC (Point of Control)
- Value Area High (VAH) and Value Area Low (VAL)
- Peak and trough volume node detection
- Highest/lowest volume node highlighting
- **Lookback**: Configurable (default 377 bars)
- **Use Case**: Identify support/resistance zones and liquidity areas
#### 8. **Smart Money Concepts**
- **Purpose**: Track institutional trading patterns
- **Features**:
- Market Structure (BOS - Break of Structure, CHoCH - Change of Character)
- Internal and Swing structures
- Strong/Weak Highs and Lows
- Equal Highs/Lows detection
- Fair Value Gaps (FVG)
- **Modes**: Historical or Present (latest only)
- **Use Case**: Trade with institutional flow
#### 9. **Trading Sessions**
- **Purpose**: Analyze market behavior during different global sessions
- **Available Sessions**:
- Asian Session
- Sydney, Tokyo, Shanghai, Hong Kong
- European Session
- London, New York, NYSE
- **Features**:
- Session boxes with high/low visualization
- Real-time countdown timers
- Volume and price change tracking
- Information table with session statistics
- **Customization**: Choose which sessions to display, colors, and box styles
### How to Use
#### For Trend Following:
1. Enable EMAs 3, 5, 7, and 8
2. Use TFMA for higher timeframe confirmation
3. Look for price above/below key EMAs for trend direction
4. Use VWAP as additional confirmation
#### For Reversal Trading:
1. Enable Divergence Detector with MACD Histogram and Bias
2. Look for divergences at key support/resistance levels
3. Confirm with Smart Money CHoCH signals
4. Use Volume Profile nodes as entry/exit targets
#### For Intraday Trading:
1. Enable Trading Sessions
2. Focus on high-volume sessions (London, New York overlap)
3. Use session highs/lows as support/resistance
4. Trade Fair Value Gaps during active sessions
#### For Swing Trading:
1. Use DFMA for daily trend
2. Enable PMA for channel identification
3. Look for price reactions at volume profile value areas
4. Confirm with swing structure breaks
### Best Practices
1. **Don't Overcrowd**: Enable only the components you need for your strategy
2. **Multi-Timeframe Analysis**: Always check higher timeframe TFMA/DFMA
3. **Confluence**: Look for multiple signals confirming the same direction
4. **Volume Confirmation**: Use Volume Profile to validate price action
5. **Session Awareness**: Be aware of which session is active for volatility expectations
### Performance Optimization
- Disable unused features to improve chart loading speed
- Use "Present Mode" for Smart Money Concepts if historical data isn't needed
- Reduce Volume Profile lookback period on slower devices
### Alerts
The indicator includes alert conditions for:
- All divergence types (8 conditions)
- Smart Money structure breaks (8 conditions)
- Equal highs/lows detection
- Fair Value Gaps formation
---
## 中文说明文档
### 概述
Scout Regiment - D17 是一款综合性TradingView指标,将多个技术分析工具整合到一个强大的叠加指标中。它为交易者提供市场结构分析、背离检测、成交量分析、聪明钱概念和时区分析。
### 核心功能
#### 1. **EMA(指数移动平均线)**
- **用途**:趋势识别和动态支撑阻力位
- **配置**:13条可自定义周期的EMA
- **默认启用**:EMA 3(21)、EMA 5(55)、EMA 7(144)、EMA 8(233)
- **应用**:识别趋势方向、进出场点位和趋势强度
- **颜色编码**:不同颜色便于视觉区分
#### 2. **TFMA(时间框架移动平均线)**
- **用途**:多时间框架趋势分析
- **特点**:
- 3条更高时间框架的EMA
- 显示趋势方向的动态标签
- 价格差异百分比显示
- 可自定义时间框架设置
- **默认设置**:21周期时间框架,长度为55、144和233
- **优势**:使交易与更高时间框架趋势保持一致
#### 3. **DFMA(日线框架移动平均线)**
- **用途**:在任何图表上提供日线时间框架视角
- **特点**:与TFMA类似,但专门用于日线分析
- **默认时间框架**:1D(日线)
- **使用场景**:长期趋势确认和定位
#### 4. **PMA(价格移动平均线)**
- **用途**:价格通道分析与填充区域
- **配置**:7条可自定义的移动平均线,带填充区域
- **默认长度**:12、144、169、288、338、576、676
- **视觉效果**:选定MA之间的彩色填充区域,用于通道交易
#### 5. **VWAP(成交量加权平均价格)**
- **用途**:机构交易水平和公允价值
- **特点**:
- 多个锚定周期(交易日、周、月、季度、年等)
- 标准差波段
- 企业事件锚定(财报、分红、拆股)
- **使用场景**:识别机构支撑阻力和均值回归机会
#### 6. **背离检测器**
- **用途**:识别潜在趋势反转
- **支持指标**:MACD、MACD柱状图、RSI、随机指标、CCI、威廉指标、乖离率、动量、OBV、SOBV、VWmacd、CMF、MFI及外部指标
- **背离类型**:
- 常规看涨/看跌背离
- 隐藏看涨/看跌背离
- **特点**:
- 自动绘制背离连线
- 可自定义检测参数
- 颜色编码警报
#### 7. **成交量分布与节点检测**
- **用途**:基于成交量分布识别关键价格水平
- **特点**:
- 成交量分布图与POC(控制点)
- 价值区域高点(VAH)和低点(VAL)
- 峰值和低谷成交量节点检测
- 最高/最低成交量节点突出显示
- **回溯期**:可配置(默认377根K线)
- **使用场景**:识别支撑阻力区域和流动性区域
#### 8. **聪明钱概念**
- **用途**:追踪机构交易模式
- **特点**:
- 市场结构(BOS-突破结构、CHoCH-结构转变)
- 内部和摆动结构
- 强/弱高低点
- 等高/等低检测
- 公允价值缺口(FVG)
- **模式**:历史模式或当前模式(仅最新)
- **使用场景**:跟随机构资金流动交易
#### 9. **交易时区**
- **用途**:分析不同全球时段的市场行为
- **可用时段**:
- 亚洲时段
- 悉尼、东京、上海、香港
- 欧洲时段
- 伦敦、纽约、纽交所
- **特点**:
- 时段方框显示高低点
- 实时倒计时
- 成交量和价格变化追踪
- 时段统计信息表格
- **自定义**:选择显示哪些时段、颜色和方框样式
### 使用方法
#### 趋势跟随策略:
1. 启用EMA 3、5、7和8
2. 使用TFMA进行更高时间框架确认
3. 观察价格在关键EMA上方/下方确定趋势方向
4. 使用VWAP作为额外确认
#### 反转交易策略:
1. 启用背离检测器(MACD柱状图和乖离率)
2. 在关键支撑阻力位寻找背离
3. 用聪明钱CHoCH信号确认
4. 使用成交量分布节点作为进出场目标
#### 日内交易策略:
1. 启用交易时区
2. 关注高成交量时段(伦敦、纽约重叠时段)
3. 使用时段高低点作为支撑阻力
4. 在活跃时段交易公允价值缺口
#### 波段交易策略:
1. 使用DFMA确定日线趋势
2. 启用PMA识别通道
3. 观察价格在成交量分布价值区域的反应
4. 用摆动结构突破确认
### 最佳实践
1. **避免过度拥挤**:仅启用策略所需的组件
2. **多时间框架分析**:始终检查更高时间框架的TFMA/DFMA
3. **汇合点**:寻找多个信号确认同一方向
4. **成交量确认**:使用成交量分布验证价格行为
5. **时段意识**:了解当前活跃时段以预期波动性
### 性能优化
- 禁用未使用的功能以提高图表加载速度
- 如果不需要历史数据,对聪明钱概念使用"当前模式"
- 在较慢设备上减少成交量分布回溯期
### 警报
指标包含以下警报条件:
- 所有背离类型(8个条件)
- 聪明钱结构突破(8个条件)
- 等高/等低检测
- 公允价值缺口形成
---
## Technical Support
For questions or issues, please refer to the TradingView community or contact the indicator creator.
## 技术支持
如有问题,请参考TradingView社区或联系指标创建者。
ابحث في النصوص البرمجية عن "session"

MNQ Morning Indicator | Clean SignalsMNQ Morning Trading Indicator Summary
What It Does
This is a TradingView indicator designed for day trading MNQ (Micro Nasdaq-100 futures) during morning sessions. It generates BUY and SELL signals only when multiple technical conditions align, helping traders identify high-probability trade setups.
Core Strategy
BUY Signal Requirements (All must be true):
✅ Price above VWAP (volume-weighted average price)
✅ Fast EMA (9) above Slow EMA (21) - uptrend confirmation
✅ Price above 15-minute 50 EMA - higher timeframe confirmation
✅ MACD histogram positive - momentum confirmation
✅ RSI above 55 - strength confirmation
✅ ADX above 25 - trending market (not choppy)
✅ Volume 1.5x above average - strong participation
SELL Signal (opposite conditions)
Key Features
🎯 Risk Management
Stop Loss: 2× ATR (Average True Range)
Take Profit 1: 2× ATR (1:2 risk-reward)
Take Profit 2: 3× ATR (1:3 risk-reward)
Dollar values: Calculates P&L based on MNQ's $2/point value
⏰ Session Filter
Default: 9:30 AM - 11:30 AM ET (customizable)
Safety feature: Avoids first 15 minutes (high volatility period)
Won't generate signals outside trading hours
🛡️ Signal Quality
Rates each signal: 🔥 STRONG, ⚡ MEDIUM, or ⚠️ WEAK
Requires minimum 15 bars between signals (prevents overtrading)
📊 Visual Dashboard
Shows real-time metrics:
ATR values
ADX (trend strength)
RSI (momentum)
Market condition (TREND/CHOP)
Session status
Volume status
Signal cooldown timer
Visual Elements
📈 VWAP with standard deviation bands (1σ, 2σ, 3σ)
📉 Multiple EMAs with trend-based coloring
🟢/🔴 Buy/Sell arrows on chart
📋 Detailed trade labels showing entry, SL, TPs, and risk-reward ratios
🎨 Background highlighting for market conditions
Safety Features
Cooldown period between signals
Session restrictions (no trading outside set hours)
First 15-minute avoidance (post-open volatility)
Multi-confirmation requirement (all 7 conditions must align)
Trend filter (ADX minimum to avoid choppy markets)
Best For
Day traders focused on morning sessions
MNQ futures traders
Traders who prefer systematic, rule-based entries
Those wanting pre-calculated risk management levels
Customization
All parameters are adjustable:
EMA periods
MACD settings
RSI thresholds
ADX minimum
ATR multipliers
Session times
Visual preferences
This indicator is designed to be conservative — it waits for strong confirmation before signaling, which means fewer but potentially higher-quality trades.

Intraday Buy/Sell/Average Zones by Chaitu50cIntraday Buy/Sell/Average Zones by chaitu50c
Timeframe:
Tested on the 5-minute chart.
Recommended timeframe: 5-minute
What it does
This indicator marks intraday Buy (green) and Sell (red) zones made by strong close-confirmed breakouts. These zones act as support/resistance. If price later closes through a zone, the zone changes color from that bar forward (support ↔ resistance). It can flip more than once.
How zones form
Single breakout: an opposite-type candle closes beyond the previous candle’s high/low.
Double breakout: a base candle, then two opposite-type candles, and the second one closes beyond the base high/low.
Zone size
Buy zone: from the combo lowest low up to the nearest open/close of the combo.
Sell zone: from the combo highest high down to the nearest open/close of the combo.
Color shift (optional)
If price closes through a zone, it flips color at that bar and behaves as the other side (support ↔ resistance). Flips can happen again later.
Overlap control
When a new zone overlaps an existing same-color zone in the same session, choose:
Merge (combine), or
Suppress (ignore the new one).
Flipped zones use their current color for this.
Right edge & session
All zones extend to the right (your offset). Detection is limited to your chosen session, and you can show only the last N sessions.
---
How to trade (simple)
A) Initial breakout trade
When a new zone forms, that breakout itself can be a trade idea in the breakout direction, The stoploss will be the zone.
B) Zone breakout trade (flip)
If price later closes out of a zone and it changes color, that breakout is another trade opportunity in the new direction.
C) Retrace & average trade
When price retests a zone, wait for a confirmation candle in the zone’s favor
— bullish close for a green zone, bearish close for a red zone — then average entries inside/near the zone.
Place stops just beyond the opposite edge of the zone.
If the zone flips color, stop averaging; bias changed.
---
Key settings
Breakout type: Single and/or Double
Confirm on Close: strict mode (no intrabar preview) or allow intrabar preview that auto-removes if fail
Color Shift on Breaks: on/off
Same-Type Overlap: Merge/Suppress
Session, Sessions to Display, Right Offset, Colors, Max Zones
Reminder: Best results on the 5-minute timeframe (tested and recommended).

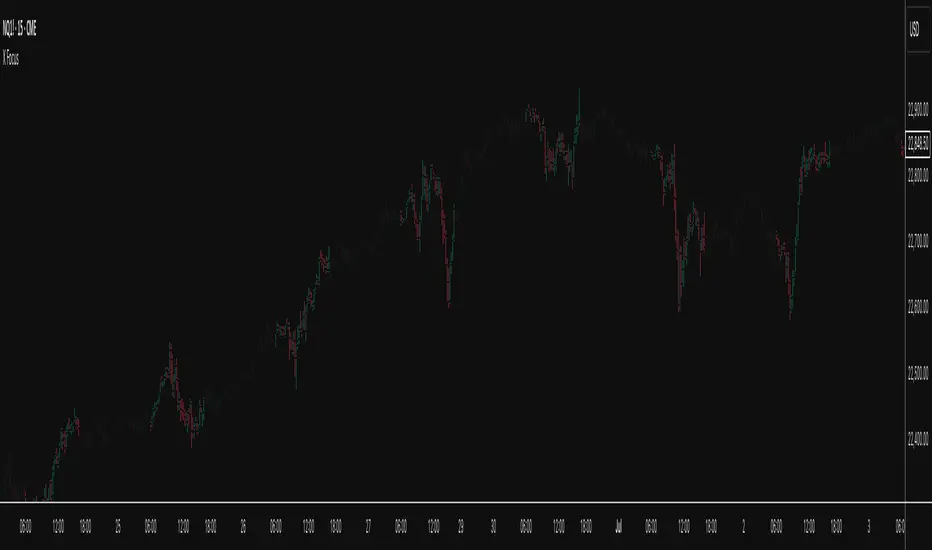
X FocusDesigned to help traders reduce distractions by de-emphasizing specific time ranges on the chart. Instead of highlighting high-activity zones, this tool intentionally applies a muted overlay to selected sessions, allowing traders to concentrate on price action that occurs outside those designated ranges.
Core Purpose
The primary goal of this indicator is to combat the “noise” that often arises during certain periods, such as overnight sessions or pre-market trading. By visually softening those areas, traders can focus on the more relevant trading windows WITHOUT losing any time-based context. Unlike traditional tools that remove data entirely, X Focus preserves all candlestick and price information—ensuring that key levels, gaps, or reference values are still visible.
Key Features
Custom Session Filtering
Users can define up to three time ranges depending on preference. This flexibility allows for tailoring the indicator to different market strategies.
De-Emphasis by Design
Instead of masking or deleting data, the indicator overlays a semi-transparent shading box over the chosen sessions. This ensures traders remain aware of the data while maintaining visual focus on the price action outside of the selected time blocks.
Dual Utility – Highlight or Suppress
While built on the principle of minimizing distractions, the same framework can also be used in reverse to highlight specific areas of interest. This versatility makes it suitable for both noise-reduction and spotlighting critical ranges.
Dark Mode / Light Mode
Adjustable color schemes allow seamless integration into any chart setup, whether the user prefers dark or light backgrounds.
Non-Intrusive Visualization
The shading effect is applied without altering price bars, indicators, or other overlays. This ensures compatibility with existing technical tools and strategies.
Use Case
Traders who find themselves reacting too strongly to inconsequential movements during certain times (such as after-hours or low-volume sessions) can benefit from the X Focus indicator. It helps maintain clarity and discipline by visually guiding attention toward the periods that matter most—without erasing or ignoring potentially useful price references.
Previous Two Days HL + Asia H/L + 4H Vertical Lines📊 Indicator Overview
This custom TradingView indicator visually marks key market structure levels and session data on your chart using lines, labels, boxes, and vertical guides. It is designed for traders who analyze intraday and multi-session behavior — especially around the New York and Asia sessions — with a focus on 4-hour price ranges.
🔍 What the Indicator Tracks
1. Previous Two Days' Ranges (6PM–5PM NY Time)
PDH/PDL (Day 1 & Day 2): Draws horizontal lines marking the previous two trading days’ highs and lows.
Midlines: Calculates and displays the midpoint between each day’s high and low.
Color-Coded: Uses strong colors for Day 1 and more transparent versions for Day 2, to help differentiate them.
2. Asia Session High/Low (6 PM – 2 AM NY Time)
Automatically tracks the high and low during the Asia session.
Extends these levels until the following day’s NY close (4 PM).
Shows a midline of the Asia session (optional dotted line).
Highlights the Asia session background in gray.
Labels Asia High and Low on the chart for easy reference.
3. Last Closed 4-Hour Candle Range
At the start of every new 4H candle, it:
Draws a box from the last closed 4H candle.
Box spans horizontally across a set number of bars (adjustable).
Top and bottom lines indicate the high and low of that 4H candle.
Midline, 25% (Q1) and 75% (Q3) levels are also drawn inside the box using dotted lines.
Helps traders identify premium/discount zones within the previous 4H range.
4. Vertical 4H Time Markers
Draws vertical dashed lines to mark the start and end of the last 4H candle range.
Based on the standard 4H bar timing in NY (e.g. 5:00, 9:00, 13:00, 17:00).
⚙️ Inputs & Options
Line thickness, color customization for all levels.
Option to place labels on the right or left side of the chart.
Toggle for enabling/disabling the 4H box.
Adjustable box extension length (how far to extend the range visually).
✅ Ideal Use Cases
Identifying reaction zones from prior highs/lows.
Spotting reversals during Asia or NY session opens.
Trading intraday setups based on 4H structure.
Anchoring scalping or swing entries off major session levels.

ICT TIME ELEMENTS [KaninFX]## Overview
The ICT Time Elements indicator is a comprehensive trading tool designed to visualize the most critical market sessions and timeframes according to Inner Circle Trader (ICT) methodology. This indicator helps traders identify high-probability trading opportunities by highlighting key market sessions, killzones, and liquidity periods throughout the trading day.
## Key Features
### 🕐 Complete ICT Time Framework
- **Asian Range**: 8:00 PM - 12:00 AM (NY Time) - Evening consolidation period
- **London Killzone**: 2:00 AM - 5:00 AM (NY Time) - European market opening liquidity
- **NY Killzone**: 7:00 AM - 10:00 AM (NY Time) - US market opening with high volatility
- **Silver Bullet Sessions**:
- London Silver Bullet: 3:00 AM - 4:00 AM
- AM Silver Bullet: 10:00 AM - 11:00 AM
- PM Silver Bullet: 2:00 PM - 3:00 PM
- **Lunch Hours**: 5:00 AM - 7:00 AM & 12:00 PM - 1:00 PM (Lower volatility periods)
- **News Embargo**: 8:30 AM - 9:30 AM (High impact news release window)
- **20-Minute Macros**: :50 to :10 minutes of each hour (Short-term reversal periods)
- **True Day Close**: 4:00 PM - 4:30 PM (Official market close)
### 🎨 Visual Customization
- **Multiple Themes**: Dark, Light, and Custom color schemes
- **Adjustable Opacity**: Control zone transparency (0-100%)
- **Font Customization**: Tiny, Small, Normal, Large text sizes
- **Custom Colors**: Personalize each zone with your preferred colors
- **Professional Display**: Clean histogram visualization with zone labels
### 🌍 Multi-Timezone Support
Built-in support for major trading centers:
- America/New_York (Default)
- America/Chicago
- America/Los_Angeles
- Europe/London
- Asia/Tokyo
- Asia/Shanghai
- Australia/Sydney
### 📊 Smart Information Display
- **Real-time Zone Detection**: Automatically identifies current active session
- **Zone Labels**: Clear labeling at the center of each time period
- **Current Zone Indicator**: Arrow pointer showing the active session
- **Comprehensive Info Table**: Quick reference for all time zones and their schedules
- **Flexible Table Positioning**: Place info table in any corner of your chart
### ⚡ Performance Optimized
- **Memory Management**: Automatic cleanup of old labels to maintain performance
- **Efficient Processing**: Optimized time calculations for smooth operation
- **Resource Control**: Limited label generation to prevent system overload
## How It Works
The indicator continuously monitors the current time against predefined ICT session schedules. When price action enters a recognized time zone, the indicator:
1. **Highlights the Period**: Colors the histogram bar according to the active session
2. **Labels the Zone**: Places descriptive text identifying the current market condition
3. **Updates Info Table**: Shows current session status and complete schedule
4. **Tracks Macro Periods**: Identifies 20-minute reversal windows within major sessions
### Special Features
- **Macro Detection**: Automatically identifies when current time falls within a 20-minute macro period
- **Session Overlap Handling**: Properly manages overlapping time zones with priority logic
- **Dynamic Color Adjustment**: Theme-aware color selection for optimal visibility
## Best Use Cases
### For ICT Traders
- Identify optimal entry times during killzone sessions
- Recognize silver bullet opportunities for quick scalps
- Avoid trading during lunch hour consolidations
- Prepare for news embargo volatility
### For Session Traders
- Track major market session transitions
- Plan trading strategy around high-liquidity periods
- Understand global market flow and timing
### For Swing Traders
- Identify macro trend continuation points
- Time position entries during optimal sessions
- Understand market structure changes across sessions
## Installation & Setup
1. Add the indicator to your TradingView chart
2. Select your preferred timezone from the dropdown
3. Choose theme (Dark/Light) or customize colors
4. Adjust font size and table position to your preference
5. Enable/disable features as needed for your trading style
## Pro Tips
- **Combine with Price Action**: Use time zones alongside support/resistance levels
- **Focus on Killzones**: Highest probability setups occur during London and NY killzones
- **Watch Silver Bullets**: These 1-hour windows often provide excellent reversal opportunities
- **Respect Lunch Hours**: Lower volatility periods - consider smaller position sizes
- **News Embargo Awareness**: Prepare for potential whipsaws during 8:30-9:30 AM
## Conclusion
The ICT Time Elements indicator transforms complex ICT timing concepts into an easy-to-read visual tool. Whether you're a beginner learning ICT methodology or an experienced trader looking to optimize your timing, this indicator provides the essential market session awareness needed for successful trading.
*Compatible with all TradingView plans and timeframes. Works best on 1-minute to 1-hour charts for optimal session visualization.*

Correlation Heatmap█ OVERVIEW
This indicator creates a correlation matrix for a user-specified list of symbols based on their time-aligned weekly or monthly price returns. It calculates the Pearson correlation coefficient for each possible symbol pair, and it displays the results in a symmetric table with heatmap-colored cells. This format provides an intuitive view of the linear relationships between various symbols' price movements over a specific time range.
█ CONCEPTS
Correlation
Correlation typically refers to an observable statistical relationship between two datasets. In a financial time series context, it usually represents the extent to which sampled values from a pair of datasets, such as two series of price returns, vary jointly over time. More specifically, in this context, correlation describes the strength and direction of the relationship between the samples from both series.
If two separate time series tend to rise and fall together proportionally, they might be highly correlated. Likewise, if the series often vary in opposite directions, they might have a strong anticorrelation . If the two series do not exhibit a clear relationship, they might be uncorrelated .
Traders frequently analyze asset correlations to help optimize portfolios, assess market behaviors, identify potential risks, and support trading decisions. For instance, correlation often plays a key role in diversification . When two instruments exhibit a strong correlation in their returns, it might indicate that buying or selling both carries elevated unsystematic risk . Therefore, traders often aim to create balanced portfolios of relatively uncorrelated or anticorrelated assets to help promote investment diversity and potentially offset some of the risks.
When using correlation analysis to support investment decisions, it is crucial to understand the following caveats:
• Correlation does not imply causation . Two assets might vary jointly over an analyzed range, resulting in high correlation or anticorrelation in their returns, but that does not indicate that either instrument directly influences the other. Joint variability between assets might occur because of shared sensitivities to external factors, such as interest rates or global sentiment, or it might be entirely coincidental. In other words, correlation does not provide sufficient information to identify cause-and-effect relationships.
• Correlation does not predict the future relationship between two assets. It only reflects the estimated strength and direction of the relationship between the current analyzed samples. Financial time series are ever-changing. A strong trend between two assets can weaken or reverse in the future.
Correlation coefficient
A correlation coefficient is a numeric measure of correlation. Several coefficients exist, each quantifying different types of relationships between two datasets. The most common and widely known measure is the Pearson product-moment correlation coefficient , also known as the Pearson correlation coefficient or Pearson's r . Usually, when the term "correlation coefficient" is used without context, it refers to this correlation measure.
The Pearson correlation coefficient quantifies the strength and direction of the linear relationship between two variables. In other words, it indicates how consistently variables' values move together or in opposite directions in a proportional, linear manner. Its formula is as follows:
𝑟(𝑥, 𝑦) = cov(𝑥, 𝑦) / (𝜎𝑥 * 𝜎𝑦)
Where:
• 𝑥 is the first variable, and 𝑦 is the second variable.
• cov(𝑥, 𝑦) is the covariance between 𝑥 and 𝑦.
• 𝜎𝑥 is the standard deviation of 𝑥.
• 𝜎𝑦 is the standard deviation of 𝑦.
In essence, the correlation coefficient measures the covariance between two variables, normalized by the product of their standard deviations. The coefficient's value ranges from -1 to 1, allowing a more straightforward interpretation of the relationship between two datasets than what covariance alone provides:
• A value of 1 indicates a perfect positive correlation over the analyzed sample. As one variable's value changes, the other variable's value changes proportionally in the same direction .
• A value of -1 indicates a perfect negative correlation (anticorrelation). As one variable's value increases, the other variable's value decreases proportionally.
• A value of 0 indicates no linear relationship between the variables over the analyzed sample.
Aligning returns across instruments
In a financial time series, each data point (i.e., bar) in a sample represents information collected in periodic intervals. For instance, on a "1D" chart, bars form at specific times as successive days elapse.
However, the times of the data points for a symbol's standard dataset depend on its active sessions , and sessions vary across instrument types. For example, the daily session for NYSE stocks is 09:30 - 16:00 UTC-4/-5 on weekdays, Forex instruments have 24-hour sessions that span from 17:00 UTC-4/-5 on one weekday to 17:00 on the next, and new daily sessions for cryptocurrencies start at 00:00 UTC every day because crypto markets are consistently open.
Therefore, comparing the standard datasets for different asset types to identify correlations presents a challenge. If two symbols' datasets have bars that form at unaligned times, their correlation coefficient does not accurately describe their relationship. When calculating correlations between the returns for two assets, both datasets must maintain consistent time alignment in their values and cover identical ranges for meaningful results.
To address the issue of time alignment across instruments, this indicator requests confirmed weekly or monthly data from spread tickers constructed from the chart's ticker and another specified ticker. The datasets for spreads are derived from lower-timeframe data to ensure the values from all symbols come from aligned points in time, allowing a fair comparison between different instrument types. Additionally, each spread ticker ID includes necessary modifiers, such as extended hours and adjustments.
In this indicator, we use the following process to retrieve time-aligned returns for correlation calculations:
1. Request the current and previous prices from a spread representing the sum of the chart symbol and another symbol ( "chartSymbol + anotherSymbol" ).
2. Request the prices from another spread representing the difference between the two symbols ( "chartSymbol - anotherSymbol" ).
3. Calculate half of the difference between the values from both spreads ( 0.5 * (requestedSum - requestedDifference) ). The results represent the symbol's prices at times aligned with the sample points on the current chart.
4. Calculate the arithmetic return of the retrieved prices: (currentPrice - previousPrice) / previousPrice
5. Repeat steps 1-4 for each symbol requiring analysis.
It's crucial to note that because this process retrieves prices for a symbol at times consistent with periodic points on the current chart, the values can represent prices from before or after the closing time of the symbol's usual session.
Additionally, note that the maximum number of weeks or months in the correlation calculations depends on the chart's range and the largest time range common to all the requested symbols. To maximize the amount of data available for the calculations, we recommend setting the chart to use a daily or higher timeframe and specifying a chart symbol that covers a sufficient time range for your needs.
█ FEATURES
This indicator analyzes the correlations between several pairs of user-specified symbols to provide a structured, intuitive view of the relationships in their returns. Below are the indicator's key features:
Requesting a list of securities
The "Symbol list" text box in the indicator's "Settings/Inputs" tab accepts a comma-separated list of symbols or ticker identifiers with optional spaces (e.g., "XOM, MSFT, BITSTAMP:BTCUSD"). The indicator dynamically requests returns for each symbol in the list, then calculates the correlation between each pair of return series for its heatmap display.
Each item in the list must represent a valid symbol or ticker ID. If the list includes an invalid symbol, the script raises a runtime error.
To specify a broker/exchange for a symbol, include its name as a prefix with a colon in the "EXCHANGE:SYMBOL" format. If a symbol in the list does not specify an exchange prefix, the indicator selects the most commonly used exchange when requesting the data.
Note that the number of symbols allowed in the list depends on the user's plan. Users with non-professional plans can compare up to 20 symbols with this indicator, and users with professional plans can compare up to 32 symbols.
Timeframe and data length selection
The "Returns timeframe" input specifies whether the indicator uses weekly or monthly returns in its calculations. By default, its value is "1M", meaning the indicator analyzes monthly returns. Note that this script requires a chart timeframe lower than or equal to "1M". If the chart uses a higher timeframe, it causes a runtime error.
To customize the length of the data used in the correlation calculations, use the "Max periods" input. When enabled, the indicator limits the calculation window to the number of periods specified in the input field. Otherwise, it uses the chart's time range as the limit. The top-left corner of the table shows the number of confirmed weeks or months used in the calculations.
It's important to note that the number of confirmed periods in the correlation calculations is limited to the largest time range common to all the requested datasets, because a meaningful correlation matrix requires analyzing each symbol's returns under the same market conditions. Therefore, the correlation matrix can show different results for the same symbol pair if another listed symbol restricts the aligned data to a shorter time range.
Heatmap display
This indicator displays the correlations for each symbol pair in a heatmap-styled table representing a symmetric correlation matrix. Each row and column corresponds to a specific symbol, and the cells at their intersections correspond to symbol pairs . For example, the cell at the "AAPL" row and "MSFT" column shows the weekly or monthly correlation between those two symbols' returns. Likewise, the cell at the "MSFT" row and "AAPL" column shows the same value.
Note that the main diagonal cells in the display, where the row and column refer to the same symbol, all show a value of 1 because any series of non-na data is always perfectly correlated with itself.
The background of each correlation cell uses a gradient color based on the correlation value. By default, the gradient uses blue hues for positive correlation, orange hues for negative correlation, and white for no correlation. The intensity of each blue or orange hue corresponds to the strength of the measured correlation or anticorrelation. Users can customize the gradient's base colors using the inputs in the "Color gradient" section of the "Settings/Inputs" tab.
█ FOR Pine Script® CODERS
• This script uses the `getArrayFromString()` function from our ValueAtTime library to process the input list of symbols. The function splits the "string" value by its commas, then constructs an array of non-empty strings without leading or trailing whitespaces. Additionally, it uses the str.upper() function to convert each symbol's characters to uppercase.
• The script's `getAlignedReturns()` function requests time-aligned prices with two request.security() calls that use spread tickers based on the chart's symbol and another symbol. Then, it calculates the arithmetic return using the `changePercent()` function from the ta library. The `collectReturns()` function uses `getAlignedReturns()` within a loop and stores the data from each call within a matrix . The script calls the `arrayCorrelation()` function on pairs of rows from the returned matrix to calculate the correlation values.
• For consistency, the `getAlignedReturns()` function includes extended hours and dividend adjustment modifiers in its data requests. Additionally, it includes other settings inherited from the chart's context, such as "settlement-as-close" preferences.
• A Pine script can execute up to 40 or 64 unique `request.*()` function calls, depending on the user's plan. The maximum number of symbols this script compares is half the plan's limit, because `getAlignedReturns()` uses two request.security() calls.
• This script can use the request.security() function within a loop because all scripts in Pine v6 enable dynamic requests by default. Refer to the Dynamic requests section of the Other timeframes and data page to learn more about this feature, and see our v6 migration guide to learn what's new in Pine v6.
• The script's table uses two distinct color.from_gradient() calls in a switch structure to determine the cell colors for positive and negative correlation values. One call calculates the color for values from -1 to 0 based on the first and second input colors, and the other calculates the colors for values from 0 to 1 based on the second and third input colors.
Look first. Then leap.

Opening Candle High/Low with Time Zone and Minute Offset
Title: Opening Candle High/Low with Time Zone and Minute Offset
Description:
The Opening Candle High/Low with Time Zone and Minute Offset indicator is a versatile tool that highlights the high and low of the first candle of the trading session, adjusted for your preferred time zone and minute offset. It is particularly useful for traders who focus on opening ranges as key reference points for their trading strategies.
---
Features:
1. Time Zone and Minute Adjustment:
- Allows customization of the start time by applying a time zone offset (in hours) and a minute offset.
- Ideal for traders operating in different time zones or trading sessions that don't align with midnight UTC.
2. Dynamic First Candle Detection:
- Automatically captures the high and low of the first candle after the adjusted time.
- Resets daily, ensuring accurate levels for each new trading session.
3. Visual Representation:
- Plots the high and low levels of the first candle directly on the chart for easy reference.
- Uses distinct colors (green for the high and red for the low) and adjustable line widths for clarity.
4. Simplicity and Versatility:
- Works across all markets and timeframes, providing essential information for opening range breakout strategies, support/resistance analysis, or session-based trading.
---
How It Works:
1. Time Adjustment:
- The indicator adjusts the current chart time by applying the user-defined hour and minute offsets.
- This ensures the "opening candle" aligns with your specific trading session requirements.
2. First Candle Detection:
- When the adjusted time matches the start of a new day (midnight with offsets), the indicator captures the high and low of the first candle.
- These values are stored and remain static throughout the trading day.
3. Plotting:
- The high and low levels of the opening candle are plotted on the chart, providing visual reference points for traders.
---
Use Case:
- This indicator is ideal for traders who rely on the opening range of a session for planning trades, such as breakout or reversal strategies.
- It can also serve as a key tool for identifying significant price levels in session-based trading.
Simplify your trading analysis and align your strategy with this customizable and intuitive indicator.

Globex time (New York Time)This indicator is designed to highlight and analyze price movements within the Globex session. Primarily geared toward the Globex Trap trading strategy, this tool visually identifies the session's high and low prices, allowing traders to better assess price action during extended hours. Here’s a comprehensive breakdown of its features and functionality:
Purpose
The "Globex Time (New York Time)" indicator tracks price levels during the Globex trading session, providing a clear view of overnight market activity. This session, typically running from 6 p.m. ET (18:00) until the following morning at 8:30 a.m. ET, is a critical period where significant market positioning can occur before the regular session opens. In the Globex Trap strategy, the session high and low are essential levels, as price movements around these areas often indicate potential support, resistance, or reversal zones, which traders use to set up entries or exits when the regular trading session begins.
Key Features
Customizable Session Start and End Times
The indicator allows users to specify the exact start and end times of the Globex session in New York time. The default settings are:
Start: 6 p.m. ET (18:00)
End: 8:30 a.m. ET
These settings can be adjusted to align with specific market hours or personal preferences.
Session High and Low Identification
Throughout the defined session, the indicator dynamically calculates and tracks:
Session High: The highest price reached within the session.
Session Low: The lowest price reached within the session.
These levels are essential for the Globex Trap strategy, as price action around them can indicate likely breakout or reversal points when regular trading resumes.
Vertical Lines for Session Start and End
The indicator draws vertical lines at both the session start and end times:
Session Start Line: A solid line marking the exact beginning of the Globex session.
Session End Line: A similar vertical line marking the session’s conclusion.
Both lines are customizable in terms of color and thickness, making it easy to distinguish the session boundaries visually on the chart.
Horizontal Lines for Session High and Low
At the end of the session, the indicator plots horizontal lines representing the Globex session's high and low levels. Users can customize these lines:
Color: Define specific colors for the session high (default: red) and session low (default: green) to easily differentiate them.
Line Style: Options to set the line style (solid, dashed, or dotted) provide flexibility for visual preferences and chart organization.
Automatic Reset for Daily Tracking
To adapt to the next trading day, the indicator resets the session high and low data once the current session ends. This reset prepares it to start tracking new levels at the beginning of the next session without manual intervention.
Practical Application in the Globex Trap Strategy
In the Globex Trap strategy, traders are primarily interested in price behavior around the high and low levels established during the overnight session. Common applications of this indicator for this strategy include:
Breakout Trades: Watching for price to break above the Globex high or below the Globex low, indicating potential momentum in the breakout direction.
Reversal Trades: Monitoring for failed breakouts or traps where price tests and rejects the Globex high or low, suggesting a reversal as liquidity is trapped in these zones.
Support and Resistance Zones: Using the session high and low as key support and resistance levels during the regular trading session, with potential entry or exit points when price approaches these areas.
Additional Configuration Options
Vertical Line Color and Width: Define the color and thickness of the vertical session start and end lines to match your chart’s theme.
Upper and Lower Line Colors and Styles: Customize the appearance of the session high and low horizontal lines by setting color and line style (solid, dashed, or dotted), making it easy to distinguish these critical levels from other chart markings.
Summary
This indicator is a valuable tool for traders implementing the Globex Trap strategy. It visually segments the Globex session and marks essential price levels, helping traders analyze market behavior overnight. Through its customizable options and clear visual representation, it simplifies tracking overnight price activity and identifying strategic levels for potential trade setups during the regular session.

FluxPulse Beacon## FluxPulse Beacon
FluxPulse Beacon applies a microstructure lens to every bar, combining directional thrust, realized volatility, and multi-timeframe liquidity checks to decide whether the tape is being pushed by real sponsorship or just noise. The oscillator's color-coded columns and adaptive burst thresholds transform complex flow dynamics into a single actionable flux score for futures and equities traders.
HOW IT WORKS
Momentum Extraction – Price differentials over a configurable pulse distance are smoothed using exponential moving averages to isolate directional thrust without reacting to single prints.
Volatility + Liquidity Normalization – The momentum stream is divided by realized volatility and multiplied by both local and higher-timeframe EMA volume ratios, ensuring pulses only appear when volatility and liquidity align.
Adaptive Thresholding – A volatility-derived standard deviation of flux is blended with the base threshold so bursts scale automatically between low-volatility and high-volatility market conditions.
Divergence Engine – Linear regression slopes compare price vs. flux to tag bullish/bearish divergences, highlighting stealth accumulation or distribution zones.
HOW TO USE IT
Continuation Entries : Go with the trend when histogram bars stay above the adaptive threshold, the signal line confirms, and trend bias agrees—this is where liquidity-backed follow-through lives.
Fade Plays : Watch for divergence alerts and shrinking compression values; when flux prints below zero yet price grinds higher, hidden selling pressure often precedes rollovers.
Session Filter : Compression percentage in the diagnostics table instantly tells you whether to trade thin overnight sessions—low compression means stand down.
VISUAL FEATURES
Dynamic background heat maps flux magnitude, while threshold lines provide a quick read on whether a pulse is statistically significant.
Diagnostics table displays live flux, signal, adaptive threshold, and compression for quick reference.
Alert-first workflow: The surface is intentionally clean—bursts and divergences are delivered via alerts instead of on-chart clutter.
PARAMETERS
Trend EMA Length (default: 34): Defines the macro bias anchor; increase for higher-timeframe confirmation.
Pulse Distance (default: 8): Controls how sensitive momentum extraction becomes.
Volatility Window (default: 21): Sample window for realized volatility normalization.
Liquidity Window (default: 55): Volume smoothing window that proxies liquidity expansion.
Liquidity Reference TF (default: 60): Select a higher timeframe to cross-check whether current volume matches institutional flows.
Adaptive Threshold (default: enabled): Disable for fixed thresholds on slower markets; enable for high-volatility assets.
Base Burst Threshold (default: 1.25): Minimum flux magnitude that qualifies as an actionable pulse.
ALERTS
The indicator includes four alert conditions:
Bull Burst: Detects upside liquidity pulses
Bear Burst: Detects downside liquidity pulses
Bull Divergence: Flags bullish delta divergence
Bear Divergence: Flags bearish delta divergence
LIMITATIONS
This indicator is designed for liquid futures and equity markets. Performance may degrade in low-volume or highly illiquid instruments. The adaptive threshold system works best on timeframes where sufficient volatility history exists (typically 15-minute charts and above). Divergence signals are probabilistic and should be confirmed with price action.
INSERT_CHART_SNAPSHOT_URL_HERE
---
## RangeLattice Mapper
RangeLattice Mapper constructs a higher-timeframe scaffolding on any intraday chart, locking in structural highs/lows, mid/quarter grids, VWAP confluence, and live acceptance/break analytics. It provides a non-repainting overlay that turns range management into a disciplined process.
HOW IT WORKS
Structure Harvesting – Using request.security() , the script samples highs/lows from a user-selected timeframe (default 240 minutes) over a configurable lookback to establish the dominant range.
Grid Construction – Midpoint and quarter levels are derived mathematically, mirroring how institutional traders map distribution/accumulation zones.
Acceptance Detection – Consecutive closes inside the range flip an acceptance flag and darken the cloud, signaling balanced auction conditions.
Break Confirmation – Multi-bar closes outside the structure raise break labels and alerts, filtering the countless fake-outs that plague breakout traders.
VWAP Fan Overlay – Session VWAP plus ATR-based bands provide a live measure of flow centering relative to the lattice.
HOW TO USE IT
Range Plays : Fade taps of the outer rails only when acceptance is active and VWAP sits inside the grid—this is where mean-reversion works best.
Breakout Plays : Wait for confirmed break labels before entering expansion trades; the dashboard's Width/ATR metric tells you if the expansion has enough fuel.
Market Prep : Carry the same lattice from pre-market into regular trading hours by keeping the structure timeframe fixed; alerts keep you notified even when managing multiple tickers.
VISUAL FEATURES
Range Tap and Mid Pivot markers provide a tape-reading breadcrumb trail for journaling.
Cloud fill opacity tightens when acceptance persists, visually signaling balance compressions ready to break.
Dashboard displays absolute width, ATR-normalized width, and current state (Balanced vs Transitional) so you can glance across charts quickly.
Acceptance Flag toggle: Keep the repeated acceptance squares hidden until you need to audit balance.
PARAMETERS
Structure Timeframe (default: 240): Choose the timeframe whose ranges matter most (4H for indices, Daily for stocks).
Structure Lookback (default: 60): Bars sampled on the structure timeframe.
Acceptance Bars (default: 8): How many consecutive bars inside the range confirm balance.
Break Confirmation Bars (default: 3): Bars required outside the range to validate a breakout.
ATR Reference (default: 14): ATR period for width normalization.
Show Midpoint Grid (default: enabled): Display the midpoint and quarter levels.
Show Adaptive VWAP Fan (default: enabled): Toggle the VWAP channel for assets where volume distribution matters most.
Show Acceptance Flags (default: disabled): Turn the acceptance markers on/off for maximum visual control.
Show Range Dashboard (default: enabled): Disable if screen space is limited, re-enable during prep sessions.
ALERTS
The indicator includes five alert conditions:
Range High Tap: Price interacted with the RangeLattice high
Range Low Tap: Price interacted with the RangeLattice low
Range Mid Tap: Price interacted with the RangeLattice mid
Range Break Up: Confirmed upside breakout
Range Break Down: Confirmed downside breakout
LIMITATIONS
This indicator works best on liquid instruments with clear structural levels. On very low timeframes (1-minute and below), the structure may update too frequently to be useful. The acceptance/break confirmation system requires patience—faster traders may find the multi-bar confirmation too slow for scalping. The VWAP fan is session-based and resets daily, which may not suit all trading styles.
---

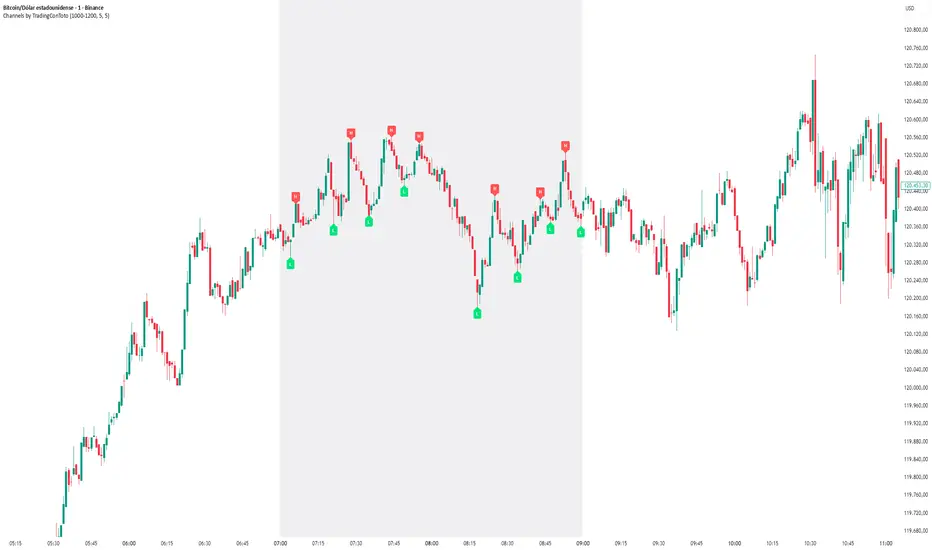
Channels by TradingConTotoThis indicator plots clear and minimalistic High (H) and Low (L) pivot points only within the selected trading session (e.g., 10:00–12:00).
During the active session, the background is shaded for easy visual reference, and pivot labels alternate automatically — meaning no consecutive H or L points appear in a row. This makes it simple to identify real swing changes within a specific session.
⚙️ Features
Detects and labels pivots only during the chosen time range.
Alternating logic prevents consecutive highs or lows (H → L → H → L).
Clean session background highlight for visual clarity.
Fully customizable parameters (session time, sensitivity, colors, etc.).
Ideal for intraday traders, scalpers, and structure-based strategies.
💡 Suggested Use
Perfect for traders who focus on specific market sessions (e.g., New York, London, or custom hours).
The alternating pivot logic helps visualize market swings and structural shifts without visual clutter, making it an excellent companion for price action analysis.
Futures Key LevelsKey Levels — Sessions, Previous Ranges & Opens (Chicago-aligned sessions)
What it does
This indicator plots commonly used reference levels across multiple timeframes to help you frame the day and find confluence:
Sessions (Chicago TZ): London, New York, and Asia session high/low ranges.
Previous Period Ranges: Previous Day / Week / Month / Quarter / Year High/Low and optional Mid.
Opens: Current Daily / Weekly / Monthly / Quarterly / Yearly opens.
Intraday (4H): Previous 4-Hour High/Low + optional Mid.
Monday Range: Captures Monday’s High/Low (and optional Mid) to use as a weekly reference.
Price-scale markers: Optional markers that track key levels on the price scale without adding extra lines.
How it works (concepts & calculations)
Higher-timeframe values are retrieved using request.security() and update when a new period begins (e.g., previous day’s H/L become fixed at the start of the new day).
Session ranges are built from bar data within session windows using time(session, "America/Chicago"):
London: 02:00–05:00 CT
New York: 08:30–15:00 CT
Asia: 20:00–00:00 CT
“Mid” levels are simple midpoints between each period’s High and Low.
Merge Levels: when different levels land at the same price, their labels are merged to reduce clutter (e.g., “PDH / PWH”).
Why this version is useful / original bits
All-white baseline for clean charts; session colors stand out by design: London = Yellow, New York = Aquatic Blue, Asia = Red.
Right-anchored mode lets you park levels to the right side of the chart with a configurable anchor distance.
Label merging keeps the display minimal when multiple levels coincide.
Price-scale-only markers available when you prefer fewer lines on the chart.
Inputs & customization
Display Style: Standard or Right Anchored (+ distance controls).
Levels toggles: enable/disable each period (Daily/Weekly/Monthly/Quarterly/Yearly), Monday range, 4H range, and session ranges.
Text: optional shorthand labels (e.g., PDH/PDL, PWH/PWL).
Colors: global white theme, with session highlights; you can override in the Inputs.
Price-scale markers: on/off toggle.
How to use it
Use previous High/Low as liquidity pools and areas to watch for sweeps, breaks, or retests.
The Monday range often frames the rest of the week; breaks or rejections around Monday H/L can be informative.
The 4H previous range gives intraday context—great for mean-reversion vs. continuation reads.
Session ranges help you see where the active session expanded price and where liquidity may remain.
Notes & limitations
Sessions are computed in America/Chicago; higher-TF levels use the symbol’s exchange timezone.
This is an indicator, not a strategy; it does not place trades or claim performance.
Always combine levels with your own execution rules (structure, momentum, risk).
Credit: inspired by spacemanBTC; this version adds the all-white styling, Chicago-aligned sessions, right-anchoring, label merging, and price-scale markers.
Also my mentor to tell me about the levels
Disclaimer
This tool is for educational purposes only and is not financial advice. Markets involve risk; do your own research and manage risk appropriately.

BPS Multi-MA 5 — 22/30, SMA/WMA/EMA# Multi-MA 5 — 22/30 base, SMA/WMA/EMA
**What it is**
A lightweight 5-line moving-average ribbon for fast visual bias and trend/mean-reversion reads. You can switch the MA type (SMA/WMA/EMA) and choose between two ways of setting lengths: by monthly “session-based” base (22 or 30) with multipliers, or by entering exact lengths manually. An optional info table shows the effective settings in real time.
---
## How it works
* Calculates five moving averages from the selected price source.
* Lengths are either:
* **Multipliers mode:** `Base × Multiplier` (e.g., base 22 → 22/44/66/88/110), or
* **Manual mode:** any five exact lengths (e.g., 10/22/50/100/200).
* Plots five lines with fixed legend titles (MA1…MA5); the **info table** displays the actual type and lengths.
---
## Inputs
**Length Mode**
* **Multipliers** — choose a **Base** of **22** (≈ trading sessions per month) or **30** (calendar-style, smoother) and set **×1…×5** multipliers.
* **Manual** — enter **Len1…Len5** directly.
**MA Settings**
* **MA Type:** SMA / WMA / EMA
* **Source:** any series (e.g., `close`, `hlc3`, etc.)
* **Use true close (ignore Heikin Ashi):** when enabled, the MA is computed from the underlying instrument’s real `close`, not HA candles.
* **Show info table:** toggles the on-chart table with the current mode, type, base, and lengths.
---
## Quick start
1. Add the indicator to your chart.
2. Pick **MA Type** (e.g., **WMA** for faster response, **SMA** for smoother).
3. Choose **Length Mode**:
* **Multipliers:** set **Base = 22** for session-based monthly lengths (stocks/FX), or **30** for heavier smoothing.
* **Manual:** enter your exact lengths (e.g., 10/22/50/100/200).
4. (Optional) On **Heikin Ashi** charts, enable **Use true close** if you want the lines based on the instrument’s real close.
---
## Tips & notes
* **1 month ≈ 21–22 sessions.** Using 30 as “monthly” yields a smoother, more delayed curve.
* **WMA** reacts faster than **SMA** at the same length; expect earlier signals but more whipsaws in chop.
* **Len = 1** makes the MA track the chosen source (e.g., `close`) almost exactly.
* If changing lengths doesn’t move the lines, ensure you’re editing fields for the **active Length Mode** (Multipliers vs Manual).
* For clean comparisons, use the **same timeframe**. If you later wrap this in MTF logic, keep `lookahead_off` and handle gaps appropriately.
---
## Use cases
* Trend ribbon and dynamic bias zones
* Pullback entries to the mid/slow lines
* Crossovers (fast vs slow) for confirmation
* Volatility filtering by spreading lengths (e.g., 22/44/88/132/176)
---
**Credits:** Built for clarity and speed; designed around session-based “monthly” lengths (22) or smoother calendar-style (30).

VWAP Suite {Phanchai}VWAP Suite {Phanchai}
Compact, readable, TradingView-friendly.
What is VWAP?
The Volume Weighted Average Price (VWAP) is the average price of a period weighted by traded volume. It’s used as a fair-value reference (mean) and resets at the start of each new period.
Included VWAP Modes
Session — resets each trading day (current session).
Week / Month / Quarter / Year — current calendar periods.
Anchored Week / Month / Quarter / Year — starts at the beginning of the previous completed period.
Rolling 7D / 30D / 90D — rolling windows: today + last 6/29/89 daily sessions.
Important
This suite does not generate buy/sell signals. It provides structure and confluence; decisions remain yours.
Use Cases
Identify fair-value zones / mean-reversion areas.
Plan TP / SL around periodic VWAPs.
Define DCA levels (e.g., anchored to prior week/month).
Gauge trend bias via VWAP slope and reactions.
How to Use
Inputs → VWAP 1..5: Choose the period per slot (Session, Anchored, Rolling, etc.) and toggle Show .
Sources: Select the price source for all VWAPs (default: HLC3).
Global: Line offset (bars) shifts plots visually (does not affect calculations).
Style tab: Adjust per-line colors, thickness, and line style.
Alerts
Price crosses a VWAP (per slot).
VWAP slope turns UP or DOWN (per slot).
Tips & Notes
Volume required: Poor/absent volume (e.g., some FX tickers) can degrade accuracy.
Anchored modes: Start at the prior period’s open; values appear only after that timestamp.
Rolling modes: Use completed daily sessions (including today).
Clutter control: If labels crowd, increase Line offset or hide unneeded slots.
Confluence: Combine with market structure, liquidity zones, or momentum filters for stronger context.
Built for clear VWAP workflows. Trade safe!

MACROFLOW 200 — Bias & Triggersstephtradez model
MACROFLOW 200 — at a glance (the elevator pitch)
Trade direction = Macro Bias + 1H 200 EMA filter + DXY confirm.
Locations = 1H supply/demand zones.
Triggers (15m): (T1) Retest rejection, (T2) Liquidity sweep + BOS/CHOCH, (T3) Momentum break + shallow pullback.
Stops: structure‑based beyond zone with ATR buffer.
Targets: 2R base, scale at 1.5R, trail to next HTF zone.
Sessions: 7–10 pm ET and 9:30–10:30 am ET.
Risk: tight, prop‑friendly max 1% per session

ABS Companion Oscillator — Trend / Exhaustion / New Trend (v1.1)
# ABS Companion Oscillator — Trend / Exhaustion / New Trend (v1.1)
## What it is (quick take)
**ABS CO** is a unified **–100…+100 trend oscillator** that fuses:
* **Regime**: EMA stack (fast/slow/long) + **HTF slope** (e.g., 60-minute)
* **Momentum**: **TSI** vs its signal
* **Stretch**: session-anchored **VWAP Z-score** for exhaustion and “fresh-trend” sanity checks
It paints the oscillator with **lime** in upstate, **red** in downstate, **gray** in neutral, and tags:
* **NEW↑ / NEW↓** when a **new trend** likely starts (zero-line cross with acceptable stretch)
* **EXH↑ / EXH↓** when an **existing trend looks exhausted** (large |Z| + momentum rollback)
> Use it as a **direction filter and context layer**. Works great in front of an entry engine and behind an exit tool.
---
## How to use it (operational workflow)
1. **Read the state**
* **Uptrend** when the oscillator is **≥ upThresh** (default +55) → prefer **long-side** plays.
* **Downtrend** when the oscillator is **≤ dnThresh** (default −55) → prefer **short-side** plays.
* **Neutral** between thresholds → be selective or flat; expect chop.
2. **Act on events**
* **NEW↑ / NEW↓**: zero-line cross with acceptable |Z| (not already overstretched). Treat as **trend start** cues.
* **EXH↑ / EXH↓**: trend state with **high |Z|** and TSI rollback versus its signal. Treat as **trend fatigue**; avoid fresh go-with entries and tighten risk.
3. **Practical pairing**
* Use **up/down state** (or above/below **neutralBand**) as your go/no-go filter for entries.
* Prioritize entries **with** NEW↑/NEW↓ and **without** nearby EXH tags.
* Keep holding while the oscillator stays in state and no EXH appears; consider scaling out on EXH or on your exit tool.
---
## Visual semantics & alerts
* **ABS CO line** (–100…+100): lime in upstate, red in downstate, gray in neutral.
* **Horizontal guides**: `Up` threshold, `Down` threshold, `Zero`, and optional **neutral band** lines.
* **Background heat** (optional): shaded when EXH conditions trigger (lime/red tint with intensity scaled by |Z|).
* **Tags**: `NEW↑`, `NEW↓`, `EXH↑`, `EXH↓`.
**Alerts (stable):**
* **ABS CO — New Uptrend** (NEW↑)
* **ABS CO — New Downtrend** (NEW↓)
* **ABS CO — Exhausted Up** (EXH↑)
* **ABS CO — Exhausted Down** (EXH↓)
Set alerts to **“Once per bar close”** for clean signals.
---
## Non-repainting behavior
* HTF queries use **lookahead\_off**.
* With **Strict NR = true**, the HTF slope is taken from the **prior completed** HTF bar; events evaluate on confirmed bars → **safer, fewer, cleaner**.
* NEW/EXH tags finalize at bar close. Disabling strictness yields earlier but noisier responses.
---
## Every input explained (and how it changes behavior)
### A) Trend & HTF structure
* **EMA Fast / Slow / Long (`emaFastLen`, `emaSlowLen`, `emaLongLen`)**
Control the baseline regime. Larger = smoother, fewer flips; smaller = snappier, more flips.
* **HTF EMA Len (`htfLen`)** & **HTF timeframe (`htfTF`)**
HTF slope filter. Longer len or higher TF = steadier bias (fewer state changes); shorter/ lower = more sensitive.
* **Strict NR (`strictNR`)**
`true` uses the **previous** HTF bar for slope and evaluates on confirmed bars → cleaner, slower.
### B) Momentum (TSI)
* **TSI Long / Short / Signal (`tsiLong`, `tsiShort`, `tsiSig`)**
Standard TSI. Larger values = smoother momentum, fewer EXH triggers; smaller = snappier, more EXH sensitivity.
### C) Stretch (VWAP Z-score)
* **VWAP Z-score length (`zLen`)**
Window for Z over session-anchored VWAP distance. Larger = smoother |Z|; smaller = more reactive stretch detection.
* **Exhaustion |Z| (`zHot`)**
Minimum |Z| to flag **EXH**. Raise to demand **bigger** stretch (fewer EXH); lower to catch milder excess.
* **Max |Z| for NEW (`zNewMax`)**
NEW requires |Z| **≤ zNewMax** (avoid “new trend” when already stretched). Lower = stricter; higher = more NEW tags.
### D) States & thresholds
* **Uptrend threshold (`upThresh`)** / **Downtrend threshold (`dnThresh`)**
Where the oscillator flips into trend states. Widen (e.g., +60/−60) to reduce false states; narrow to get earlier signals.
* **Neutral band (`neutralBand`)**
Visual buffer around zero for “meh” momentum. Larger band = fewer go/no-go flips near zero.
### E) Visuals & tags
* **Show New / Show Exhausted (`showNew`, `showExh`)**
Toggle the tag labels.
* **Shade exhaustion heat (`plotHeat`)**
On = color background when EXH fires. Helpful for scanning.
### F) Smoothing
* **Osc smoothing (`smoothLen`)**
EMA over the raw composite. Higher = steadier line (fewer whip flips); lower = faster turns.
---
## Tuning recipes
* **Trend-day bias (follow moves longer)**
* Raise **`upThresh`** to \~60 and **`dnThresh`** to \~−60
* Keep **`zNewMax`** low (1.0–1.2) to avoid “fresh trend” when stretched
* **`smoothLen`** 3–5 to reduce noise
* **Range-day bias (fade edges)**
* Keep thresholds closer (e.g., +50/−50) for quicker state changes
* Lower **`zHot`** slightly (1.6–1.7) to catch earlier exhaustion
* Consider slightly shorter TSI (e.g., 21/9/5) for faster EXH response
* **Scalping LTF (1–3m)**
* TSI 21/9/5, **`smoothLen`** 1–2
* Thresholds +/-50; **`zNewMax`** 1.0–1.2; **`zHot`** 1.6–1.8
* StrictNR **off** if you want earlier calls (accept more noise)
* **Swing / HTF (1h–D)**
* TSI 35/21/9, **`smoothLen`** 4–7
* Thresholds +/-60\~65; **`zNewMax`** 1.2; **`zHot`** 1.8–2.0
* StrictNR **on** for cleaner bias
---
## Playbooks (how to actually trade it)
* **Go/No-Go Filter**
* Only take **long entries** when the oscillator is **above the neutral band** (preferably ≥ `upThresh`).
* Only take **short entries** when **below** the neutral band (preferably ≤ `dnThresh`).
* Avoid fresh go-with entries if an **EXH** tag appears; let the next setup re-arm.
* **Trend Genesis**
* Treat **NEW↑ / NEW↓** as “green light” for **first pullback** entries in the new direction (ideally within acceptable |Z|).
* **Trend Maturity**
* When in a position and **EXH** prints **against** you, tighten stops, take partials, or lean on your exit tool to protect gains.
---
## Suggested starting points
* **Day trading (5–15m):**
* TSI 25/13/7, `smoothLen=3`, thresholds **+55 / −55**, `zNewMax = 1.2`, `zHot = 1.8`, **StrictNR = true**
* **Scalping (1–3m):**
* TSI 21/9/5, `smoothLen=1–2`, thresholds **+50 / −50**, `zNewMax = 1.1–1.2`, `zHot = 1.6–1.8`, **StrictNR = false** (optional)
* **Swing (1h–D):**
* TSI 35/21/9, `smoothLen=4–6`, thresholds **+60 / −60**, `zNewMax = 1.2`, `zHot = 1.9–2.0`, **StrictNR = true**
---
## Notes & best practices
* **Session anchoring**: Z-score is session-anchored (resets by trading date). If you trade outside standard sessions, verify your data session.
* **Instrument specificity**: Tune **`zHot`**, **`zNewMax`**, and thresholds per symbol and timeframe.
* **Bar-close discipline**: Evaluate tags at **bar close** to avoid intrabar flip-flop.
* This is a **context/confirmation tool**, not a broker or strategy. Combine with your entry/exit rules and position sizing.
---
**Tip:** Start with the suggested day-trading profile. Use this oscillator as your **gate** (only trade with it), let your entry engine time executions, and rely on your exit tool for standardized profit-taking.
