Volume Pressure AnalysisVolume Pressure Analysis is a new concept I have been working on designed to show the effort required to move price. An ideal tool for confirming trends or locating reversals early. This indicator can highlight whale action and market manipulation. It calculates volume vs volatility and displays the results as a meter:
Above 0 shows how easy price action is traveling, the bigger these bars the less volume and effort is required to push price. These are indicated with a teal or red arrows and can confirm the beginning or continuation of a trend. This is the natural direction the chart wants to travel at that time.
Below 0 shows how hard price is to move. The bigger these bars the more volume and effort is required to push price. When whales and market makers push price against its will these bars will get bigger.
Yellow arrows signal pressure in that direction and excessive amounts of volume is required to move price. These signals can lead to reversal/ pivot points as price action struggles to continue its trend. These signals can be turned on in settings or use the overlay version of this script to display signals on chart. This is a very powerful tool when used with relative volume.
ابحث في النصوص البرمجية عن "volume"

Volume fightThe Volume fight indicator looks for the predominance of bullish or bearish trading volume on the chart by dividing the trading volume in the bar into 2 parts - "bullish volume" and "bearish volume", and comparing the weighted average values by volume with each other at a given distance.
This indicator is suitable for any instrument (cryptocurrency, Forex, stocks) and is able to work on any TF.
The Volume fight indicator should be used as an auxiliary indicator that tells you who is currently prevailing in the market - " bulls "or"bears".
To configure the indicator, it is necessary to set the range of evaluation of the predominance of bullish or bearish volume (the number of bars, by default-24 bars for TF=1H). The smaller the TF, the higher the range value should be used to filter out false signals.
When there is a predominance of "bulls" on the chart, a green triangle appears (relevant at the close of the bar) and the histogram is highlighted in green, when "bears" appear on the chart, a red triangle appears (relevant at the close of the bar) and the histogram is highlighted in red.
In the indicator settings, there is smoothing to reduce false signals and highlight the flat zone by specifying a percentage, at least which should be the difference between the forces of the "bullish" and "bearish" volume. If the difference between the volume forces is less than the specified one (by default-15%), the zone is considered flat and is displayed in gray on the histogram.
If you set the percentage to zero, the flat zones will not be highlighted, but there will be much more false signals, since the indicator becomes very sensitive when the smoothing percentage decreases.
There is a function-to show the color background of the current trading zone. For" bullish "- green, for" bearish " - red.
In the settings, you can enable the display and use of each signal in the trading zone, not only the initial one, but also each after the flat zone. By default, only the signal of the beginning of the ascending/descending zone is used.
The indicator has alerts for "bullish" and "bearish" movements. Use alerts - "Once per bar close".
If you have any questions, you can write to me in private messages or by using the contacts in my signature.
----------------------------------------------------
Индикатор Volume fight ищет на графике преобладание бычьего или медвежьего объёма торгов путём разделения торгового объёма в баре на 2 части - "бычий объём" и "медвежий объём", и сравнения средне-взвешенных значений по объёму между собой на заданной дистанции.
Данный индикатор подходит для любого инструмента (криптовалюта, Forex, акции) и способен работать на любом ТФ.
Индикатор Volume fight следует использовать как вспомогательный индикатор, который подсказывает Вам кто сейчас преобладает на рынке - "быки" или "медведи".
Для настройки индикатора необходимо выставить диапазон оценки преобладания бычьего или медвежьего объема (количество баров, по умолчанию - 24 бара для ТФ=1Ч). Чем меньше ТФ, тем выше следует использовать значение диапазона, чтобы отфильтровать ложные сигналы.
При возникновении преобладания на графике "быков" появляется зелёный треугольник (актуален по закрытию бара) и гистограмма подсвечивается зелёным цветом, при возникновении на графике "медведей" появляется красный треугольник (актуален по закрытию бара) и гистограмма подсвечивается красным цветом.
В настройках индикатора есть сглаживание для уменьшения ложных сигналов и выделения зоны флета с помощью указания процента, не менее которого, должна быть разница между силами "бычьего" и "медвежьего" объёма. Если разница между силами объёмов меньше заданного (по умолчанию - 15%), то зона считается флетовой и отображается на гистограмме серым цветом.
Если выставить процент равным нулю, то зоны флета выделяться не будут, но будет гораздо больше ложных сигналов, так как индикатор становится очень чувствительным при снижении процента сглаживания.
Есть функция - показывать цветовой фон текущей торговой зоны. Для "бычьего" - зелёный, для "медвежьего" - красный.
В настройках можно включить отображение и использование каждого сигнал в торговой зоне, не только начального, но и каждого после зоны флета. По умолчанию - только сигнал начала восходящей/нисходящей зоны.
Индикатор имеет оповещения для "бычьего" и "медвежьего" движения. Используйте оповещения - "на закрытии бара".
По любым вопросам Вы можете написать мне в личные сообщения или по контактам в моей подписи.

Volume BricksVolume Bricks - As if a Renko made new bricks on volume.
Set a percentage of the previous day's volume and this will post new levels when accumulated volume meets that percentage.
It will also plot shapes (and labels for recent bars) when price movement is accompanied by more than one times the volume level specified.

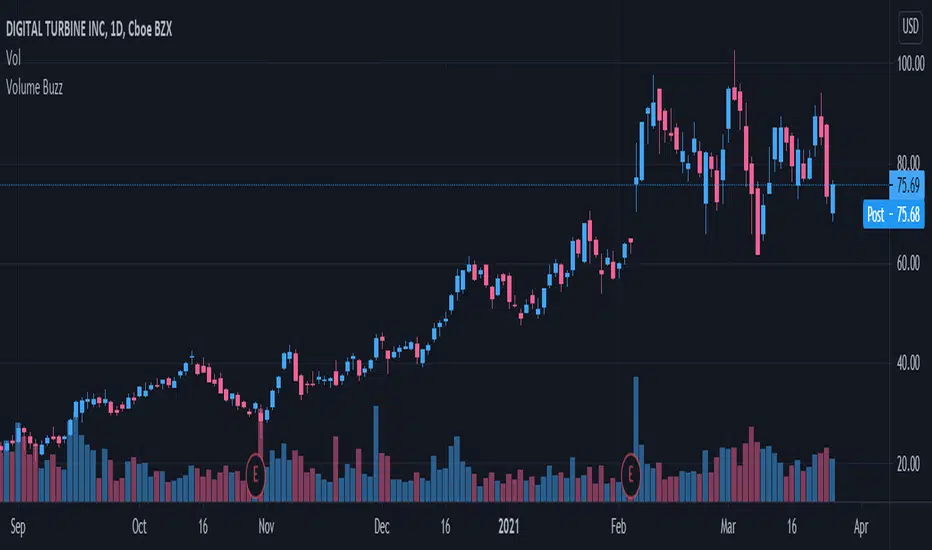
Volume Buzz 2.0Volume Buzz/Volume Run Rate as seen on TC2000 and MarketSmith respectively.
Basically, the volume buzz tells you what percentage over average(100 time period moving average) the volume traded was. You can use this indicator to more readily identify above-average trading volume and accumulation days on charts. The percentage will show up in the top left corner, make sure to click the settings button and uncheck the second box(left of plot) in order to get rid of the chart line.
Pictured above, a chart with the volume on the bottom along with the 50-day moving average applied to volume. As you can see in the top left it will tell you the "volume buzz" of that day, telling you what days were on above-average volume and how above-average those days were.
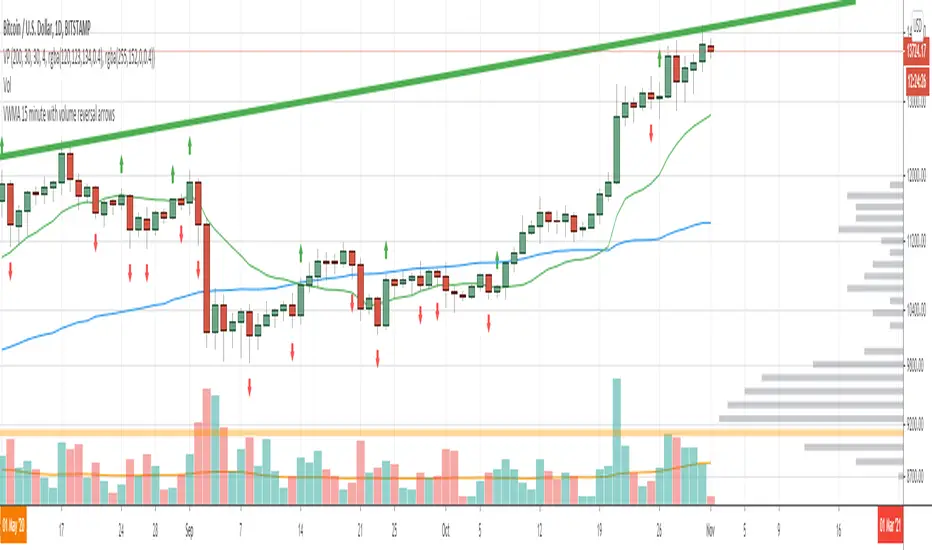
Volume Reversals and 4h MAsThis script is tailored to 15 minute charts.
It overlays volume reversals and some long term MAs to help set your bias - I like to consider the following factors when evaluating a trade:
Trends for entry:
* Long term trend direction to set bias: Purple line
* Medium term trend on the right side of bias: Orange on the right side of purple
* Distance of price from Purple line - prefer to cross orange in line with bias, but sometimes it's ok to be wrong side of Orange
Volume reversal signal - short term reversals in OBV:
* Arrows indicate 15 minute volumes increased while close reversed over three candles
Exits:
* Consider exiting when crossing short term trend - Blue line
Volume Divergence by MMIt's a simply volume indicator. You should watch for breaks on both volume uptrend and volume downtrend. It uses fibonacci numbers to build smoothed moving average of volume.
Also you can check divergences for trend reversal and momentum loss.

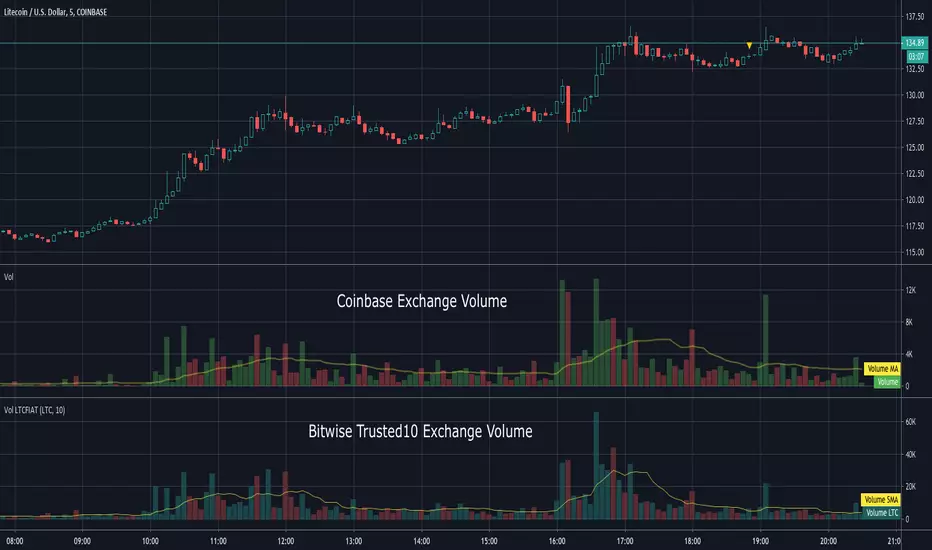
Volume LTCFIATThis indicator shows the aggregated volume of LTCFIAT of the Bitwise "Trusted 10" Exchanges that are available on TradingView.
I did not include every currency or stable coin available on these exchanges due to some being inconsequential in volume.
Volume can be shown in LTC or USD amounts. The moving average can be adjusted and if set to 0 will hide it.
Due to the number of lookups please be patient while loading. It will take a moment to display.
To load search Indicators for "Volume LTCFIAT" and click to load.
This indicator does not require access from me.
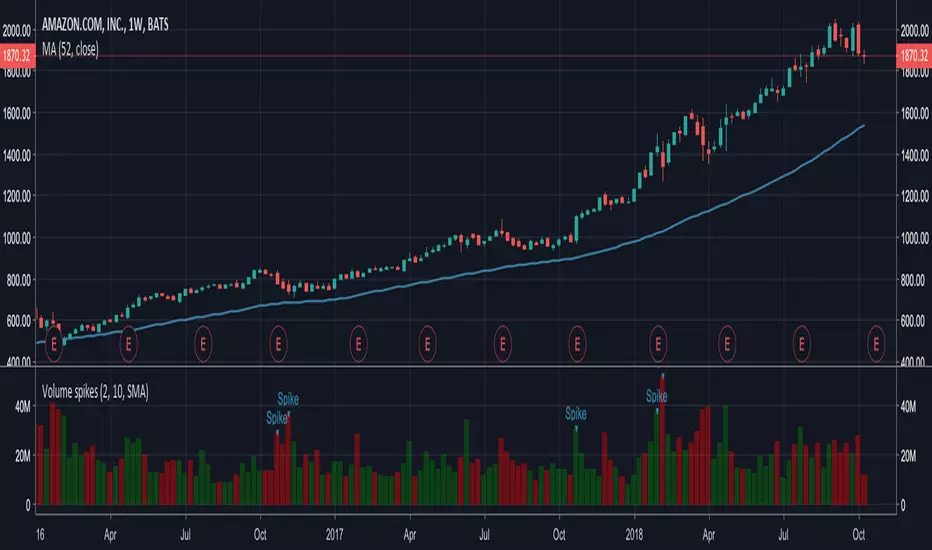
Volume spikesSimple indicator which shows volume spikes.
By default spike is defined as such when volume is 2 times higher than average volume for last 10 volume bars (this can be changed in settings)
Also instead of using average volume (SMA is used in this case) you can use WMA or EMA by changing settings
Volume Price Spread Analysis 2With the same idea of the VPSA i make the VPSA2 to make Heiken Ashi style synthetic graph of the price and the volume effect, its easy to see the volume trends. Each instrument have a more clear time frame to see the volume patterns.
I see very useful like a secondary analysis layer. in the graph show the same RSI with price and VPSA2 like source.
Can use others indicators over the VPSA, only write in CAPITAL letters open, high, low, close or hl2 at inputs section.
Ideas, corrections & comments.
They are always welcome.

Volume Price Spread AnalysisWith the same idea of the VSA i make the VPSA to make synthetic graph of the price and the volume effect, its easy to see the volume trends. Each instrument have a more clear time frame to see the volume patterns.
Can use others indicators over the VPSA, only write in CAPITAL letters open, high, low, close or hl2 at inputs section.

Volume OscillatorDescription
The Volume Oscillator measures the momentum of trading volume by calculating the percentage difference between a fast and a slow Simple Moving Average (SMA) of daily volume. It helps traders identify periods of increasing or decreasing market participation, often signaling potential trend strength or exhaustion.
Key Features:
Adaptive to Trading Session:
Automatically adjusts SMA periods based on the actual trading session length (default: 8.5 hours for FTSEMIB, customizable for any market — e.g., 6.5h for US stocks, 24h for crypto).
Fast & Slow SMAs:
Compares a short-term SMA (default 10 days) with a longer-term SMA (default 25 days) of volume.
Oscillator Formula:
100 × (Fast SMA / Slow SMA - 1)
→ Positive values = increasing volume momentum (bullish)
→ Negative values = decreasing volume momentum (bearish)
Signal Line (optional):
A moving average of the oscillator (default 7 days) for smoother trend identification and crossover signals.
Overbought/Oversold Levels:
User-defined horizontal lines (default +40 / -40) to highlight extreme volume conditions.
Customizable Colors:
Change the oscillator and signal line colors to match your chart style.
How to Interpret:
Bullish Conditions:
Oscillator crosses above the zero line
Oscillator crosses above the signal line
Readings near or above +40 may indicate strong buying pressure (watch for possible exhaustion if too extreme)
Bearish Conditions:
Oscillator crosses below the zero line
Oscillator crosses below the signal line
Readings near or below -40 may indicate selling pressure or capitulation
Divergences:
Look for divergences between price and the Volume Oscillator (e.g., price makes new highs but oscillator fails to confirm with higher highs) — a classic sign of weakening momentum.
Best Use Cases:
Indices (FTSEMIB, DAX, CAC, SPX, etc.), stocks and futures with defined trading hours, crypto (set session duration to 24 hours).
Works well on intraday (e.g., 15m, 30m, 1h) and daily charts.
Customization Tips:
- Shorten fast/slow lengths for faster signals (more noise)
- Lengthen them for smoother, longer-term analysis
- Adjust session duration for non-standard market hours
- Enable/disable the signal line in the settings
Note: Volume data quality can vary by symbol and exchange. Always combine this indicator with price action and other tools. Use proper risk management.

Volume vs Body Alert.Vsa
"This VSA-based indicator identifies potential anomalies in price action by detecting candles that show a larger body size than the previous candle while simultaneously having lower volume. This 'more result with less effort' pattern can signal weakness, manipulation, or potential trend exhaustion. Visual signals and customizable alerts notify traders when these conditions occur."

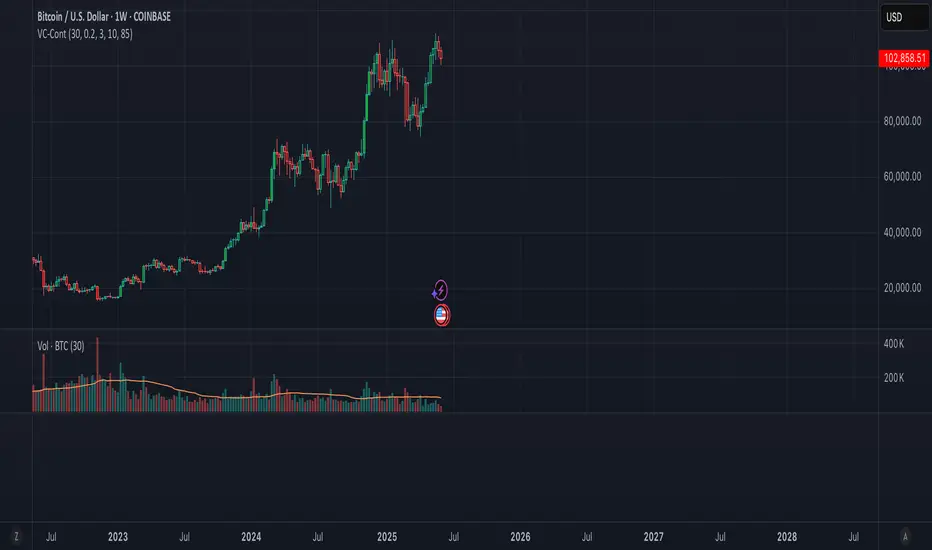
Volume–Phase Analyzer ProVolume–Phase Analyzer Pro – Trend & Institutional Volume Phases
This indicator analyzes how volume behaves relative to price movement to detect whether the market is in Accumulation, Markup, Distribution, or Markdown — the same phases institutions track in professional trading.
Unlike regular volume/MA mashups, this tool combines:
• Institutional volume classification (HighVol Up/Down, LowVol, Confused Vol)
• Price–volume efficiency and wick dominance
• Multi-Timeframe directional filters
• Volatility compression signals using Bollinger Width
• Volume mapped directly into the price chart as candles
• Smart signal engine with cooldown (prevents repeated signal spam)
This helps reveal w hen Smart Money is accumulating, pushing trends, unloading positions, or flushing liquidity.
────────────────────────────────────
How It Works
1️⃣ Volume Strength vs Average Volume
Identifies whether a move is backed by genuine buying/selling power.
2️⃣ Wick & Body Analysis
Confirms whether volume produced meaningful directional pressure — not just noise.
3️⃣ Trend Alignment
Fast EMA vs Slow EMA ensures signals align with active trend.
4️⃣ Higher-Timeframe Confirmation
Confirms if current movement agrees with a larger directional bias.
5️⃣ Compression Detection
When price volatility contracts while high-volume bars appear → phase shift often ahead.
────────────────────────────────────
Signals
BUY → Confirmed bullish demand with trend backing
SELL → Confirmed bearish supply taking control
TRAP → Likely stop-hunt or absorption — often before reversal
Signals only appear when multiple institutional conditions align.
A cooldown prevents repetitive signals like BUY-BUY-BUY.
────────────────────────────────────
Background shading helps visually locate these phases.
Markup phase:
• Meaning: Buyers are in control and the market is trending up
• Background color: Light green
Markdown phase:
• Meaning: Sellers are in control and the market is trending down
• Background color: Light red
Accumulation phase:
• Meaning: Smart Money quietly buying near the bottom before an uptrend
• Background color: Teal (blue-green)
Distribution phase:
• Meaning: Smart Money quietly selling near the top before a downtrend
• Background color: Light orange/yellow
Consolidation phase:
• Meaning: Sideways movement with low conviction
• Background color: Very light grey
Transition phase:
• Meaning: Market has not picked a direction yet
• Background color: No shading (clear background)
⸻
Quick Usage Notes
• Best trades are Buy signals during Markup and Sell signals during Markdown
• Accumulation and Distribution often come before reversals
• Consolidation is a low-quality trading zone
────────────────────────────────────
How to Trade It
• Take BUY signals during Markup
• Take SELL signals during Markdown
• Expect reversals near Trap signals, especially when phase is changing
• Avoid over-trading Consolidation zones
• Volume candles below price reveal when momentum is increasing or fading
Best applied on 5m–1H for intraday and swing confirmation.
────────────────────────────────────
Why This Indicator Is Unique
• It uses p rice-volume efficiency , not standard lagging signals
• It detects S mart Money intent , not retail reactions
• It avoids spam signals using an internal cooldown logic
• It gives context, not just entries — via live market-phase analysis
This makes it a multi-purpose tool for trend trading, breakout trading, and reversal anticipation.
────────────────────────────────────
Alerts Included
• Buy/Sell/Trap Signals
• Phase Change Alerts
────────────────────────────────────
This is a free tool and meant for educational use only.
Always use proper risk management.
────────────────────────────────────

Volume Spread Analysis — Educational (VSA Study)Volume Spread Analysis — Educational (VSA Study)
Overview
This study is an educational tool built around classic Volume Spread Analysis (VSA), the methodology introduced by Tom Williams.
VSA looks at the relationship between volume, price spread, and closing position to highlight potential supply and demand imbalances.
The script is designed for learning and visual study, not for trade signals. It highlights well-known VSA events directly on the chart and adds reference lines and a colored moving average to help contextualize strength and weakness.
What It Shows
Major VSA Events: Stopping Volume (SV), Selling Climax (SC), Shakeout (SO), No Supply (NS), No Demand (ND), Buying Climax (BC), Upthrust (UT), Supply Coming In (SCI), End of Rising Market (EoRM), and Test Bars.
Trigger Lines: When a strong VSA bar appears, the script draws horizontal levels at the bar’s high and low. These act as educational “zones” where future price reactions can be studied.
Context Moving Average: A dotted MA changes color with price context (black or green when strength is confirmed, red when weakness dominates).
How It Works
Each event is identified using a blend of conditions:
Volume vs. its average
Spread vs. its average
Close location within the bar
Wick analysis (upper/lower shadows)
Short-term trend filters (5- and 10-period SMAs)
By combining these elements, the script maps chart activity to classical VSA definitions.
How to Study With It
Signs of Strength
Look for SC, SV, or SO bars.
Wait until price trades above the blue trigger line drawn from those bars.
Watch for a No Supply (NS) test bar in that zone.
Confirmation comes when the immediate next bar closes up and strong, with higher volume than the prior two bars.
The dotted MA should shift to black or green, showing supportive background strength.
Signs of Weakness
Watch for Supply Coming In, BC, or UT events.
Wait until price trades below the red trigger line.
Look for a No Demand (ND) bar in that area.
Confirmation comes when the following bar closes down and weak, with higher volume than the prior two bars.
The dotted MA should be red, reinforcing weakness.
Originality
This script was written from scratch with a focus on education and clarity. While VSA concepts themselves are public domain, the implementation here is unique:
It combines event detection, trigger zones, and a contextual MA in one framework.
It avoids acting as a trading system and instead provides a practical study workflow that traders can follow step by step.
Disclaimer
This indicator is for educational purposes only.
It does not generate buy or sell signals and should not be used as financial advice.
Trading involves risk; always perform your own analysis and risk management.

Volume VA with POC Based Percent DeviationsThis is a slightly different take on my previous version that plotted fibonacci retracement levels based on the POC to value area high/low.
This indicator is also based on the volume value area that plots developing POC, VAH, and VAL as well as historical levels. However, instead of plotting fib levels, this script automatically projects percentage deviation levels from the current POC. This can help identify potential overextensions, target areas, or mean-reversion setups.
Knowing where price is and the change in price relative to areas of interest can help identify true value and market imbalances. Hence the name VALUE AREA :)
The percent deviation levels are dynamically plotted in relation to the developing POC. As POC shifts so do the % levels.
Gradient Value Area Fill: Instead of a static color, the Value Area is filled with a dynamic gradient. The adjustable color and transparency shift is based on the current price's distance from the POC, giving you an intuitive feel for where price is relative to the POC.
Enjoy!
"May the fourth leaf bring you extra luck!" 🍀

Volume PercentileThis Pine Script indicator highlights bars where the current volume exceeds a configurable percentile threshold (e.g., 80th percentile) based on a rolling window of historical volume data.
🔍 Key Features:
Calculates a user-defined volume percentile (e.g., 75th, 80th, 90th) over a rolling window.
Marks candles where current volume is higher than the selected percentile.
Helps detect volume spikes, breakouts, or unusual activity.
Works directly on the main chart window for easier analysis.
🛠️ Inputs:
Window Length: Number of bars used to calculate the percentile (default = 20).
Percentile: The percentile threshold to trigger a high-volume signal (default = 80).
🖥️ Visualization:
Displays a red triangle marker below bars with volume above the selected percentile.

Volume Candle Color (Continuous)Volume-Based Candle Color Indicator (Continuous Gradient)
Overview
Transform your charts with this advanced volume visualization tool that colors candles based on relative volume intensity using a smooth, continuous gradient . Unlike traditional step-based volume indicators, this script provides nuanced color transitions that make volume anomalies instantly visible.
Key Features
Continuous Color Gradient
Smooth transitions - No more discrete color steps
High volume = Bright, opaque colors that demand attention
Low volume = Faded, transparent colors that blend into background
Real-time adaptation to market conditions
Full Customization Control
Volume Range Settings: Define min/max volume ratios for optimal sensitivity
Transparency Control: Adjust brightness levels from 0-95%
Custom Colors: Choose your preferred bullish/bearish base colors
Moving Average Period: Customize the volume comparison timeframe (default: 30)
Enhanced Visualization
Optional Info Panel: Real-time display of volume metrics
Volume Ratio Plot: Additional pane showing volume ratio trends
Clean Interface: Non-intrusive overlay that enhances price action
How It Works
The indicator calculates relative volume by comparing current volume to a Simple Moving Average (SMA) of volume over your chosen period. This ratio is then mapped to a continuous color scale:
Volume Ratio > 2.0: Maximum intensity (brightest colors)
Volume Ratio 1.0: Average volume (medium intensity)
Volume Ratio < 0.5: Below average (most transparent)
Bullish Candles (Close > Open): Green gradient
Bearish Candles (Close < Open): Red gradient
Trading Applications
Volume Spread Analysis (VSA)
Perfect companion for VSA traders who need to quickly identify:
Climactic volume at key support/resistance levels
No demand situations with low volume
Professional money accumulation/distribution patterns
Breakout Confirmation
High volume breakouts: Immediately visible with bright colors
False breakouts: Revealed by low volume (faded colors)
Volume divergences: Spotted instantly through color intensity changes
Market Structure Analysis
Support/Resistance tests: Volume validation through color brightness
Trend strength: Continuous color feedback on volume participation
Market phases: Easy identification of accumulation vs distribution
Why Choose This Indicator?
Advantages Over Traditional Volume Indicators:
Instant Visual Feedback: No need to look at separate volume bars
Continuous Scale: More precise than discrete level systems
Customizable Sensitivity: Adapt to any market or timeframe
Clean Charts: Maintains focus on price action while adding volume context
Universal Application: Works on all instruments and timeframes
Settings Guide
Essential Settings:
Volume MA Period (30): Longer periods = smoother baseline, shorter = more sensitive
Min Volume Ratio (0.2): Lower values = more sensitivity to low volume
Max Volume Ratio (3.0): Higher values = accommodate extreme volume spikes
Transparency Range (10-85%): Adjust visual contrast to your preference
Pro Tips:
Day Trading: Use 10-20 period MA for quick volume changes
Swing Trading: Use 30-50 period MA for broader volume context
Lower transparency range (0-70%) for subtle effects
Higher transparency range (20-90%) for dramatic contrasts
Best Practices
Combine with Price Action: Use volume colors to confirm price patterns
Multiple Timeframes: Apply on different timeframes for comprehensive analysis
Market Context: Adjust sensitivity based on market volatility periods
Backtesting: Test settings on historical data before live trading
Perfect For:
Volume Spread Analysis practitioners
Breakout traders seeking confirmation
Market structure analysts
Anyone wanting cleaner, more intuitive volume visualization
Technical Specifications
Pine Script v6 - Latest version compatibility
Overlay Indicator - Works directly on price charts
Minimal Performance Impact - Optimized calculations
All Market Types - Stocks, Forex, Crypto, Futures
Transform your volume analysis today! Experience the difference continuous color gradients make in identifying high-probability trading opportunities.
Like and follow for more innovative trading tools!
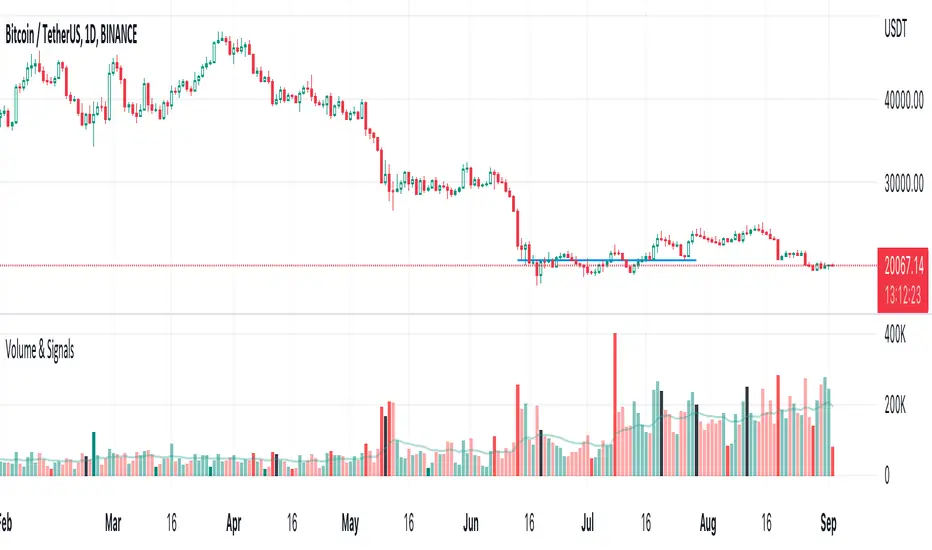
Volume & Signals
Highlighted large and small volume with solid colors.
Normal bars are the same colors as the built-in volume indicator.
Black bars are where you can Sell into strength
Volume MA * Fibo levelsIn the scrypt above, the SMA of Volume is taken as a basis and the Fibonacci levels are calculated.
This can be useful for analyzing the trend in accordance with changes in volume.
Any feedback is appreciated!
Good luck with your trading!

Volume Changes with Bollinger Bands & Signal/AlertJapanese below / 日本語説明は下記
---------------------------------------------
Hello traders,
This indicator shows volume changes in percentage over the past periods as well as Bollinger Bands of volume changes with +2σ band.
The formula to calculate volume changes is;
(Today’s volume / average volume of past n periods ) *100
** n is user input
Bar color changes to green if close >= open, else if red.(You can change colors.)
Bollinger band
The reason I included Bollinger band here is if volume changes crosses over +2σ bands, that would suggest strong buying or selling pressure behind which might contribute price surging or dropping.
The following chart is BTCUSD daily chart.
Some correlation between volume changes and price movement can be observed.
For example, when volume changes surpasses BB+2σ with green bar, bullish trend occurs while in case of red bar, bearish trend happened.
Signal/Alert
Signal can be shown when volume changes cross over BB +2σ or upper band.(% changes, user input) Alert condition is same.
——————————————
出来高変化率のインジケーターです。過去n期間の出来高平均と当日出来高を比較してオシレータとして表示するとともに、出来高変化率のボリンジャーバンド+2シグマバンドを表示します。
出来高変化率の計算式は以下の通りです。
(当日出来高 / 過去n期間の平均出来高) * 100
* nはユーザ指定
終値>=始値の場合は緑色のバーで、終値<始値の場合は赤色のバーで表示します。(色は変更可能)
ボリンジャーバンド
出来高変化率が、出来高変化率のボリンジャーバンド+2シグマを超えるということはそれだけ強い買い・売りの存在を示唆していることになるのではと考え表示可能なようにしています。
以下のチャートはビットコイン/米ドルの日足チャートです。
例えば出来高変化率がBB+2シグマを超えて陽線で引けた場合、以降上昇トレンドが発生していることが確認できます。同様に出来高変化率がBB+2シグマを超えて陰線で引けた場合は下降トレンドが発生していることが確認できます。
これらは裏に強い買い、売り圧力が存在していることを示唆していると読み取ることができます。
ボリンジャーバンドが不要な場合は、出来高変化率のアッパーバンド(%, ユーザ指定)を表示して、変化率の度合いを測ることが可能です。
シグナル/アラート
出来高変化率がボリンジャーバンド+2σを超えた場合、もしくはアッパーバンドを超えた場合にシグナル表示します。
同じ条件でアラート設定も可能です。

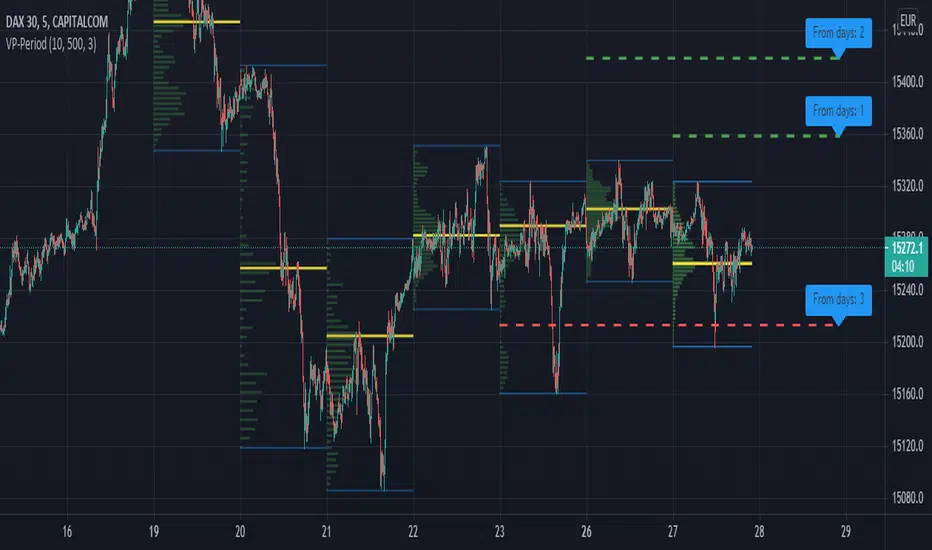
Volume Profile per day with support/resistance linesThis indicator shows the volume profile by daily blocks and draws on the chart the support or resistance lines produced by the previous volume profile block. A support line will be created if in the previous block, the VPOC line was closer to the lowest price line of that block. This support line will be placed below the VPOC line, at a distance equal to the difference between the highest price of that block and the VPOC price. For the case of the resistance line, the logic applied is analogous.
These support and resistance lines are introduced because, according to the Gaussian bell, the VPOC is likely to be located in the middle, and these deviations can be used to trace support and resistance.
In addition, the indicator includes the following features:
- Change the colors of all plotted lines.
- Define the number of daily blocks to be displayed.
- Define the resolution when calculating the volume of each candle.
- Define the number of support/resistance lines to be displayed.
- Highest and lowest price lines, as well as vpoc line, volume histogram and support and resistance lines.
- Display or not, the vpoc line and the volume histogram.
The calculations performed by the script improve if the candles used are of a lower timeframe. This indicator has been tested in several markets, including cryptos, CFDs, Forex and Indices.
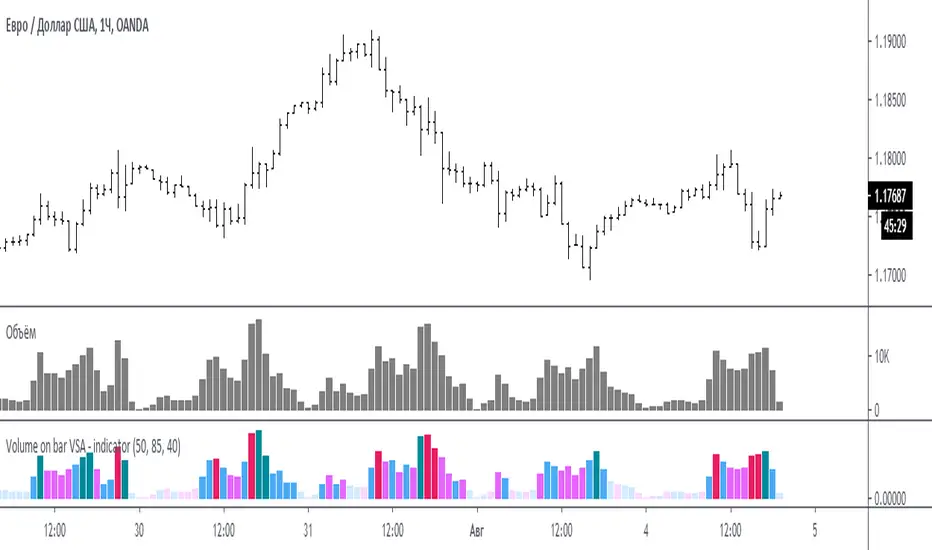
Volume on bar VSA - indicator V2Google translate.
This indicator compares the volume with its average value and tints it depending on whether the tail on the bar is bullish or bearish.
In the settings you can set (sensitivity) for tinting volumes of high and medium
Этот индикатор сравнивает объем со средним его значением и подкрашивает его в зависимости от того какой хвост на баре, бычий или медвежий.
В настройках можно задать (чувствительность) для подкрашивания объемов повышенных и средних
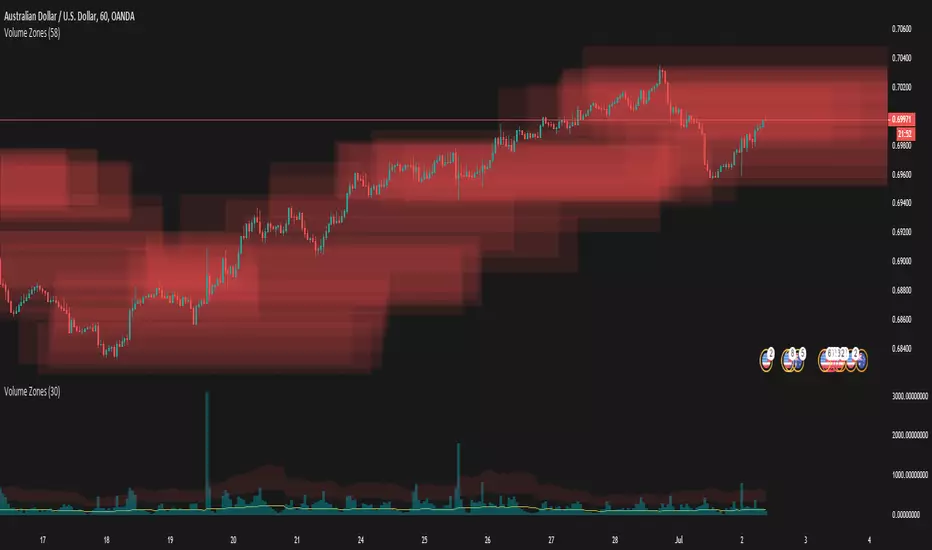
Volume ZonesThis a script that shows where price is trapped in the market based on the volume traded
The plots uses pixels. To correctly see the zones, adjust your zoom and set your level density appropriately